lhs-panel Click here to expand

Report export and customization

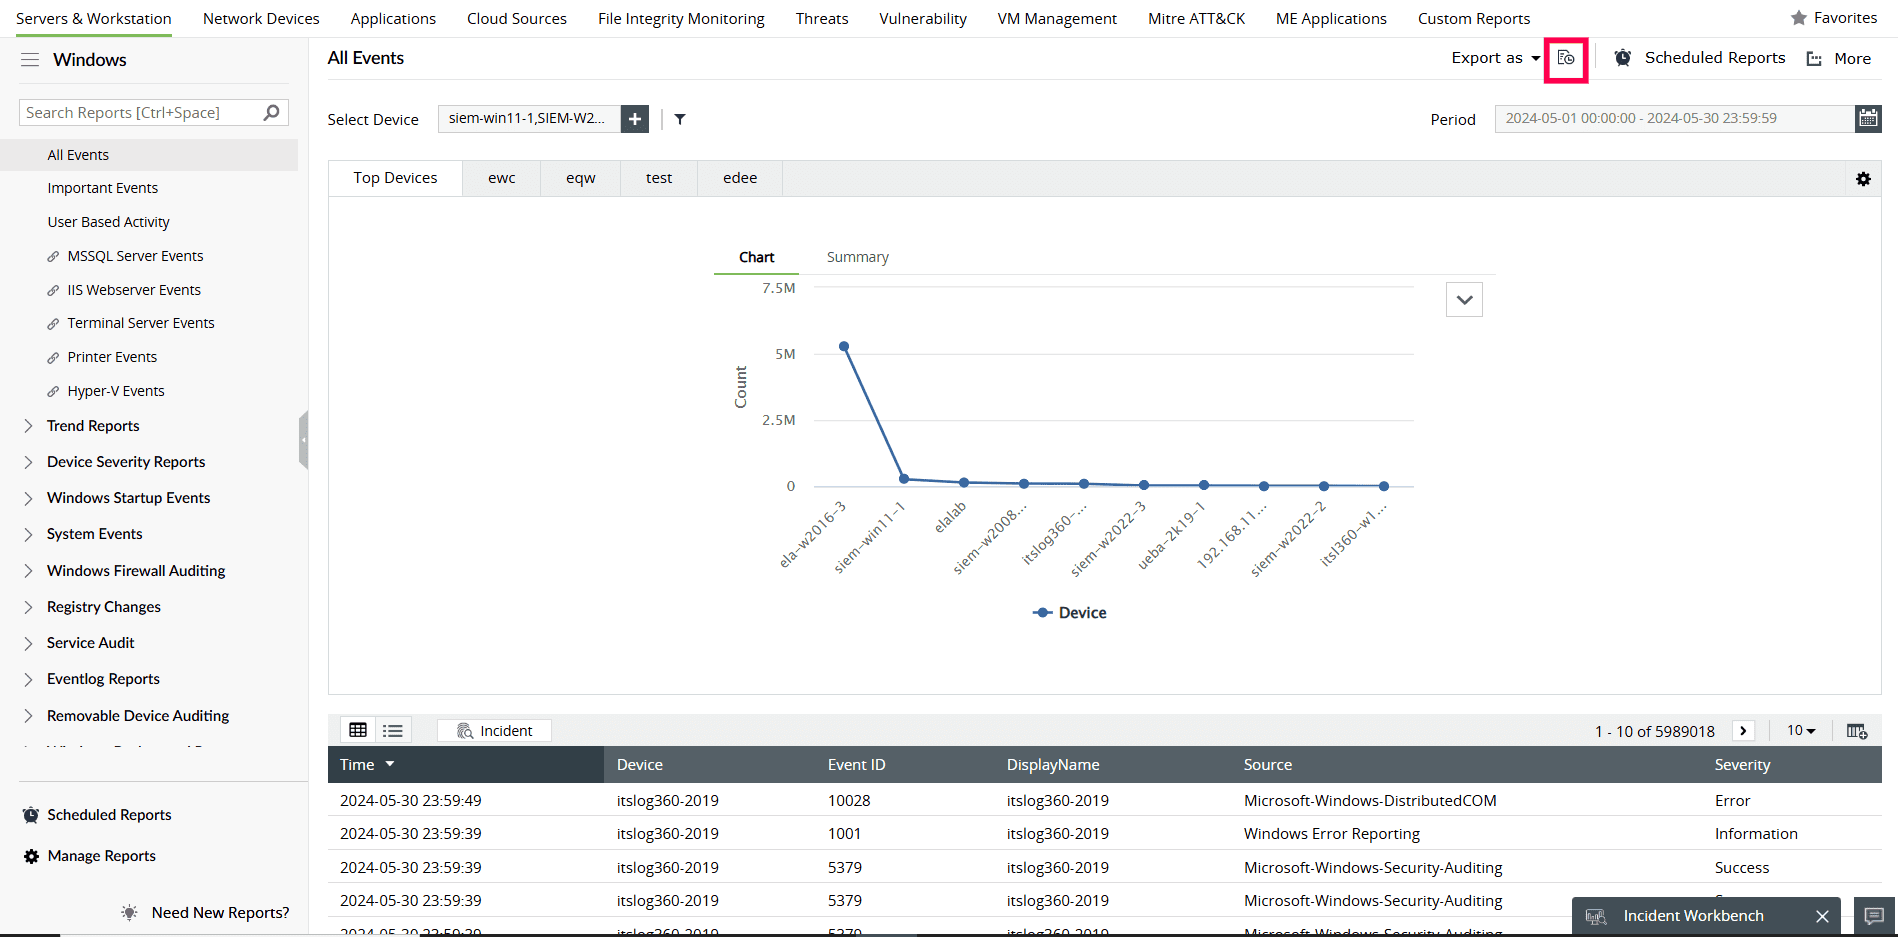
EventLog Analyzer allows you to export reports, add or remove columns in a report and pin the graph to the dashboard.

In this help document, you will learn to perform the following operations.

Report exporting:

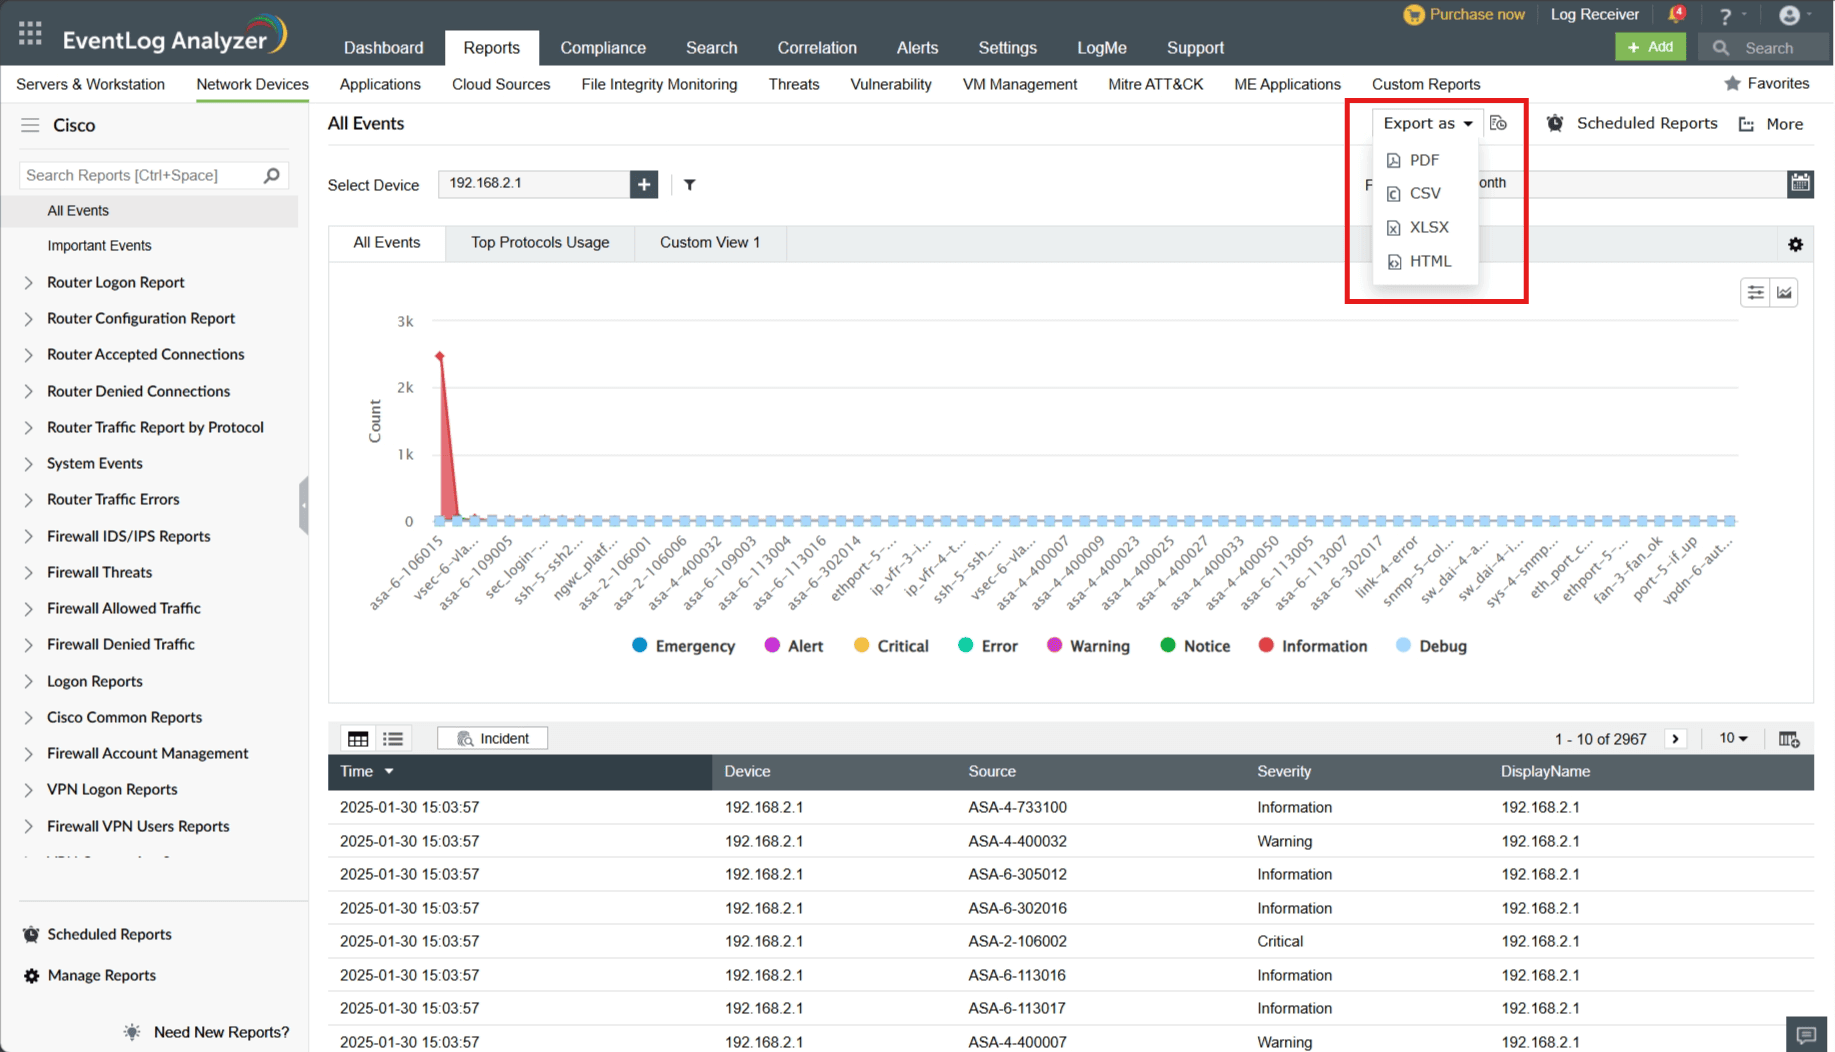
EventLog Analyzer gives users the ability to export reports as PDF, CSV, XLSX( Exports data with a default limit of 50,000 records per sheet) and HTML(Exports data into an HTML file for easier viewing in browsers)

To export reports,

  • Select the report you want to export and click the Export as drop-down button on the top-right corner of the report.
  • Select the format(PDF, CSV, XLSX and HTML.) in which you want the report to be exported.
  • The export history section will open automatically to display the export queue.
  • For each export, you have the option of downloading the report from the queue by selecting an appropriate option.

To view export history, click the Export at the top-right corner of a report. A list of the most recently exported reports will be displayed.

Report export and customization
Note: XLSX and HTML exports will include only tabular data and will not include graphs.

Adding or removing columns:

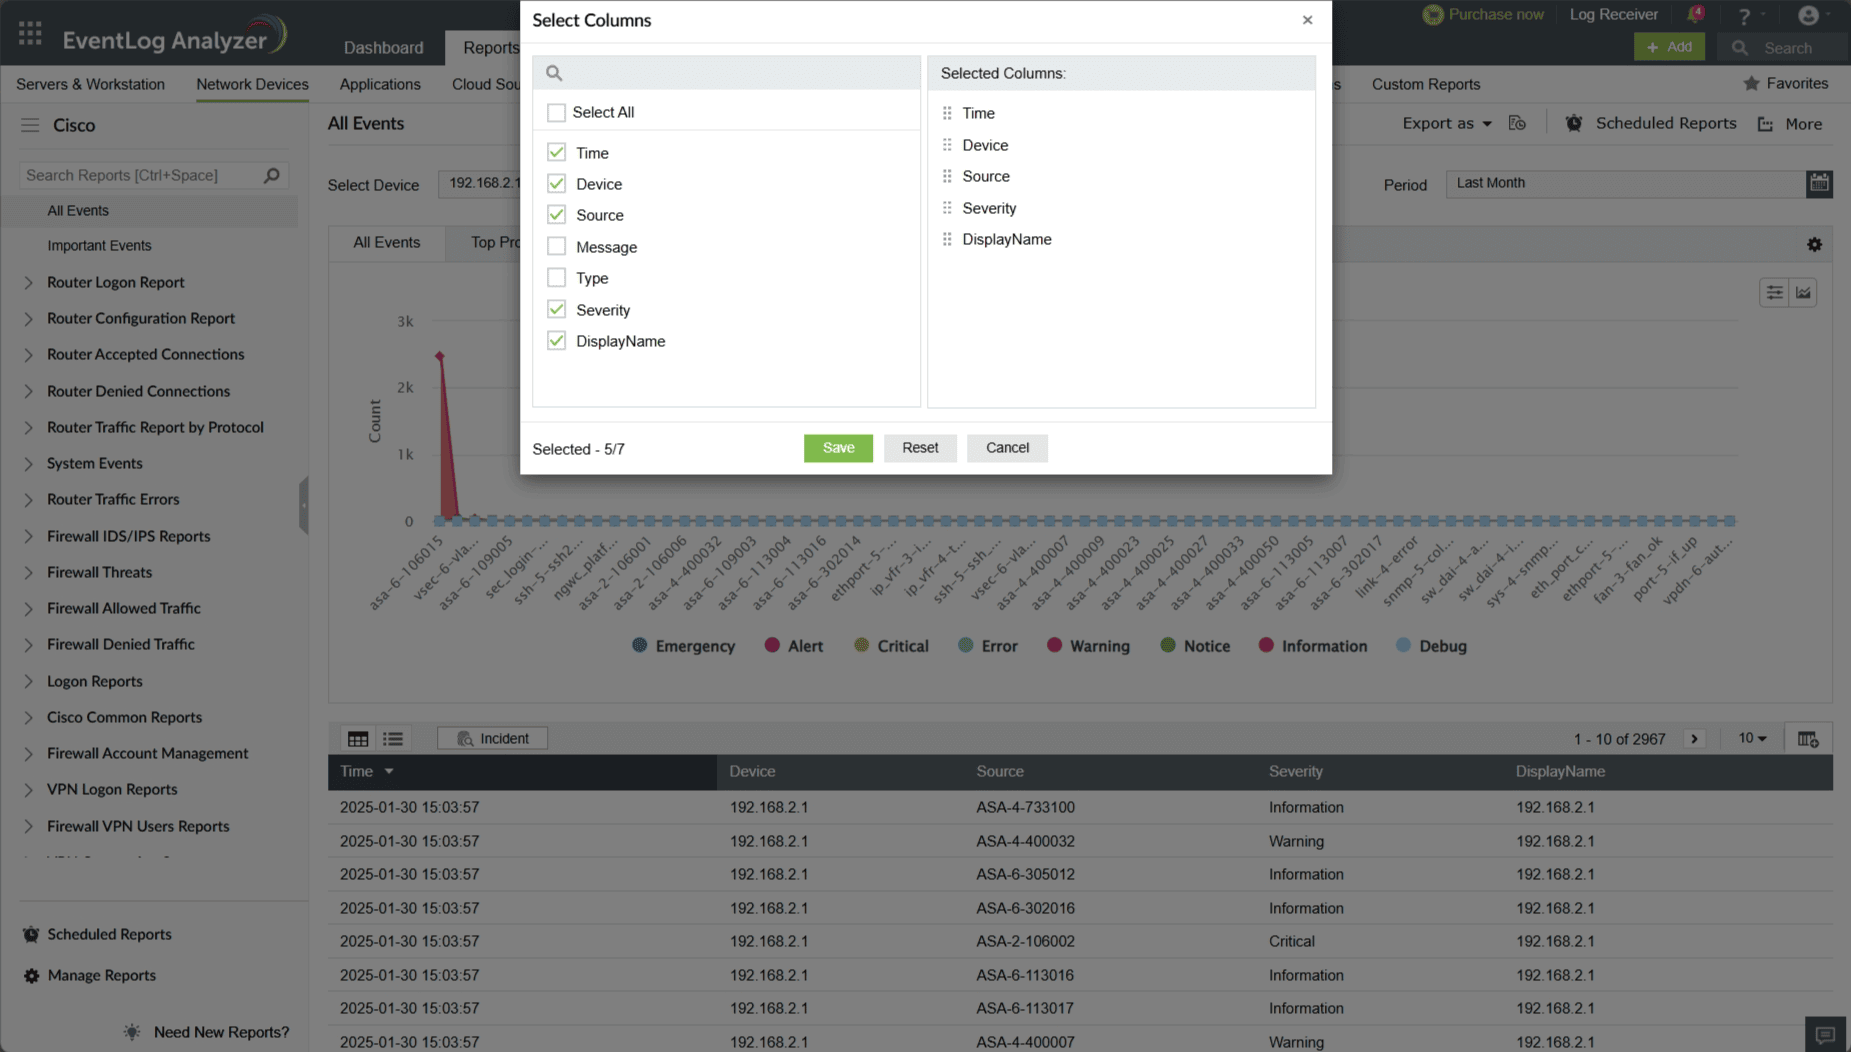
EventLog Analyzer gives users the ability to add or remove columns to the reports.

To add or remove columns:

  • Select the report you want to add or remove columns and click Columns on the top-right corner of the report.
  • In the pop-up window, select the fields you want to display in the search results by ticking the corresponding boxes. To exclude fields, simply leave the boxes unticked.
  • Report export and customization
  • You can also rearrange the selected columns by dragging and dropping the column names accordingly, in the Selected Columns section.
  • Click Save to apply your preferences.
  • Now you have the options to Select all and Reset back to default settings.
Note:
  • When the reports are exported, the columns that have been selected will be represented.
  • Select All will be shown only when the Number of Fields is less than 10.

Pinning the graph to the dashboard:

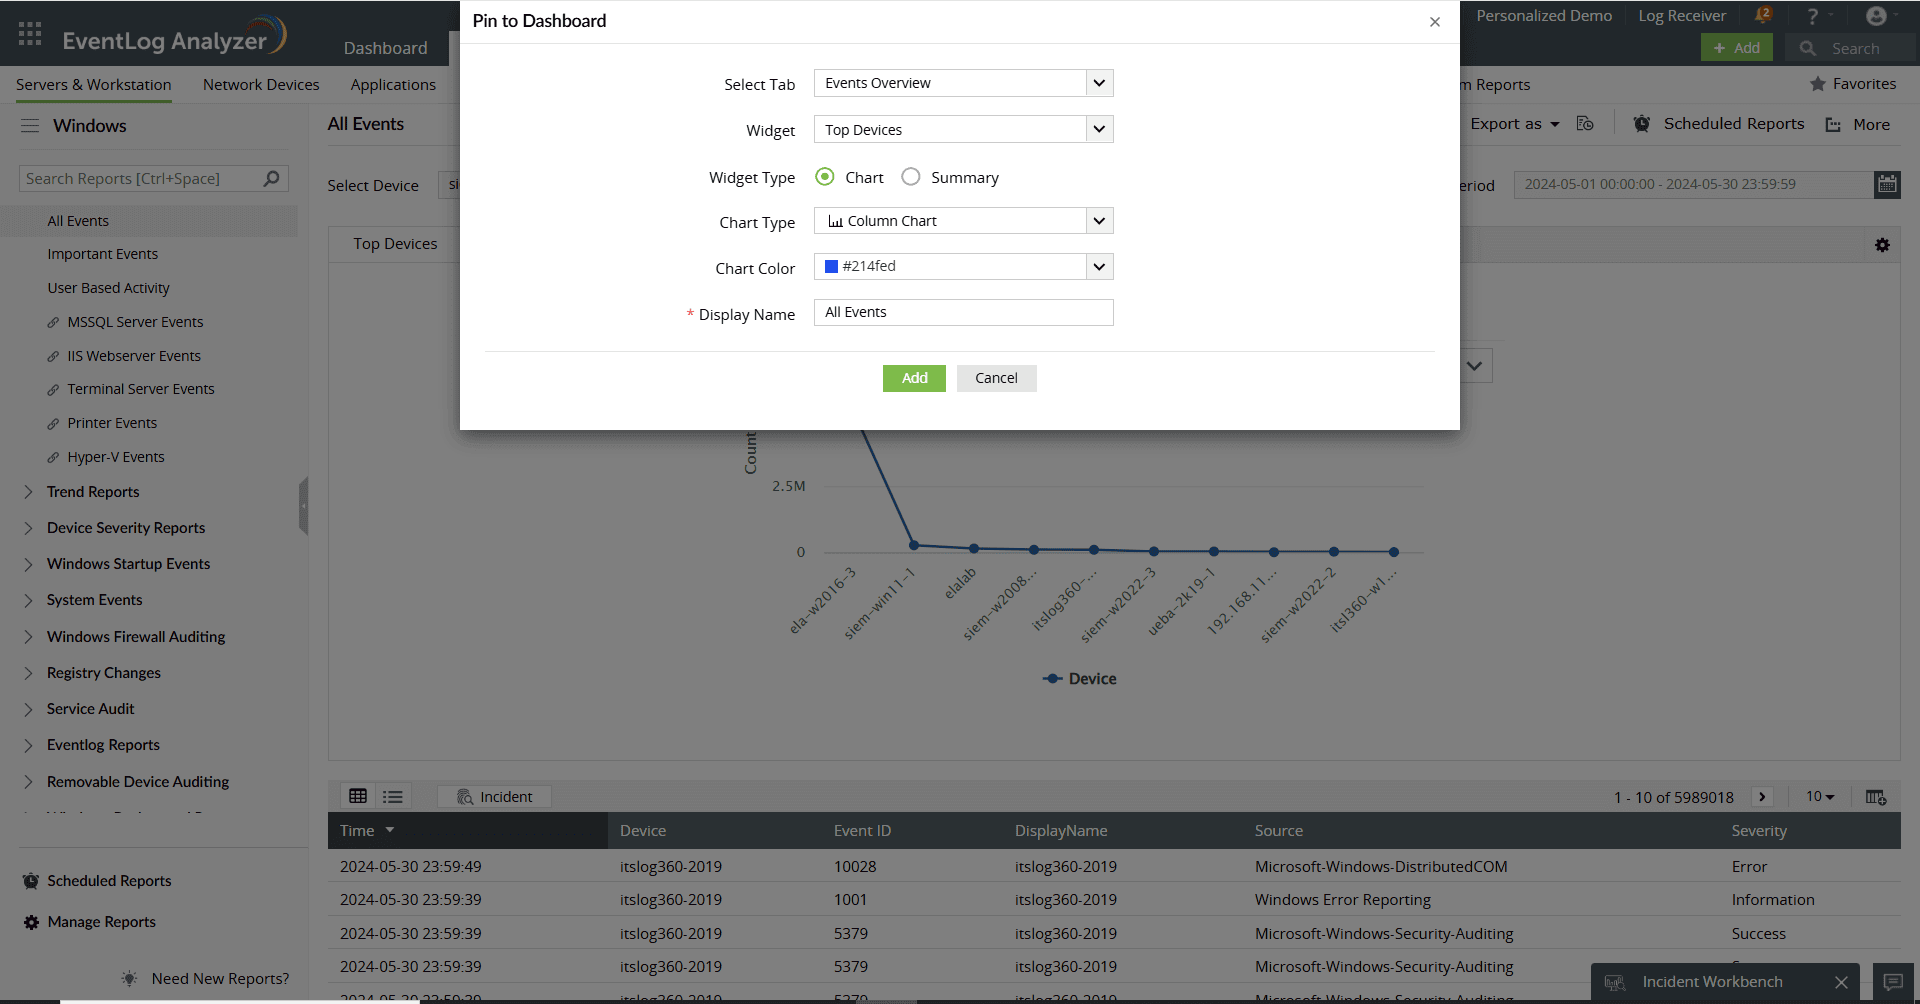
EventLog Analyzer gives users the ability to pin graphs to the dashboard.

To pin a graph:

  • Select the report you want to pin.
  • Click the More drop-down button on the top right corner and select Pin to Dashboard.
  • In the pop-up window, you can select the tab, widget, widget type, and display name of the widget that you'd like to pin.
  • Report export and customization
  • Click Add to save your preferences.

Adding Annotation to Report Export

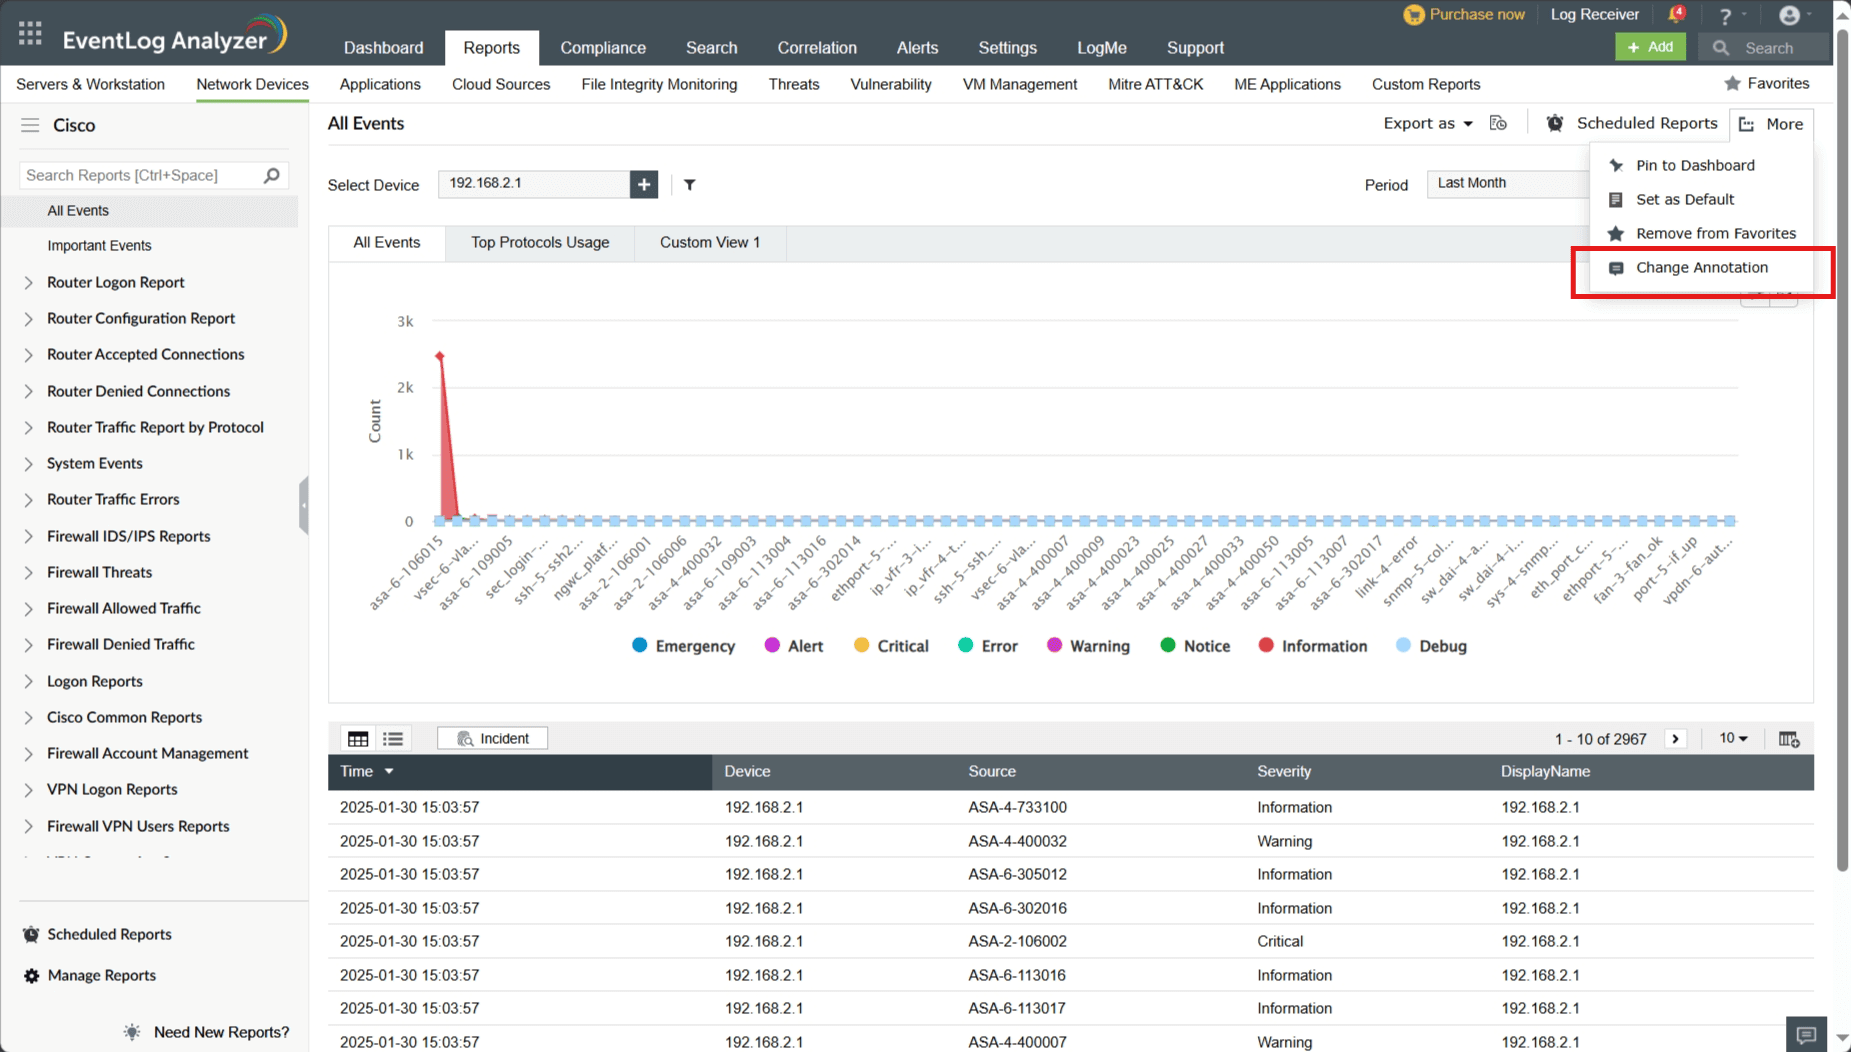
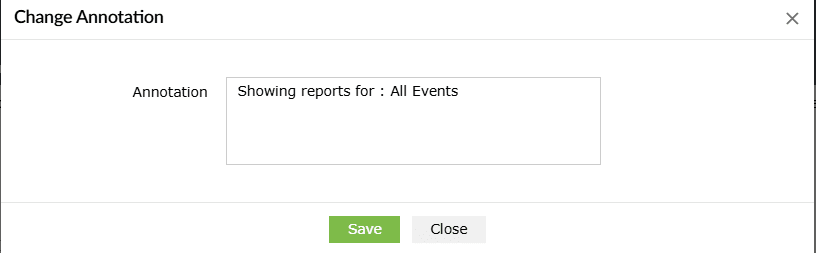
You can add custom annotations for the reports. These annotations will be displayed in PDF, HTML, and XLSX Report exports.

To add annotation,

  • Navigate to the report you want to add Annotation.
  • In the top-right corner of the report, click More and select Change Annotation.
  • Update the annotation to the desired requirement. Click "Save".
  • All the above-mentioned exports of this report will have Custom Annotation from now on.

Calendar Functionality

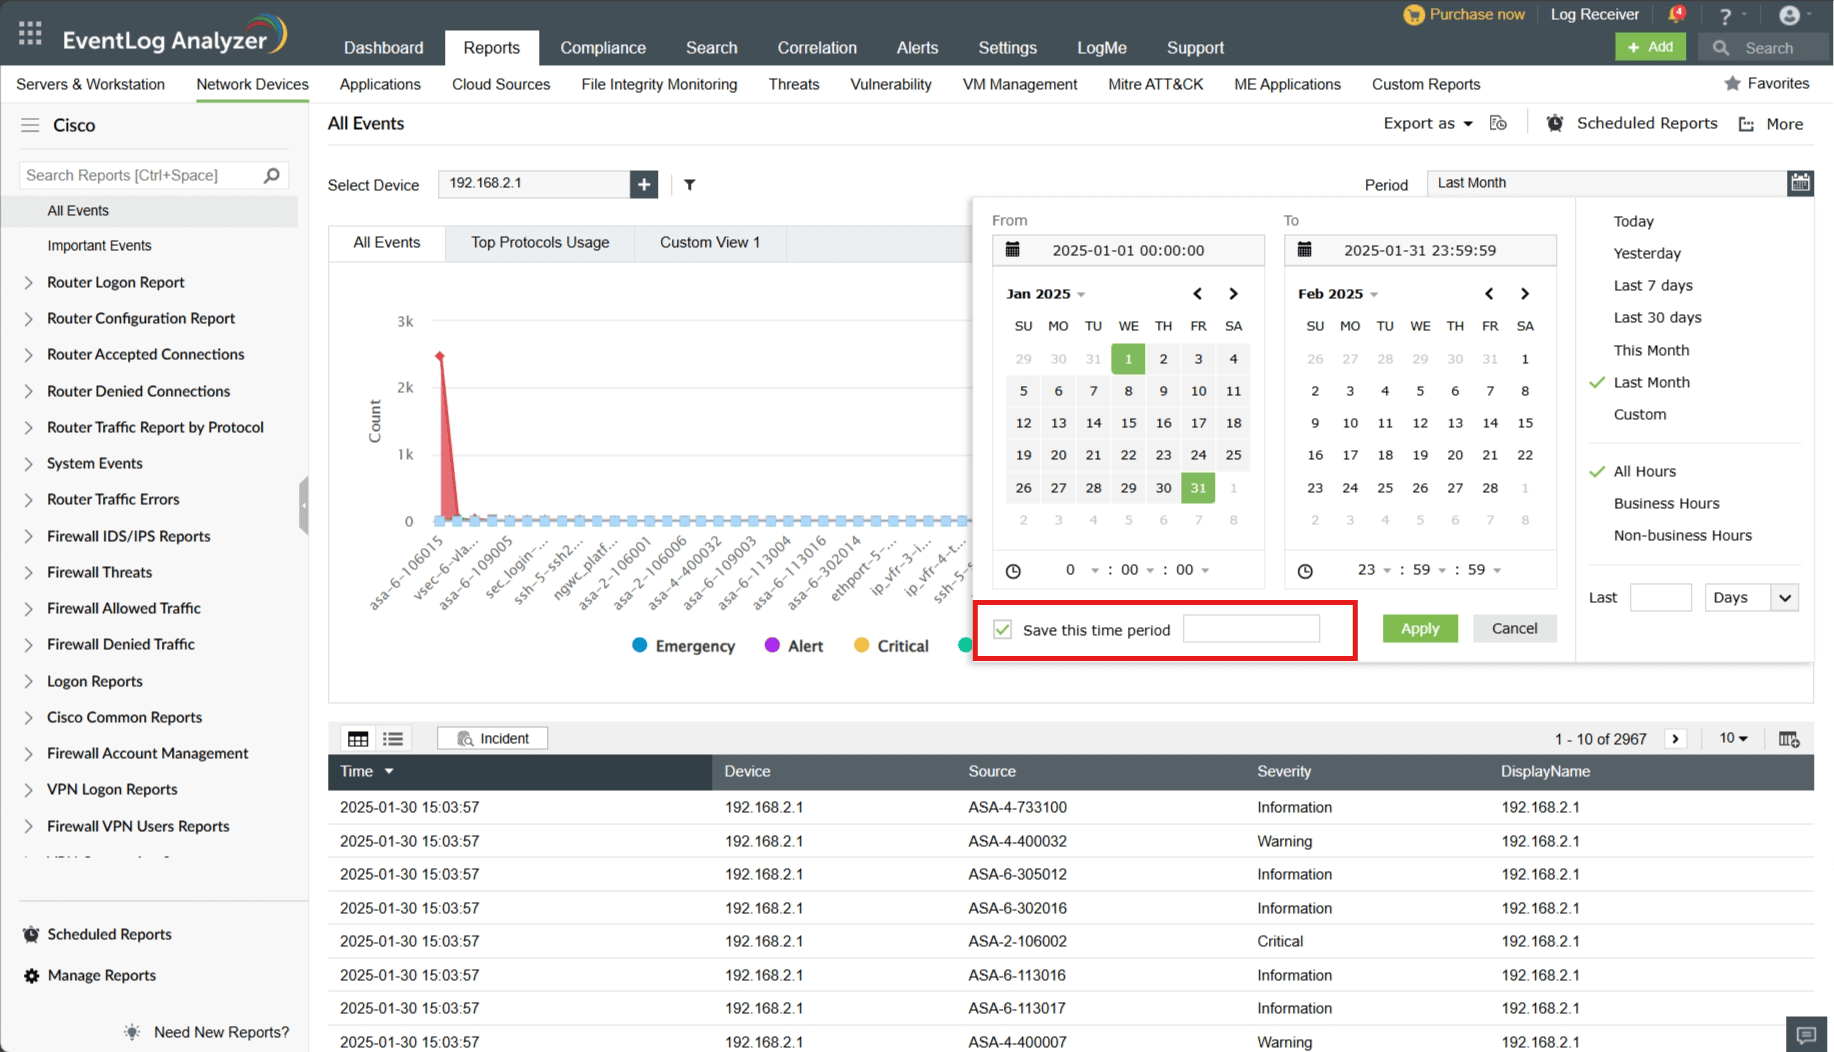
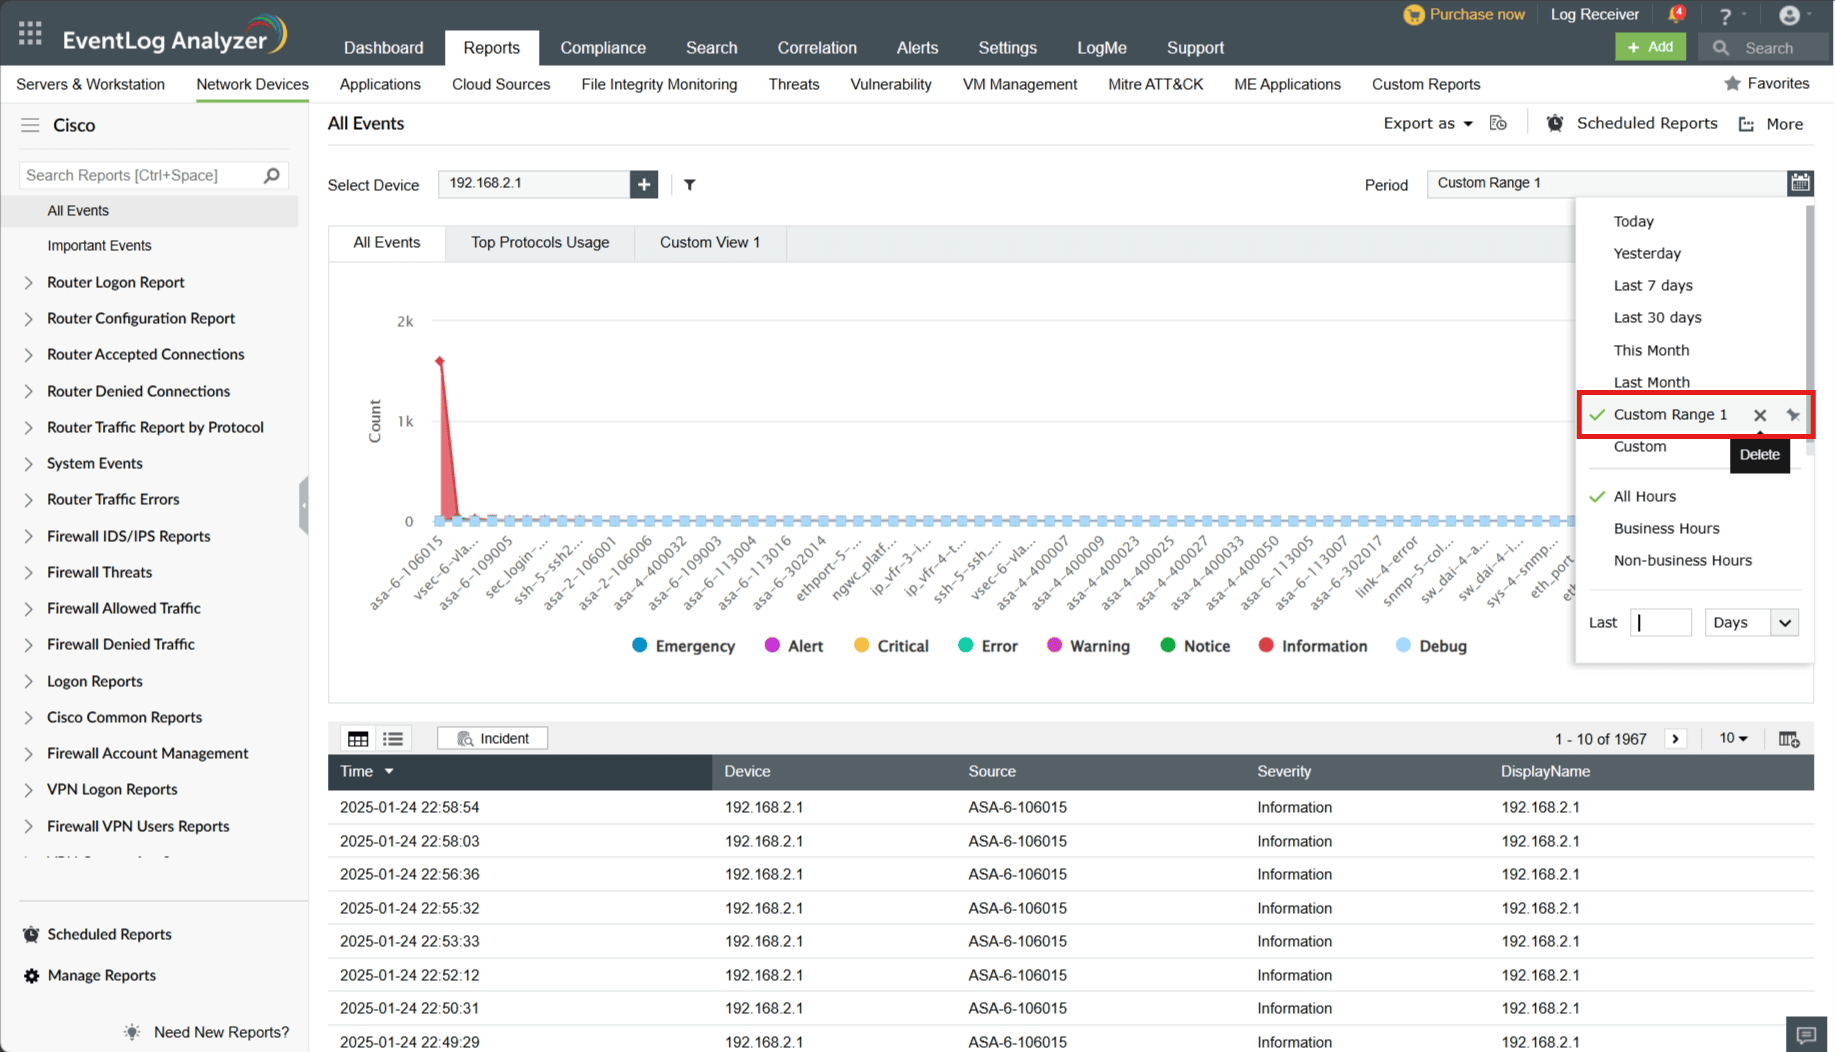
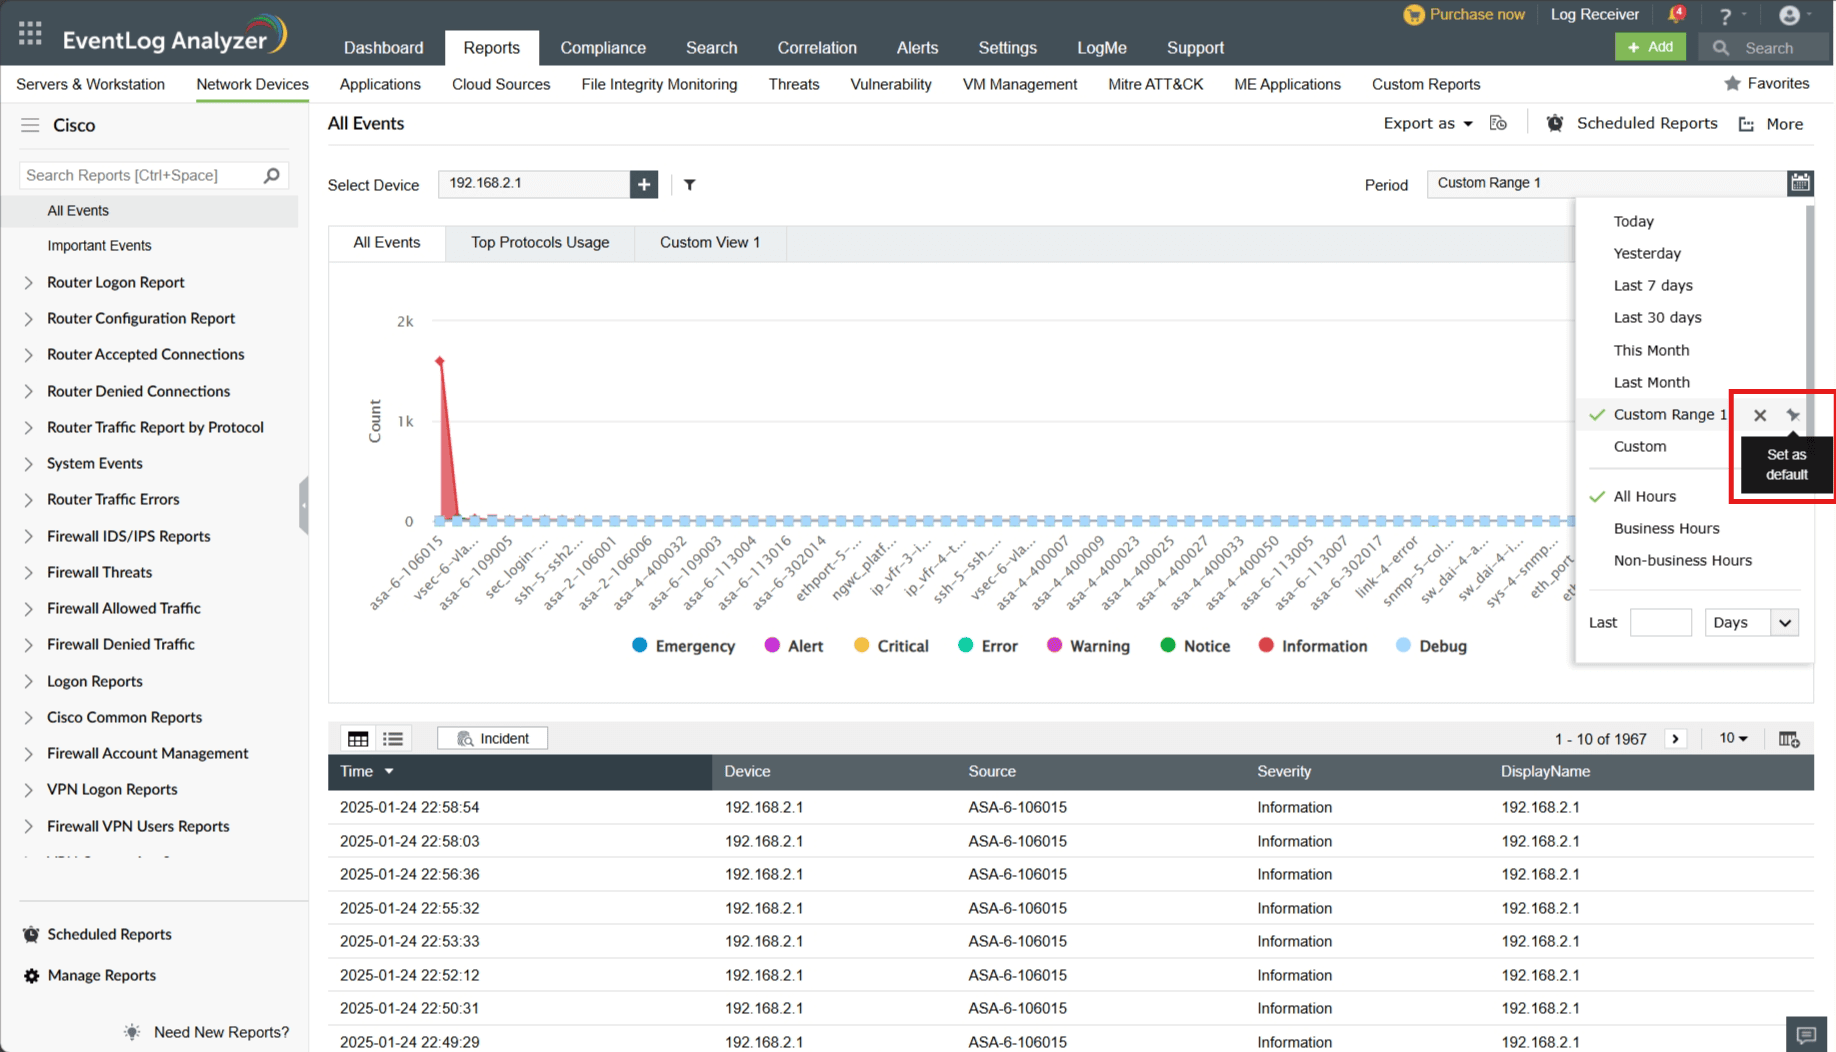
The Calendar Functionality feature introduces enhanced options for managing date ranges. This functionality provides greater flexibility and efficiency when working with date-specific data.

NOTE: The calendar functionality is also accessible through dashboard, search, correlation, alerts, workflow-history, renindex and compliance tabs.

The date ranges can be managed in two ways as follows:

  1. Custom Ranges:
    • Create new date ranges by selecting the Custom Range option.
    • Easily delete any custom ranges that are no longer needed.
  2. 2. Pinned Calendar Ranges:
    • Pin a specific calendar range to a report.
    • The pinned range will automatically load each time the report is accessed or reloaded, ensuring consistency and saving time.

Field Units

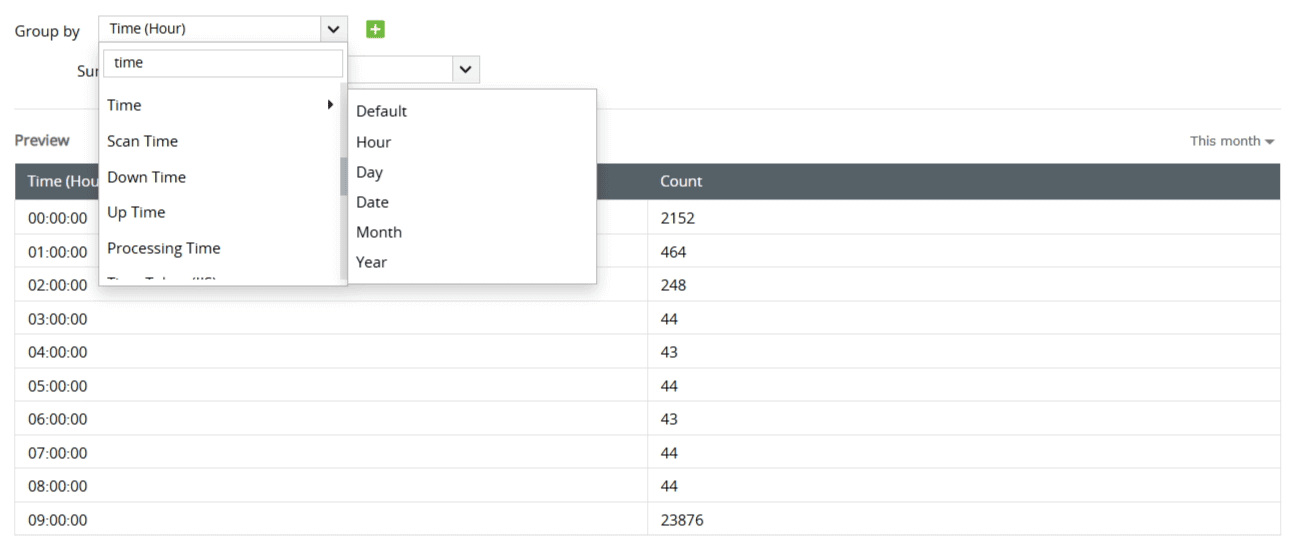
When creating a Custom Report or Report Views based on summary or pivot view, the following units are available for the field Time, which will determine the unit of time:

Hour - The time will be represented hour-wise.

Day - The time will be represented day-wise (by days of the week).

Date - The time will be represented date-wise (by dates of the month).

Month - The time will be represented month-wise (by months of the year).

Year - The time will be represented year-wise.

Default - The time unit will adjust dynamically based on the selected time range in the date range picker. For example, if the time range is more than one hour, the time will be shown hour-wise; if the range exceeds one day, it will be displayed date-wise, and so on.

Note: If a custom report or report view is based on the time unit "Hour", the time range is restricted to a maximum of 12 months for viewing data.

Copyright © 2020, ZOHO Corp. All Rights Reserved.

Get download link