Customizing Dashboard Views
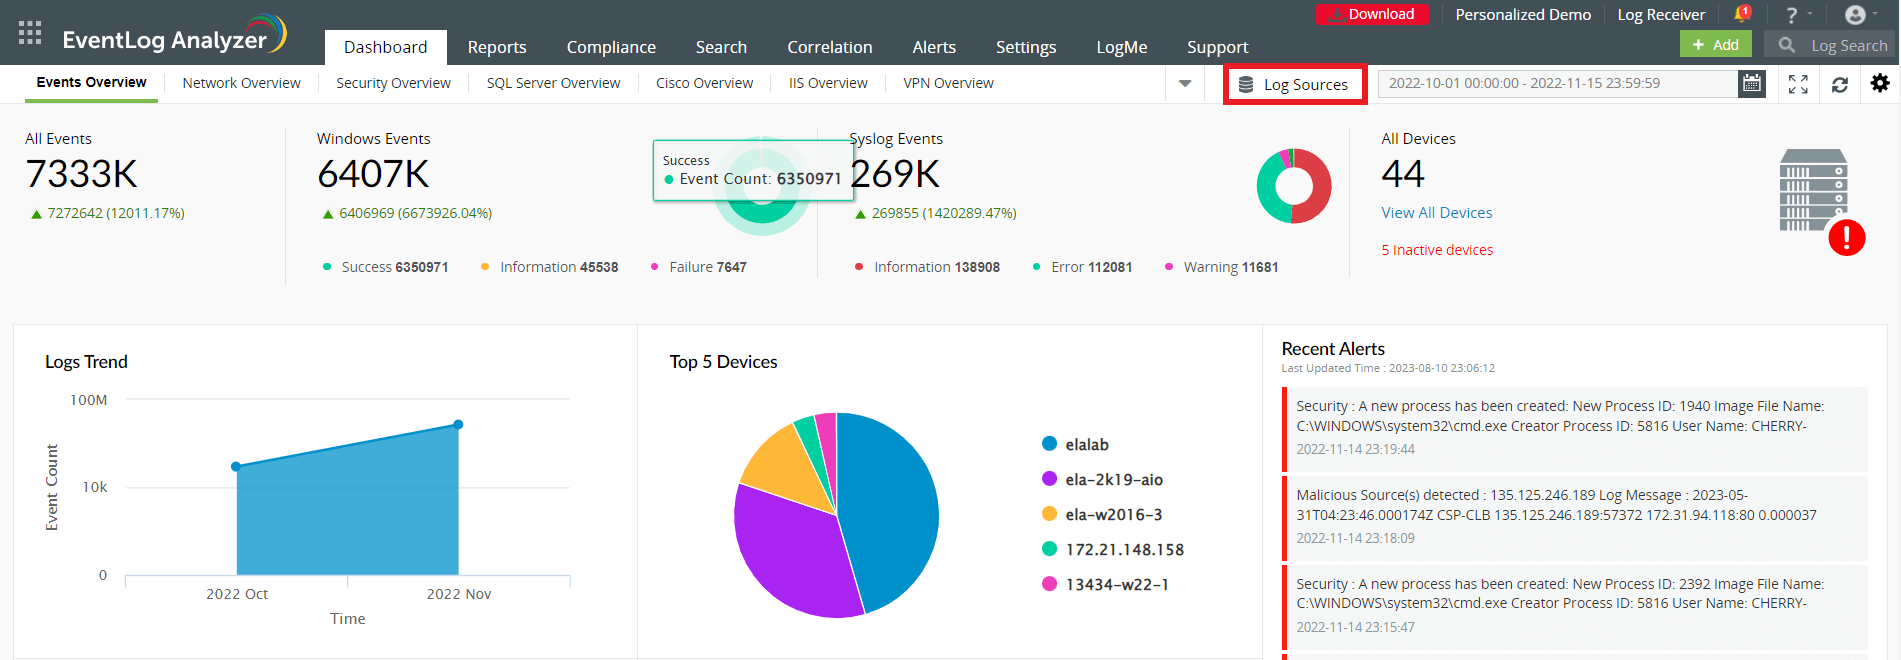
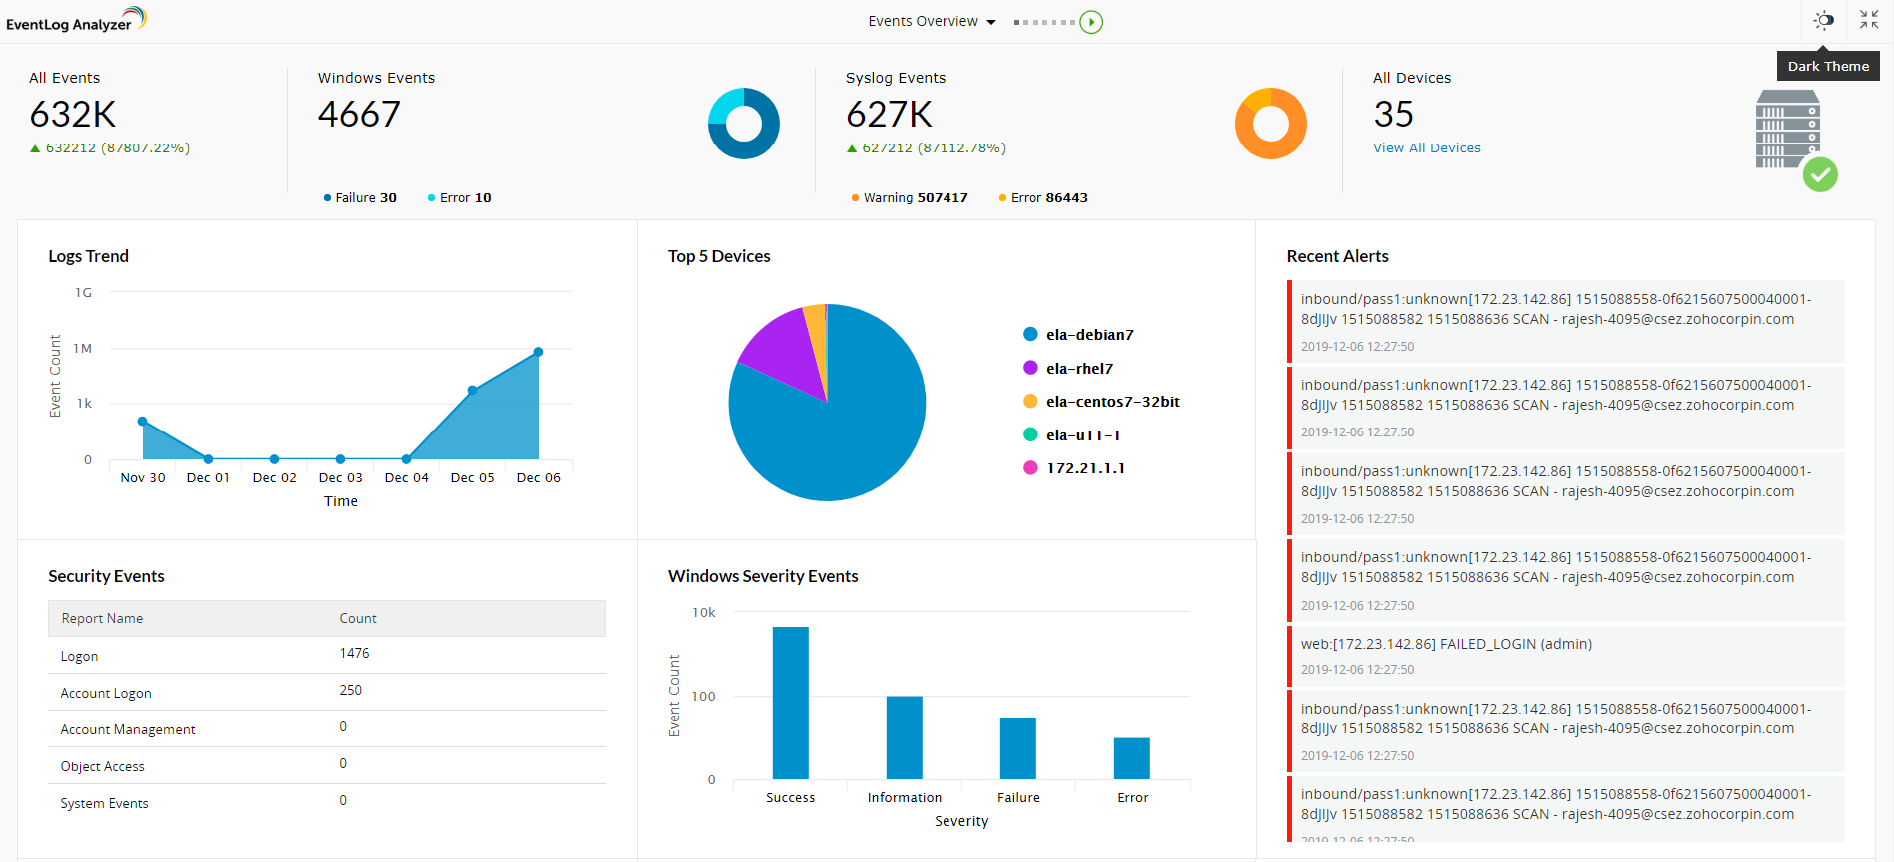
The dashboard is populated using the data collected from various log sources. Click Log Sources on the top-right corner of the dashboard to view the list of devices, applications, and monitored files from which the data is being collected.
To edit dashboard profiles, click here.
To customize the dashboard according to your preferences, the following options are available to you:
Adding a new tab to the dashboard
To add a new tab to the dashboard,
- In EventLog Analyzer's dashboard, click the
 icon on the top-right corner and select Add Tab.
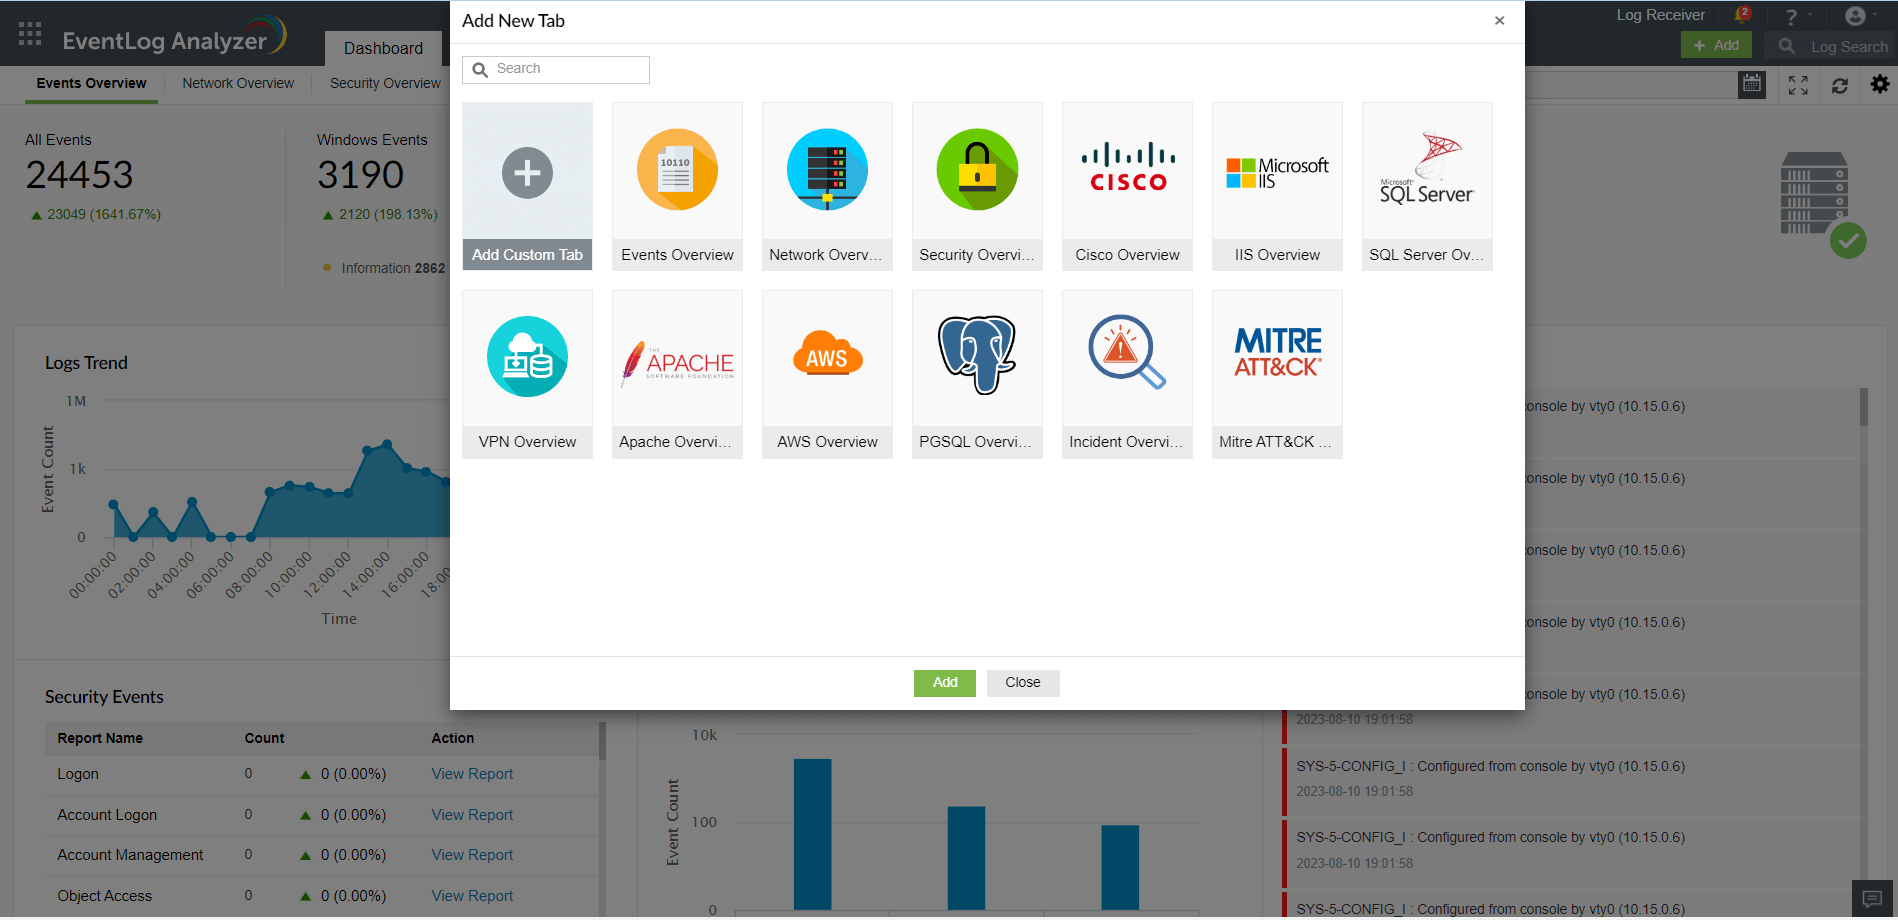
- In the pop-up box that appears, you can see the following:
- Three default tabs: Events Overview, Network Overview, and Security Overview
- Three predefined templates: Cisco Overview, IIS Overview, and SQL Server Overview
- Add Custom Tab option
- Click Add Custom Tab. Enter a name for the tab in the given field and click Add.
- Navigate to the new tab in your dashboard and click Add Widget to start adding widgets of your choice.
If you want to add an existing report as a widget, click
here to know how.
Adding a new widget to a tab
To add a new widget,
- In EventLog Analyzer's dashboard, navigate to the tab to which you want to add a new widget and click the icon on the top-right corner.
- Click Add Widget. In the pop-up box that appears, select the widget, widget type, chart type, chart color, and enter a display name for the widget.
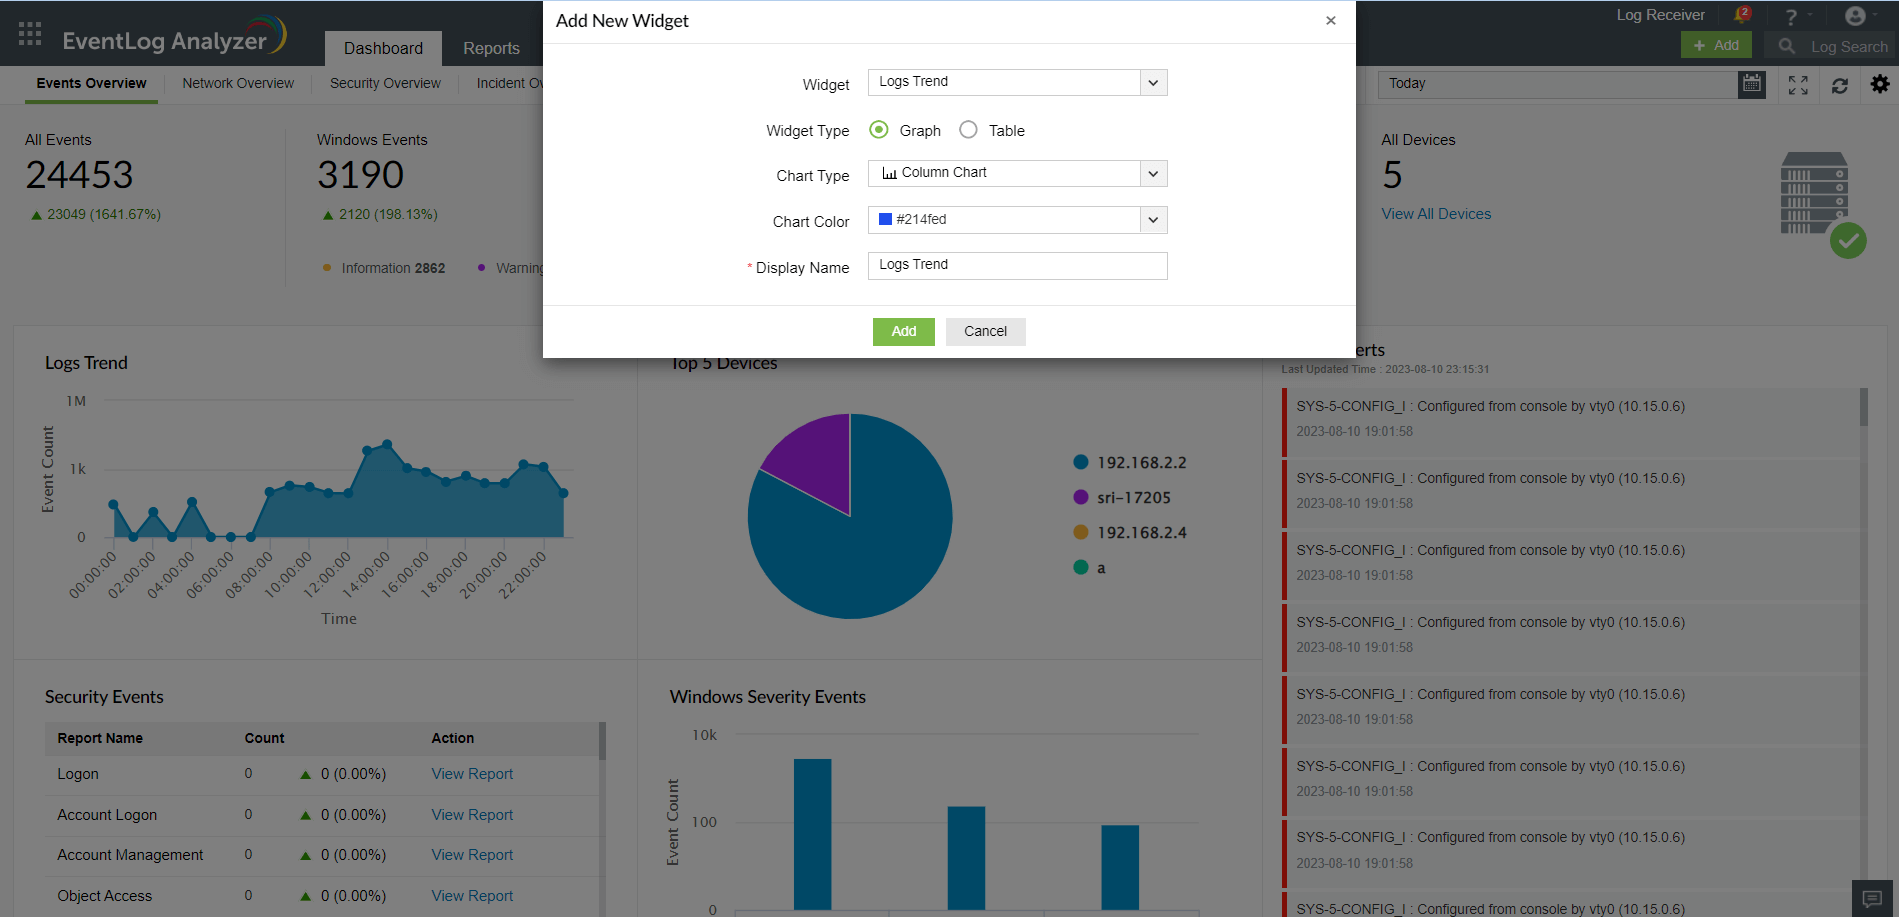
- Once you've entered all the details, click Add.
You also have the option of
pinning a report as a new widget. To know how, click
here.
Deleting and reordering tabs in the dashboard
To delete tabs from the dashboard,
- In EventLog Analyzer's dashboard, click the icon on the top-right corner and click Manage Tabs.
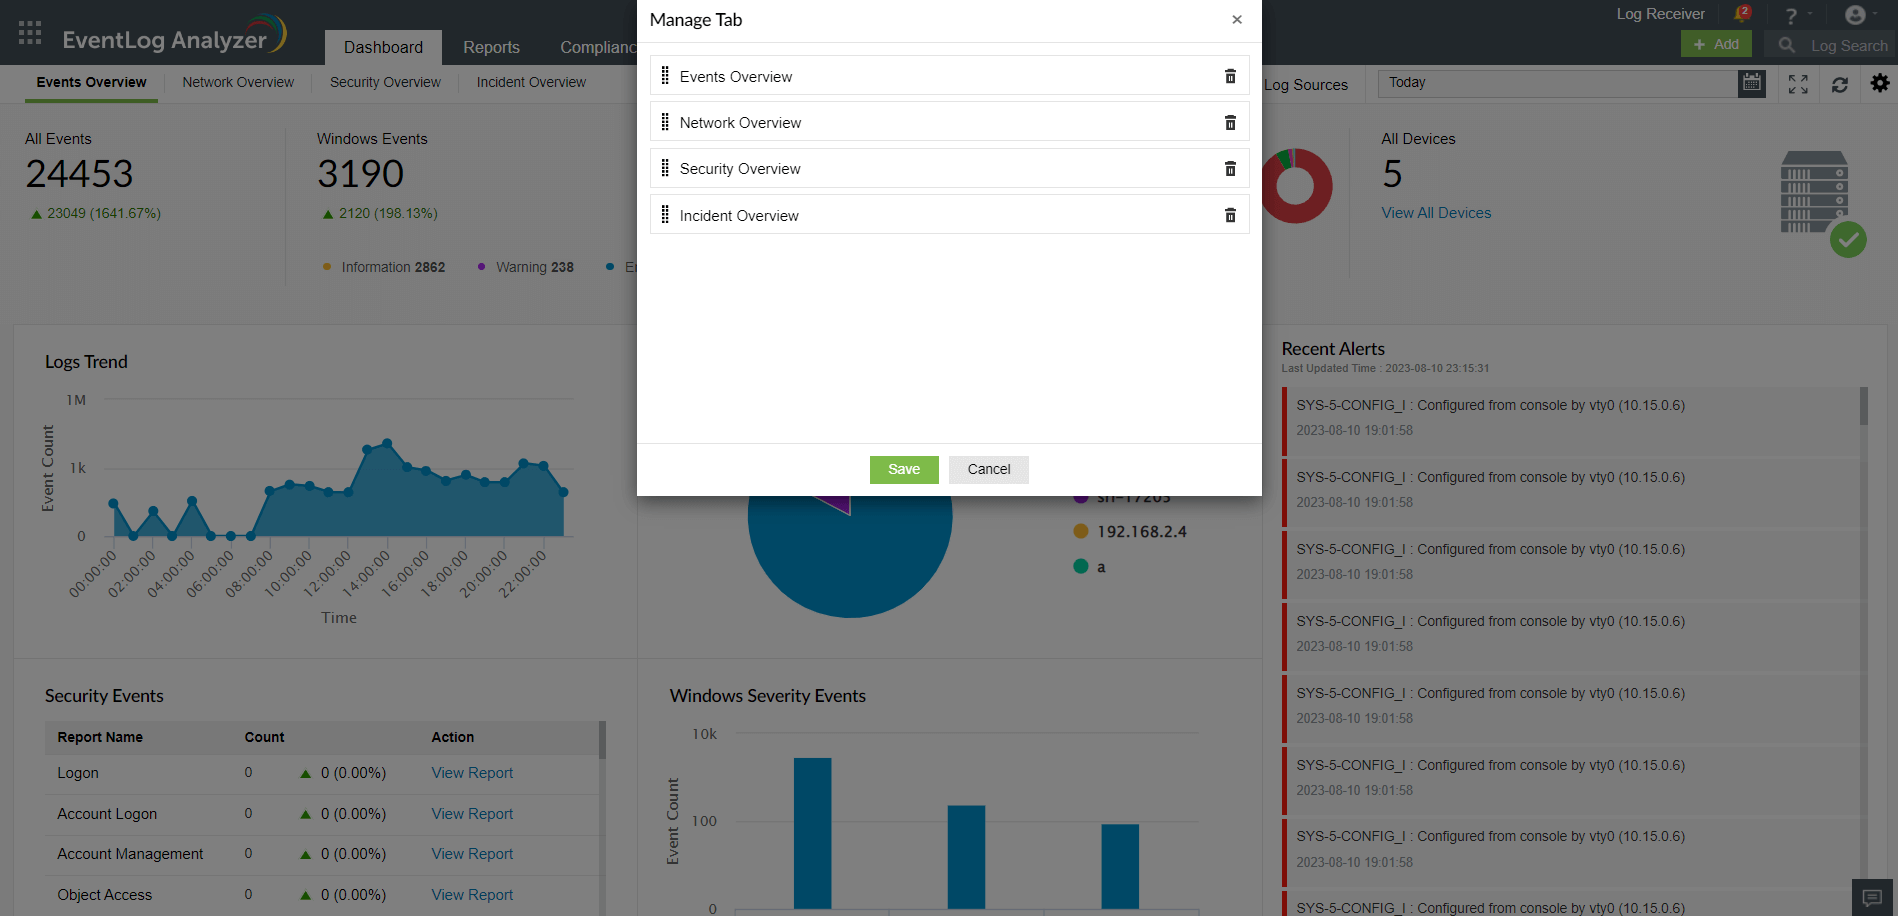
- In the Manage Tab dialog box that appears, click the
 icon corresponding to that tab that you want to delete.
- In the pop-up confirmation box, click Yes to complete the deletion of the tab
To edit the order of tabs in the dashboard,
- In EventLog Analyzer's dashboard, click the icon on the top-right corner and click Manage Tabs.
- Click the
 icon and drag and drop the tabs in the order of your choice.
Reordering and resizing widgets
To reorder the widgets in a tab,
- In EventLog Analyzer's dashboard, navigate to the tab whose widgets you want to reorder, click the icon on the top-right corner and click Reorder Widgets.
- Click and drag the widgets wherever you want to place them.
- You can also resize widgets by dragging them from their bottom-right corner and adjusting their sizes as required.
- Click on the Save button present on the top-right corner.
Editing and deleting widgets
To edit a widget in a tab,
- In EventLog Analyzer's dashboard, click the
 icon corresponding to the widget that you want to edit.
- Select Edit Widget. Update the necessary information and click Update.
To delete a widget from a tab,
- In EventLog Analyzer's dashboard, click the icon corresponding to the widget that you want to delete.
- Select Delete Widget and click Yes in the pop-up box that appears.
Viewing the dashboard in full screen mode
To view the dashboard in full screen,
- In EventLog Analyzer's dashboard, click the
 icon on the top-right corner.
- In the full screen view, you can view a slideshow of the tabs by clicking the play icon
 located at the top of the screen.
- You can switch to different tabs by clicking on the drop-down button
 located at the top of the screen.
- You can also remove a particular tab from the slideshow by clicking the toggle button next to the name of the tab in the drop-down list.
- You can also switch to dark mode by clicking the toggle button
 at the top-right corner of the screen.
- To go back to the normal viewing mode, click the
 icon.
icon.
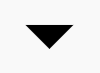
Viewing a widget in full screen mode
To view a widget in full screen, in EventLog Analyzer's dashboard, click the icon on the top-right corner of the widget you want to view.
Refreshing the dashboard and widgets
To refresh the dashboard, in EventLog Analyzer's dashboard, click the  icon on the top-right corner of the screen.
To refresh a particular widget, in EventLog Analyzer's dashboard, click the icon on the top-right corner of the widget.
Changing refresh interval
To change the time interval for the automatic refreshing of the dashboard,
- In EventLog Analyzer's dashboard, click the icon on the top-right corner and click Refresh Interval.
- In the pop-up box that appears, select the refresh interval—Never, 30 Secs, 1 Min, 5 Mins, 10 Mins, and 1 Hr.
Note: If you choose Never for the refresh interval, the dashboard will never be refreshed automatically. You will have to refresh it manually.
Check out our video for a step by step demonstration of customizing the EventLog Analyzer dashboard here.
Configuring the Embed Dashboard
The Embed Dashboard enhances data sharing by enabling the creation of external share links for specific tabs or widgets. This allows precise and targeted data access within a dashboard, facilitating focused collaboration and streamlined decision-making across various platforms. The Embedded Dashboard feature allows users to create an External Share Link for a particular tab or a specific widget within the dashboard.
To embed a dashboard,
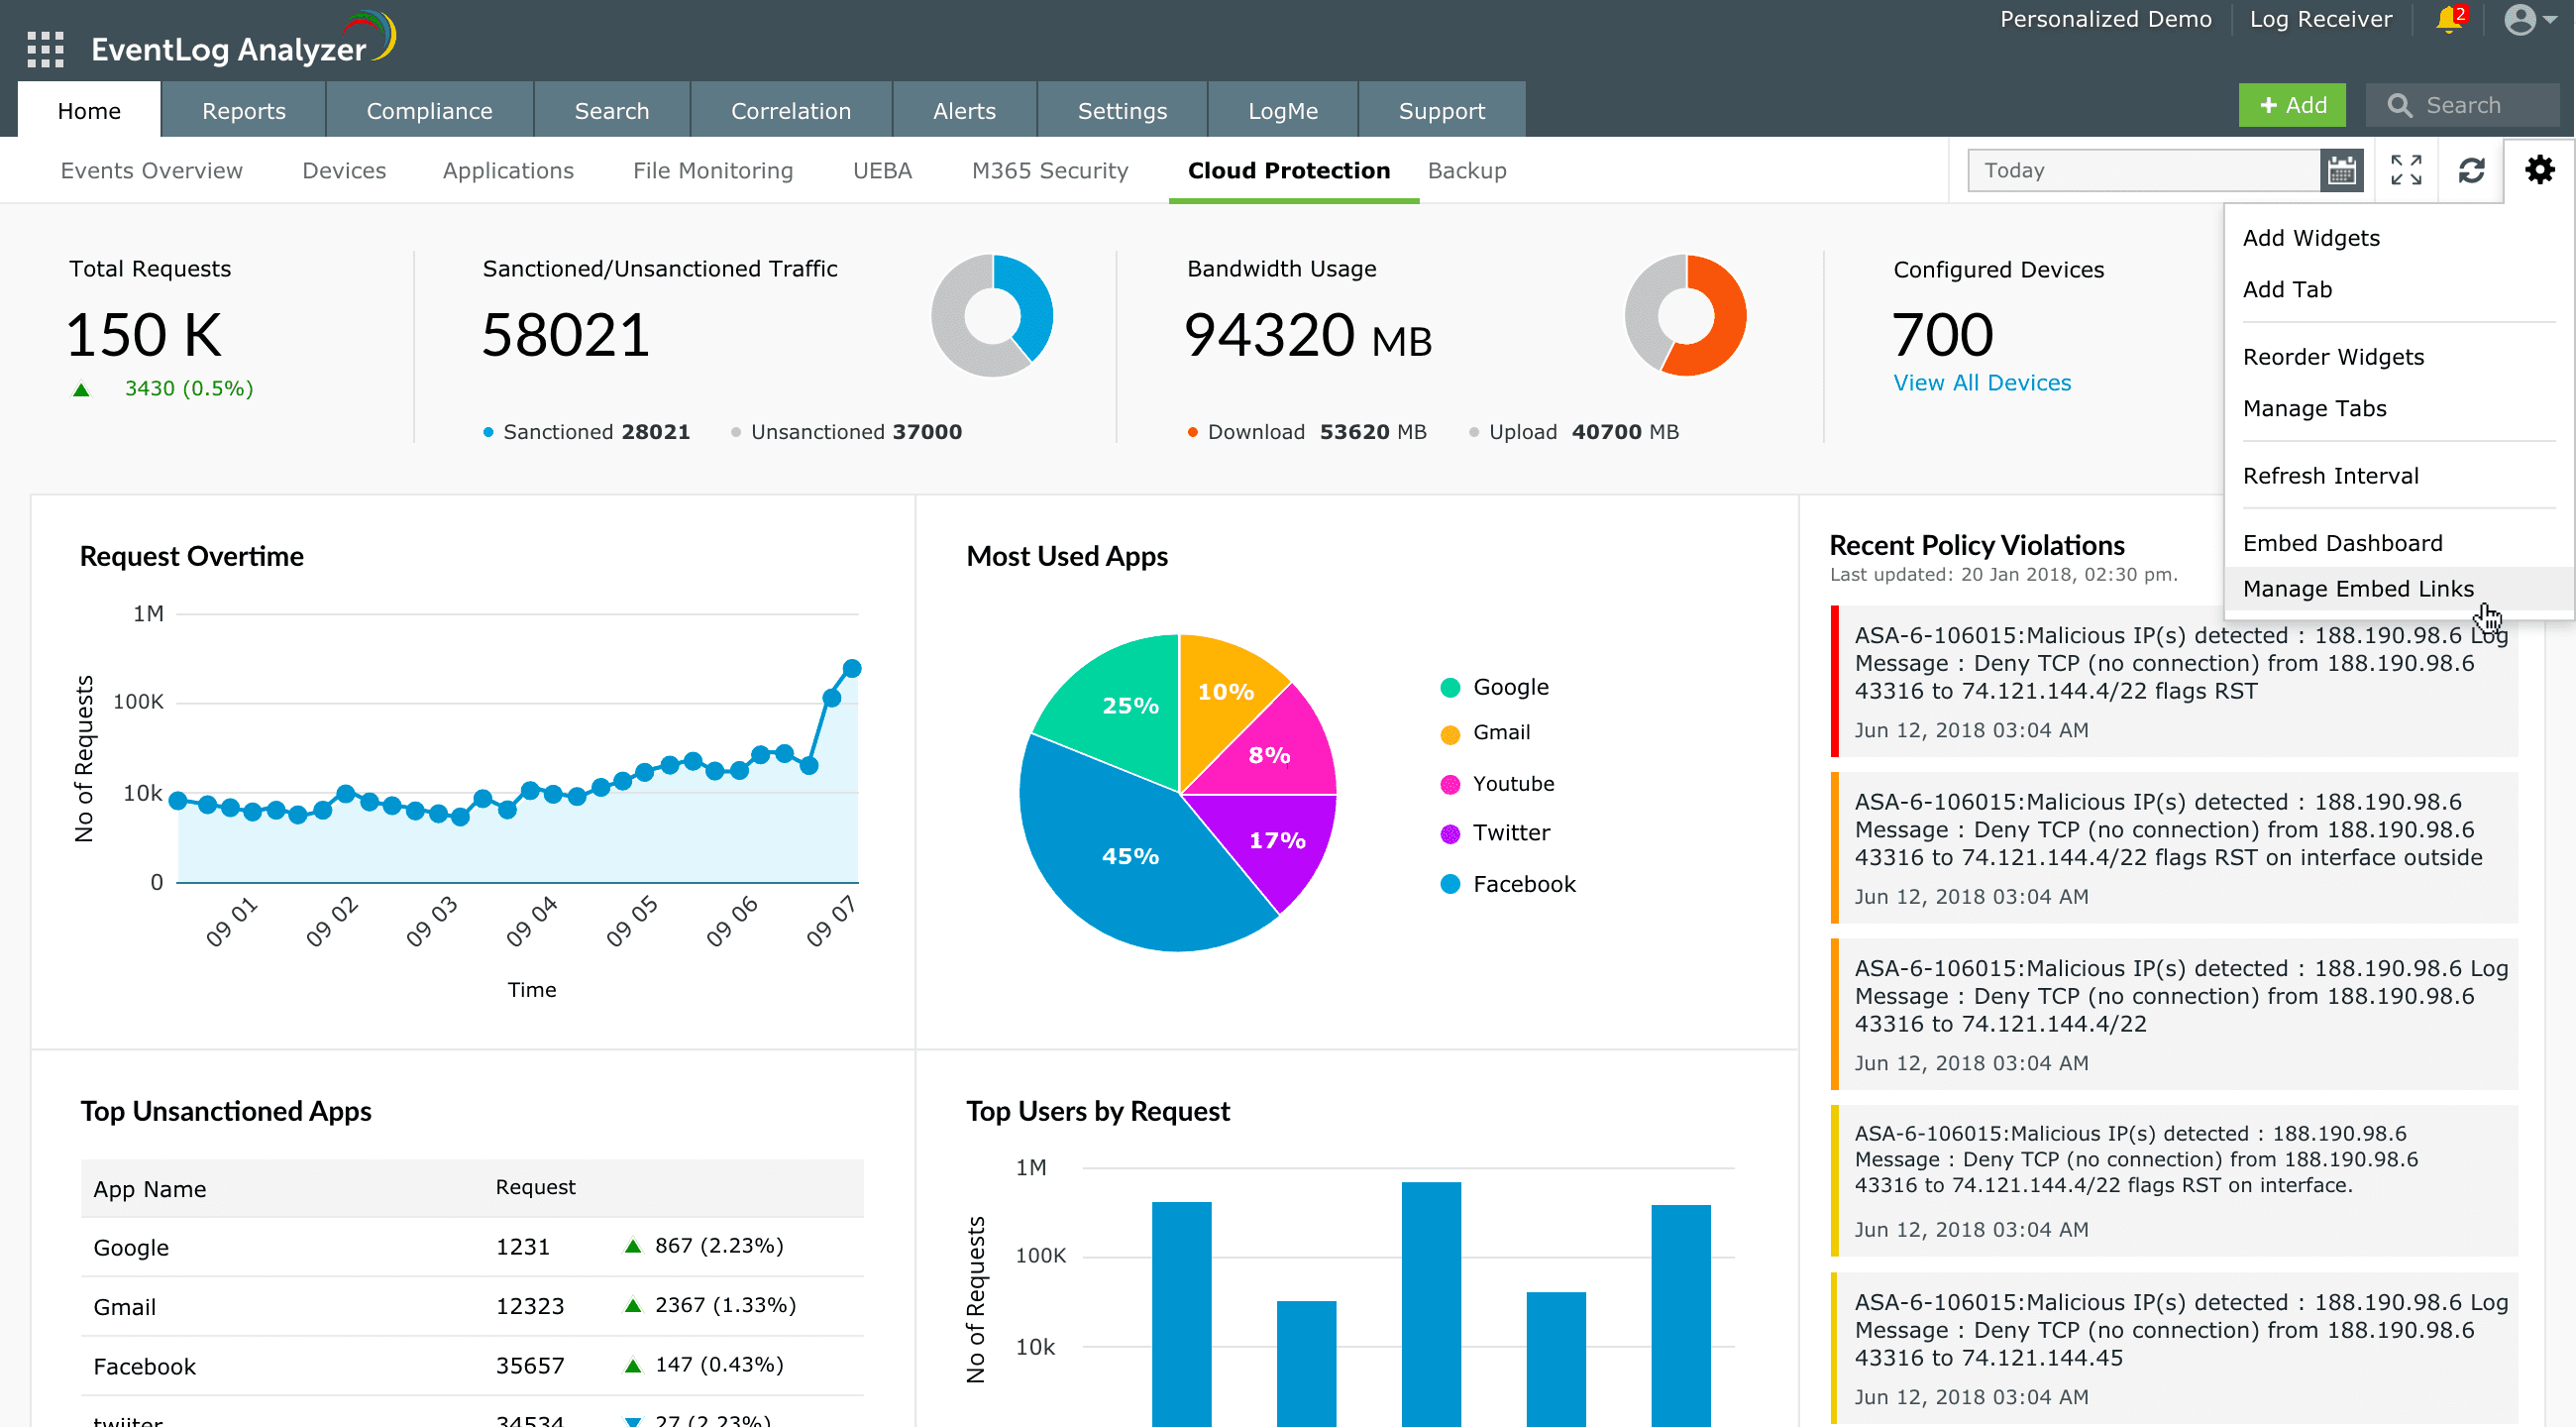
- Go to the desired dashboard tab in EventLog Analyzer, and click on the Settings icon.
- Select Embed Dashboard.

- Provide the Link Name and select the time range, refresh interval and the expiry period.

- Click Create Link.

- You can now copy and paste the provided HTML snippet into your webpage or use the provided URL for accessing this chart independently.
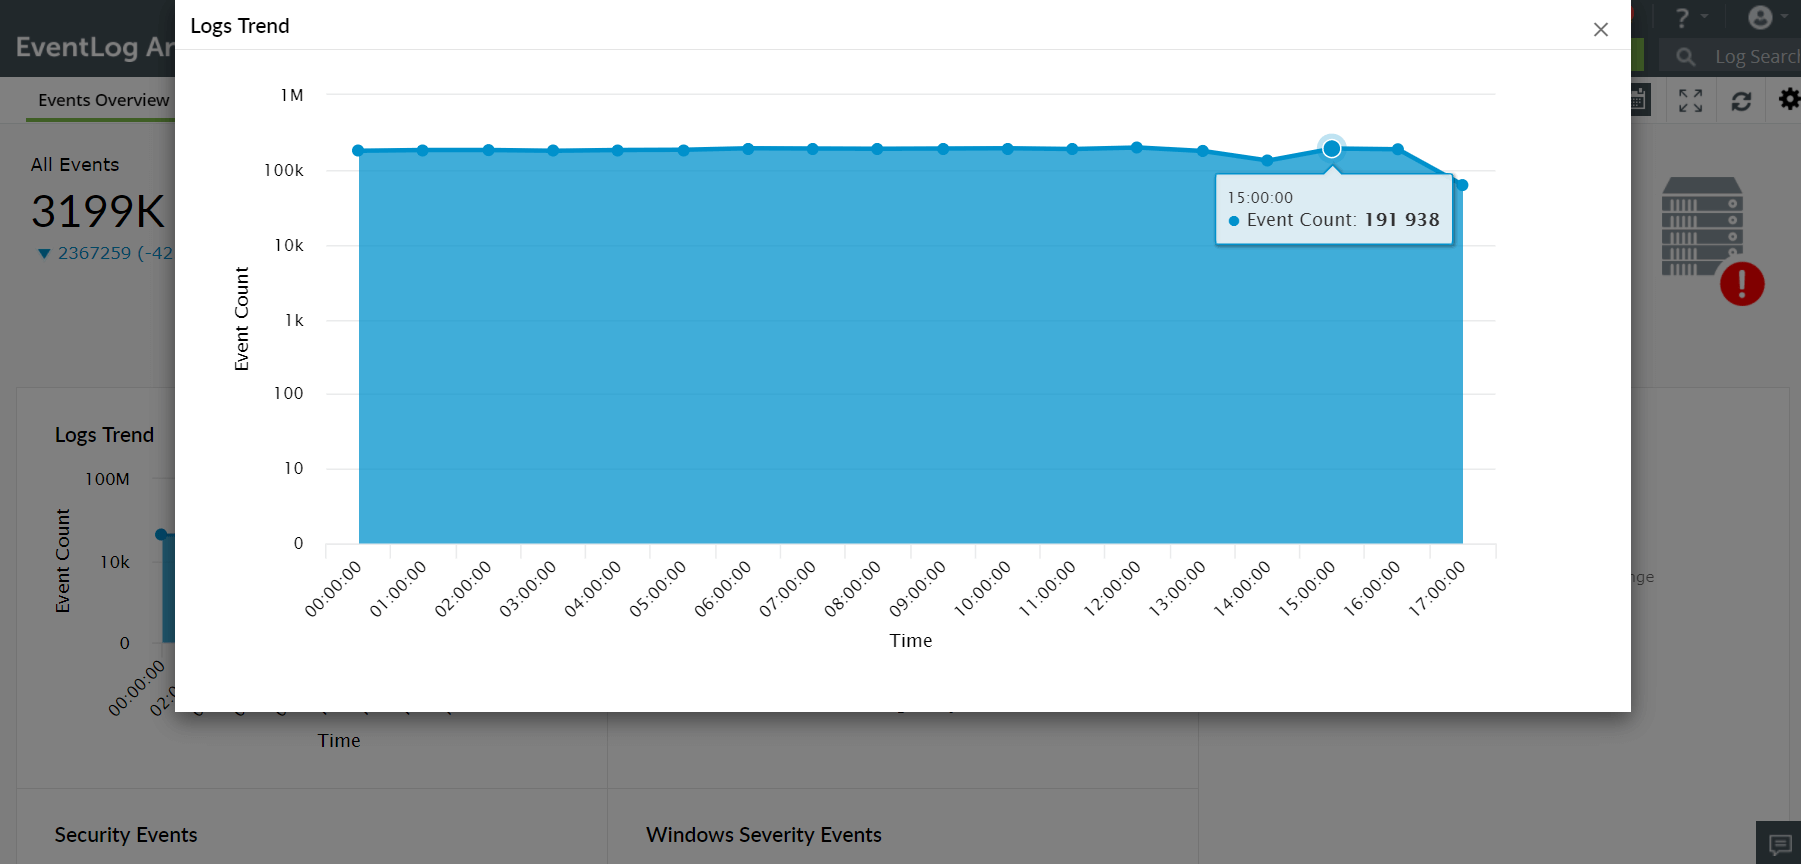
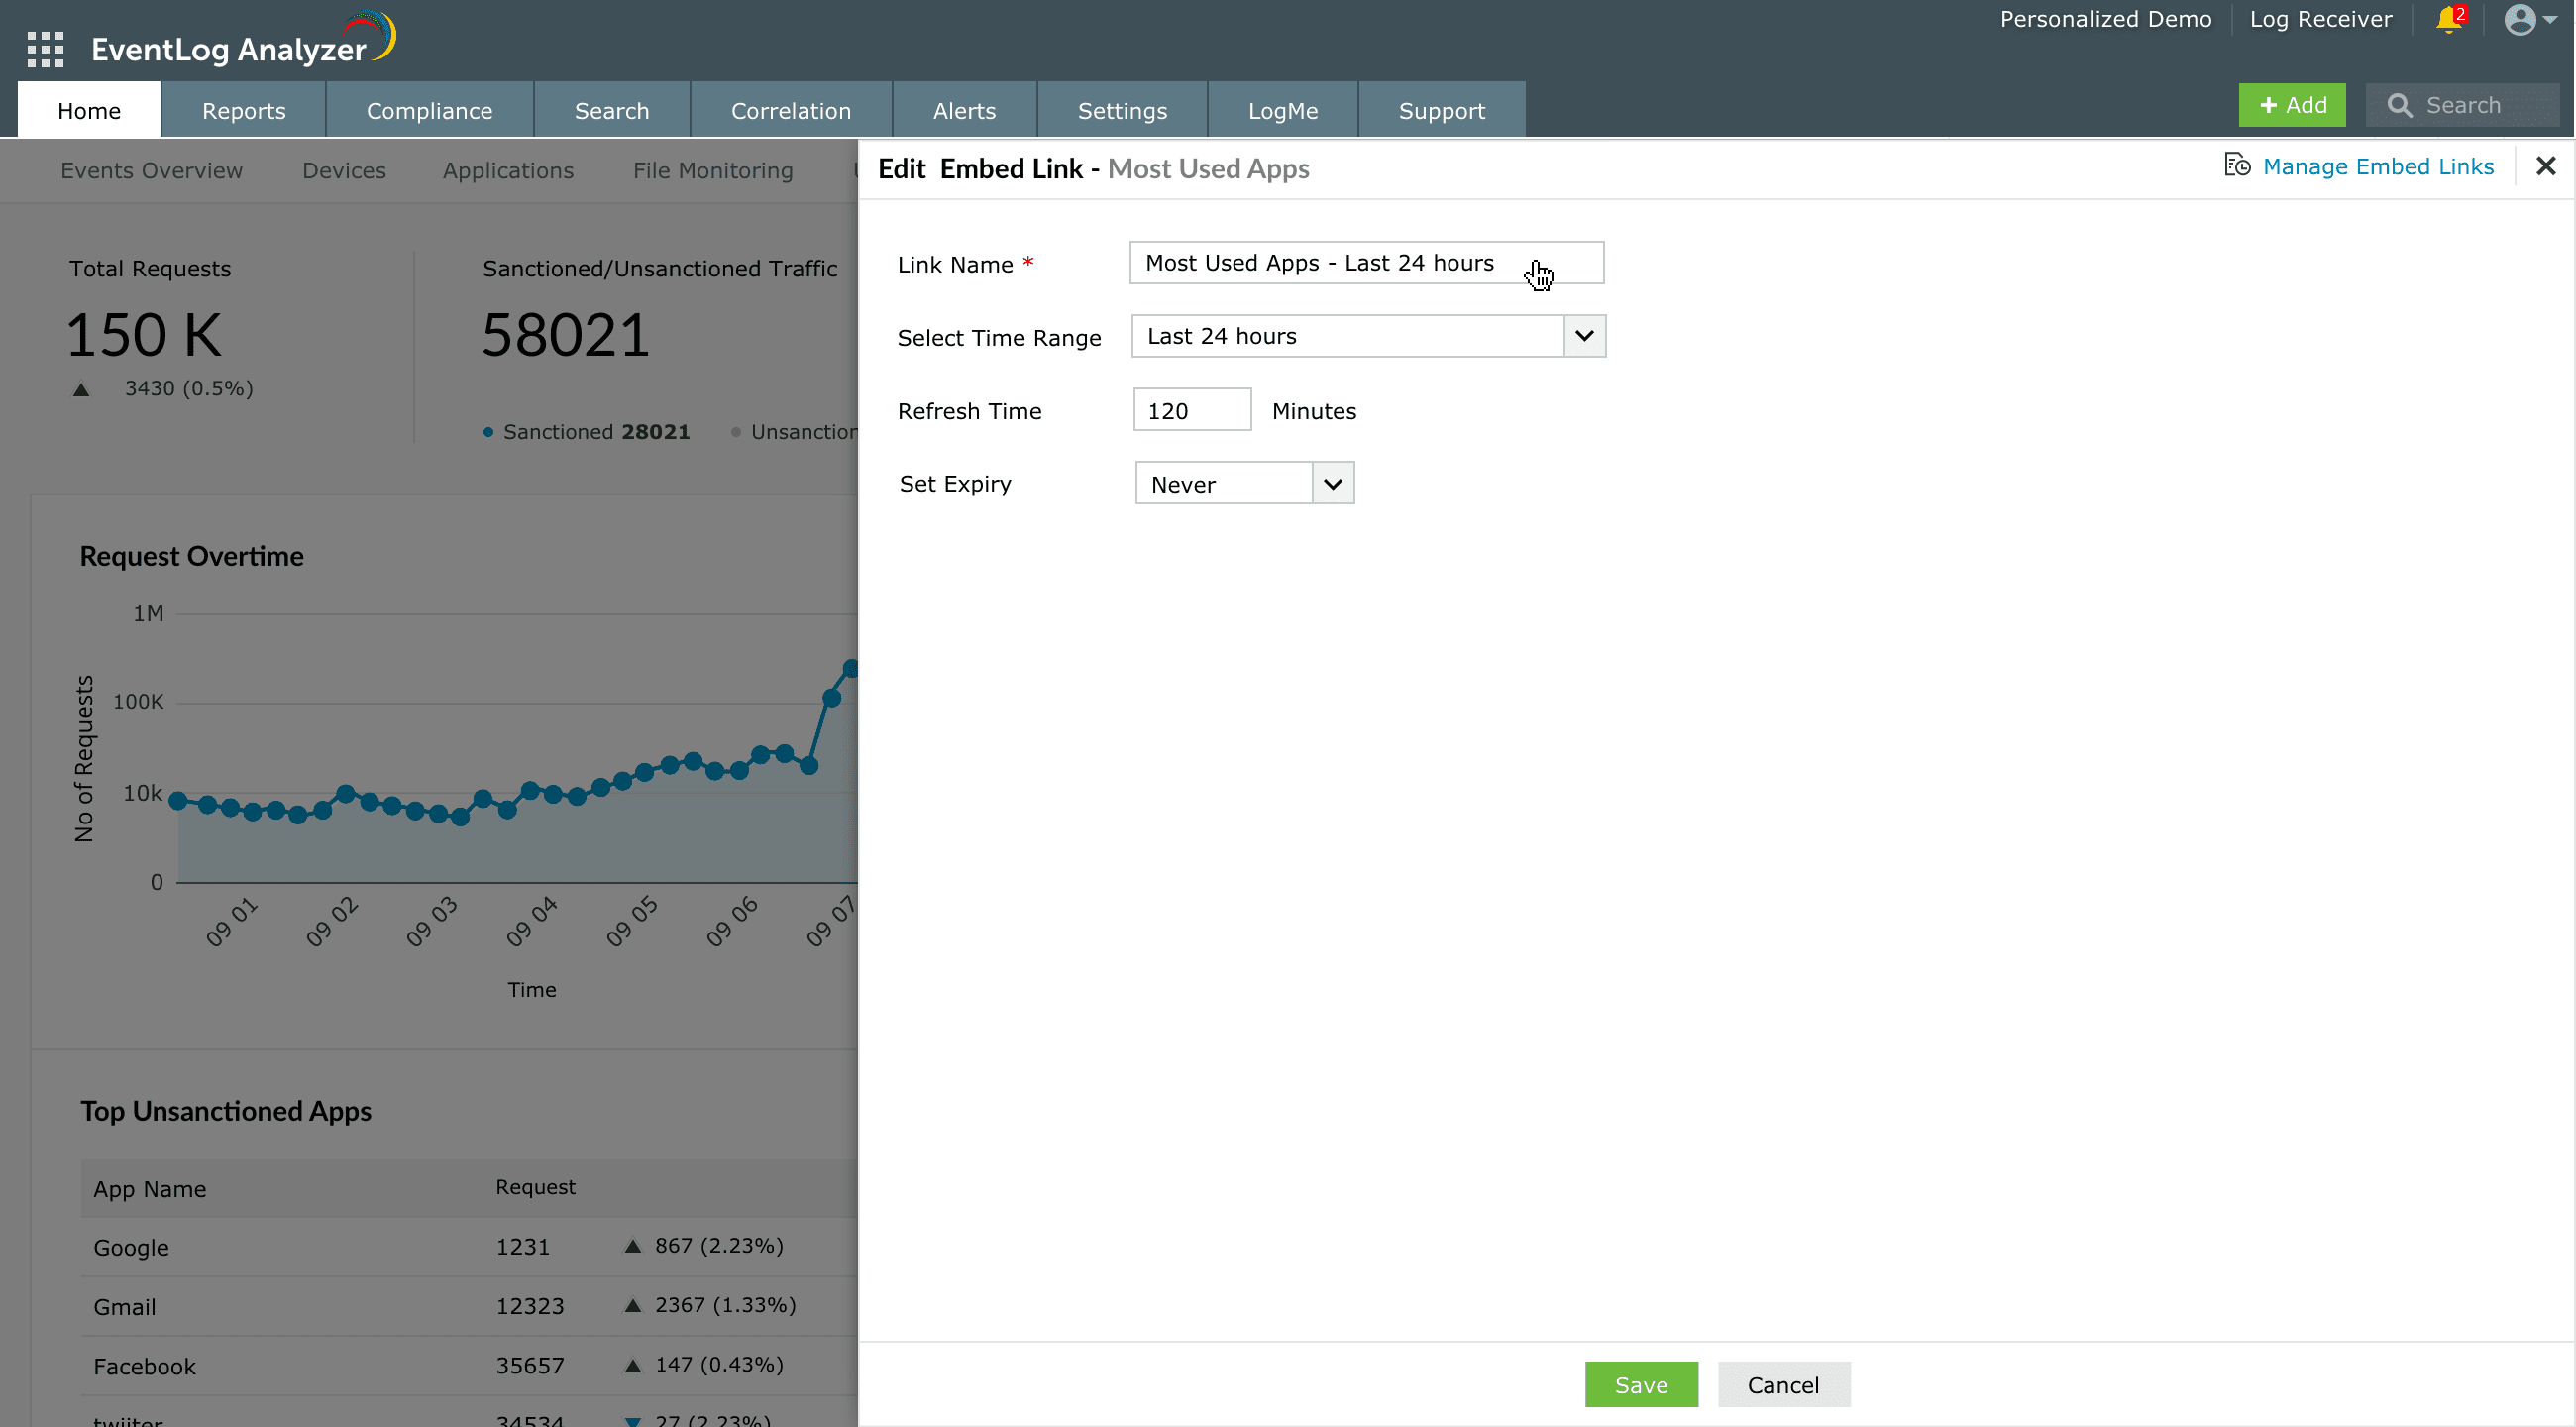
To embed a widget,
In EventLog Analyzer dashboard, click the icon corresponding to the widget that you want to embed.
- Click on the Embed Widget option.
- Provide a unique Link Name.
- Choose the desired Time Range from the drop-down menu.
- Provide the Refresh Time (to be set between 60-1440 minutes) and Set Expiry (to be within 1-365 days) from the options provided in the drop-down menu.
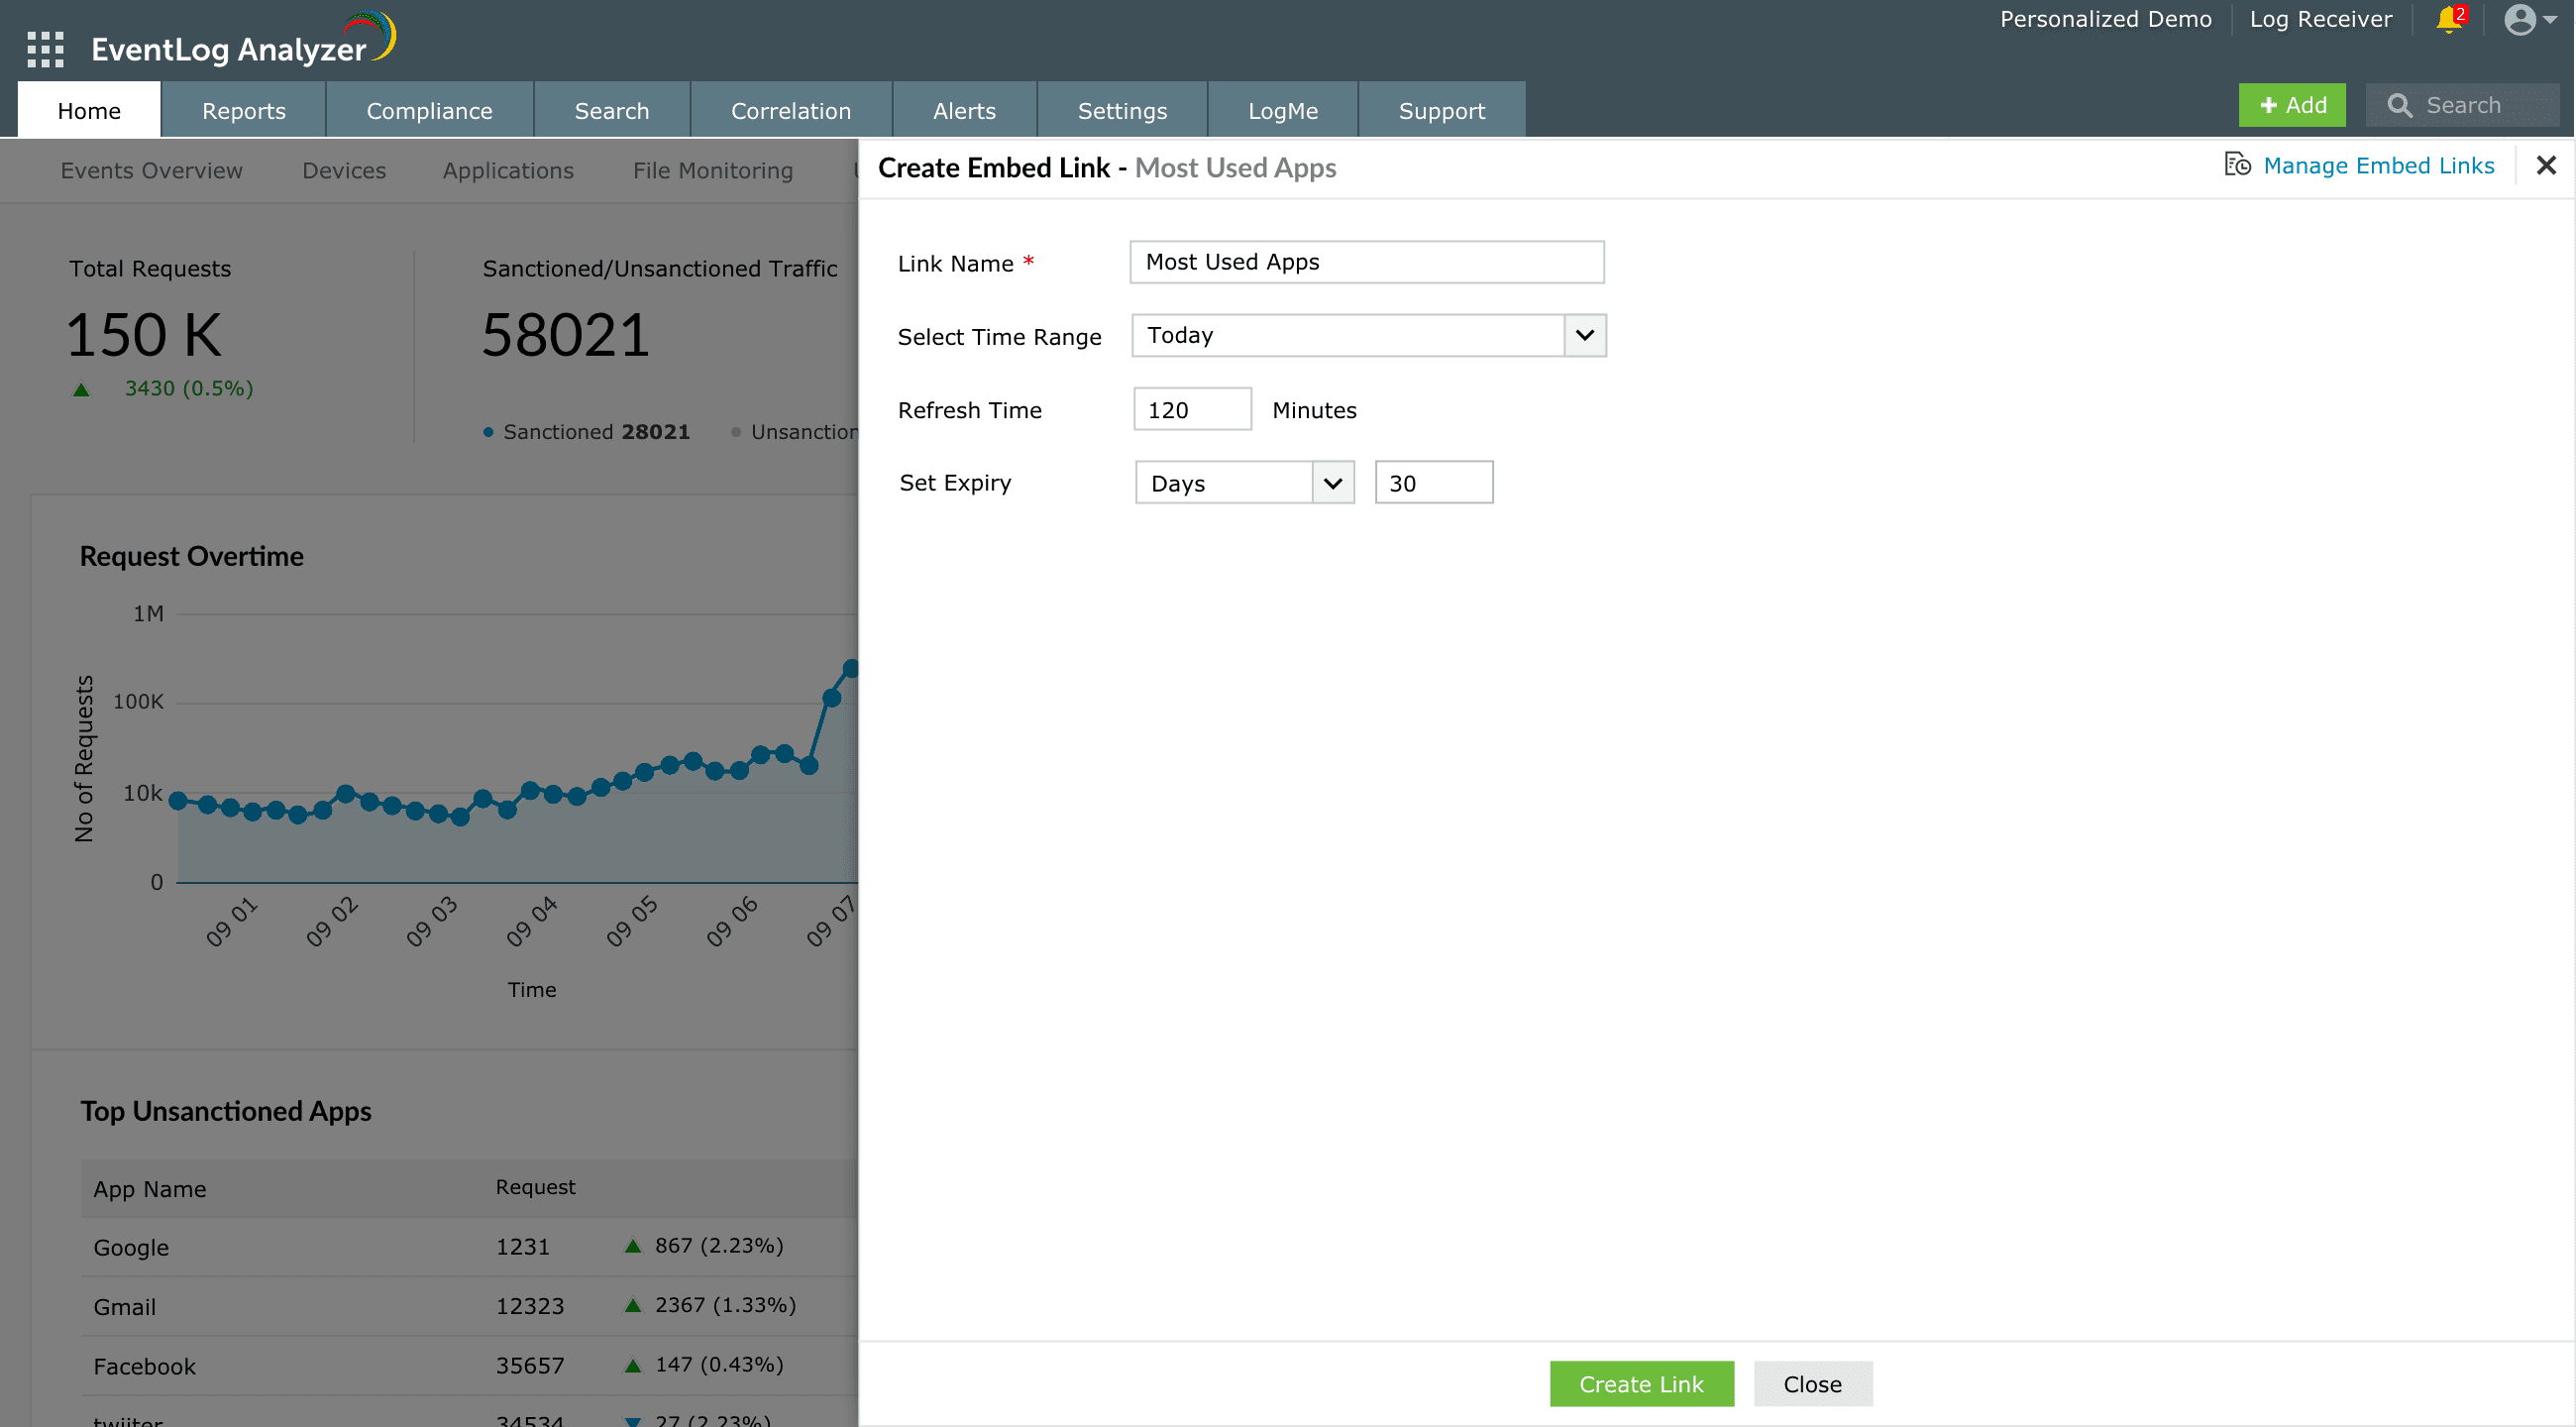
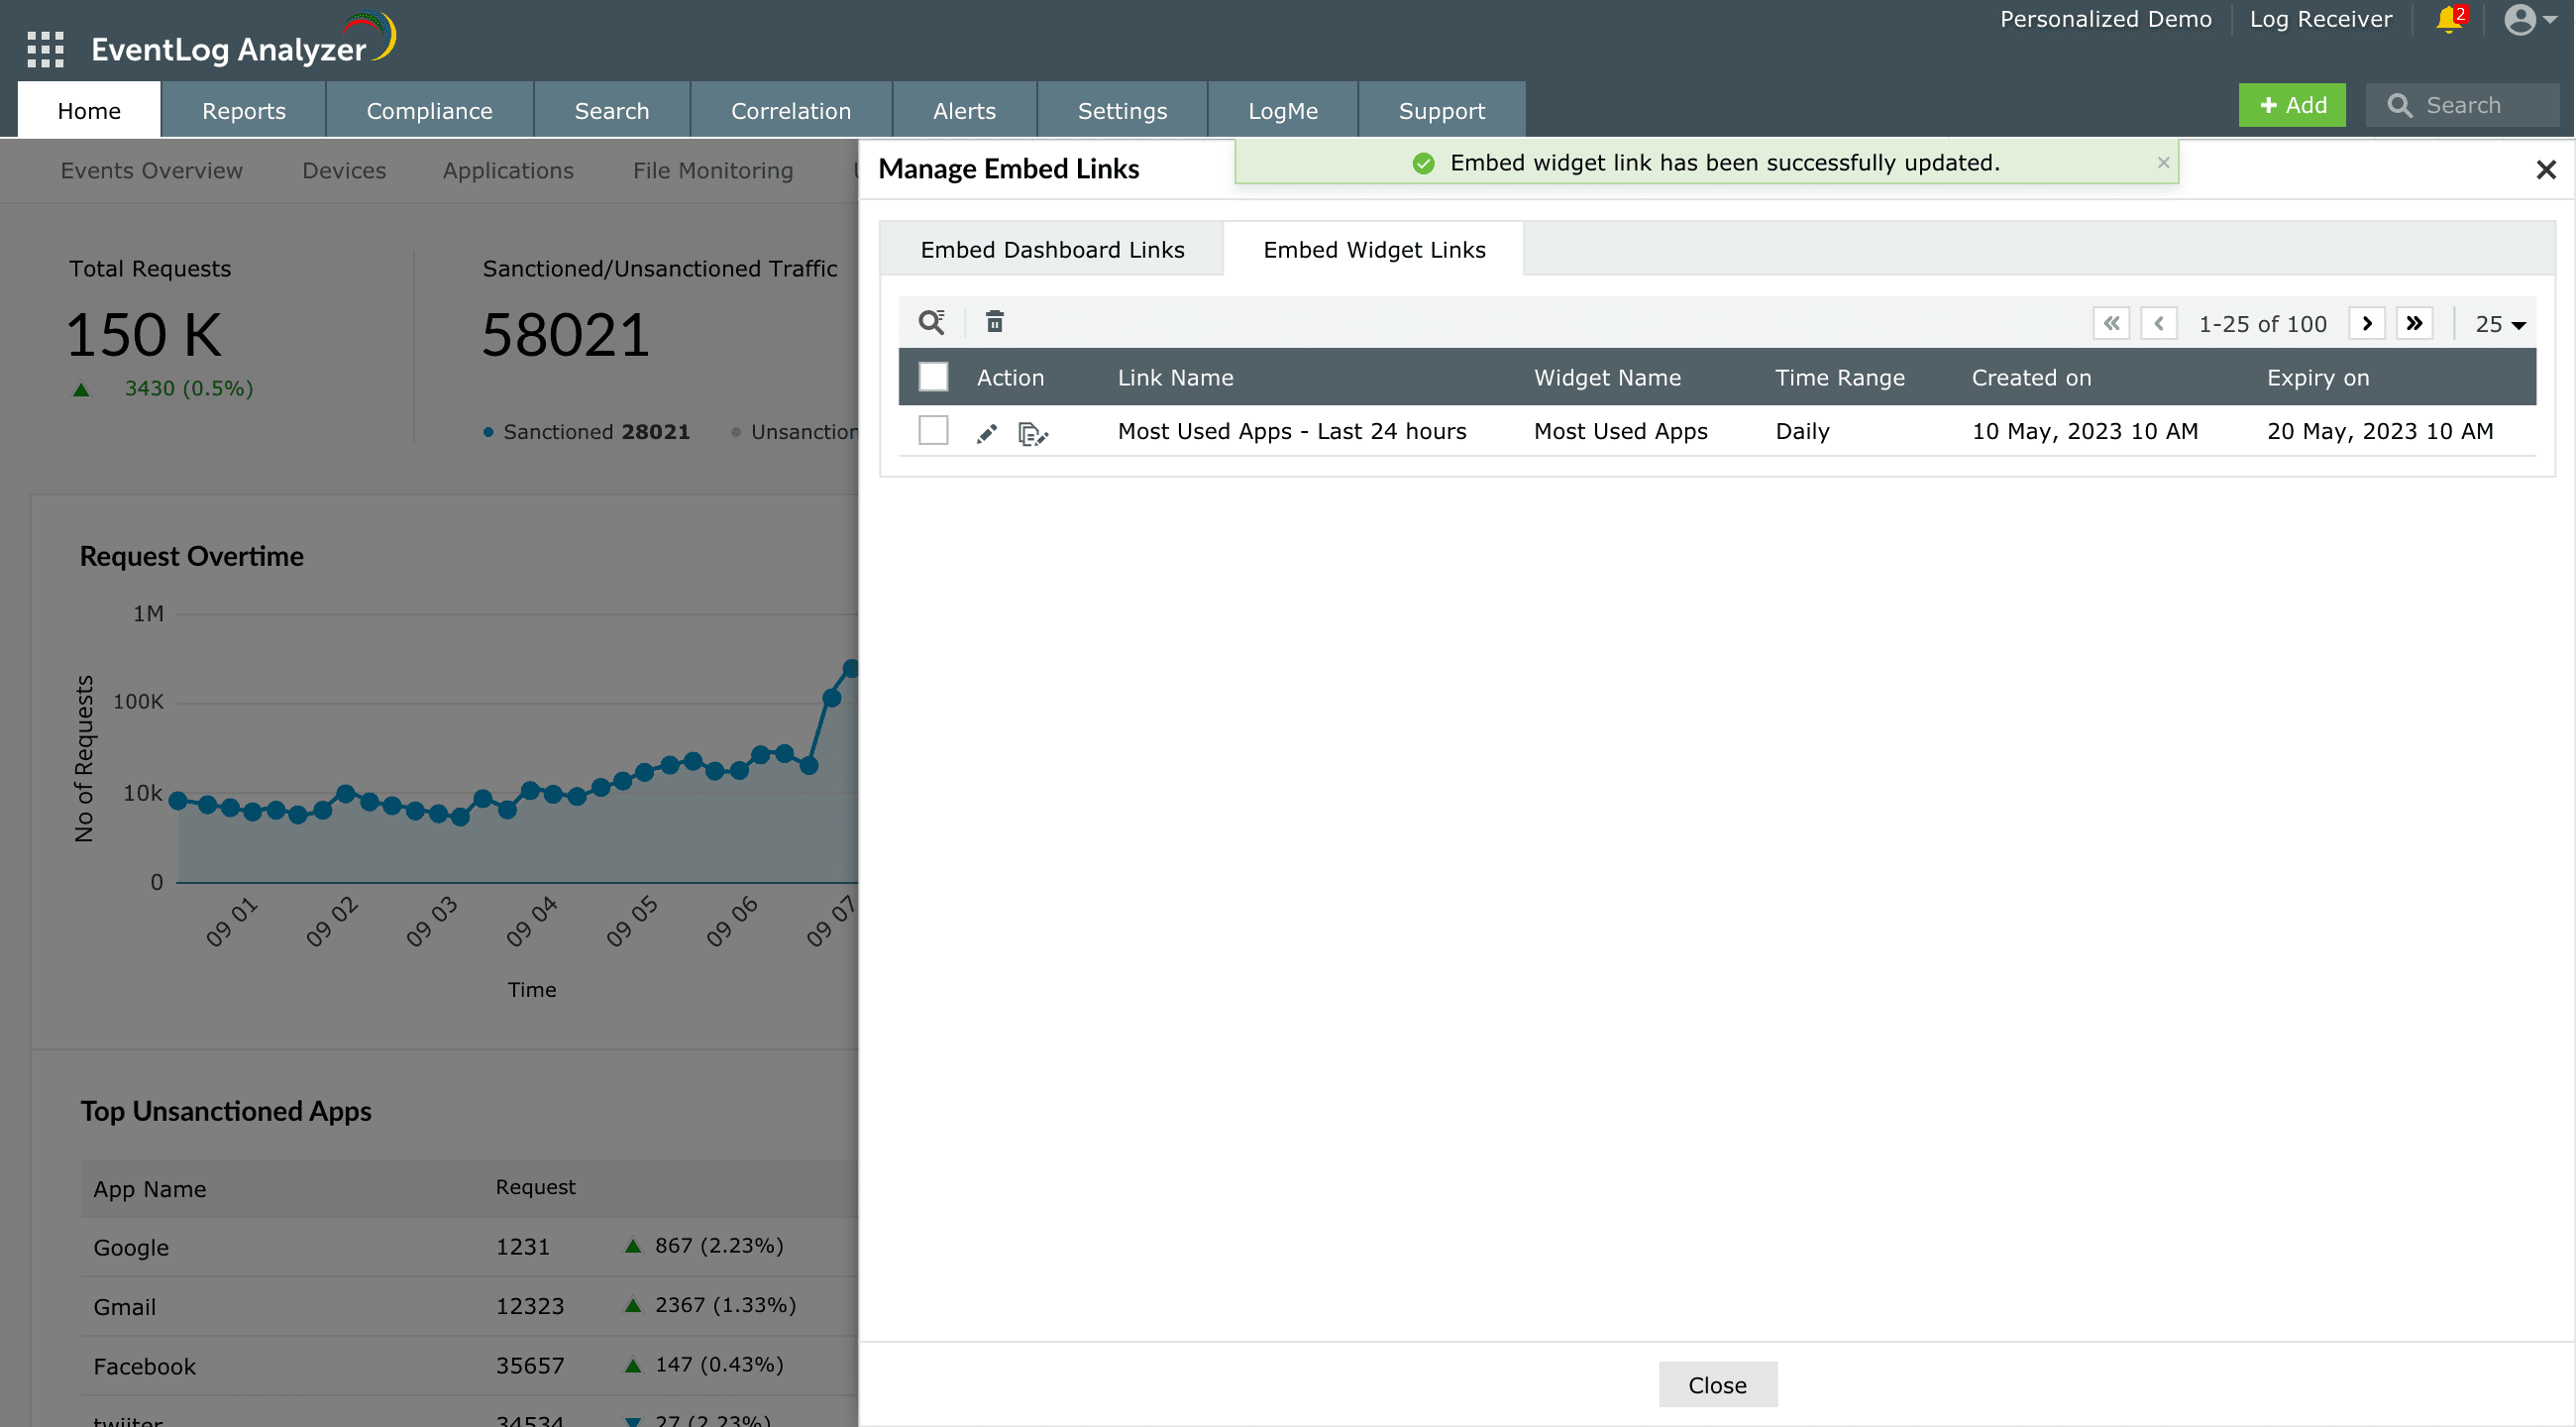
The embed widget link is now successfully created.
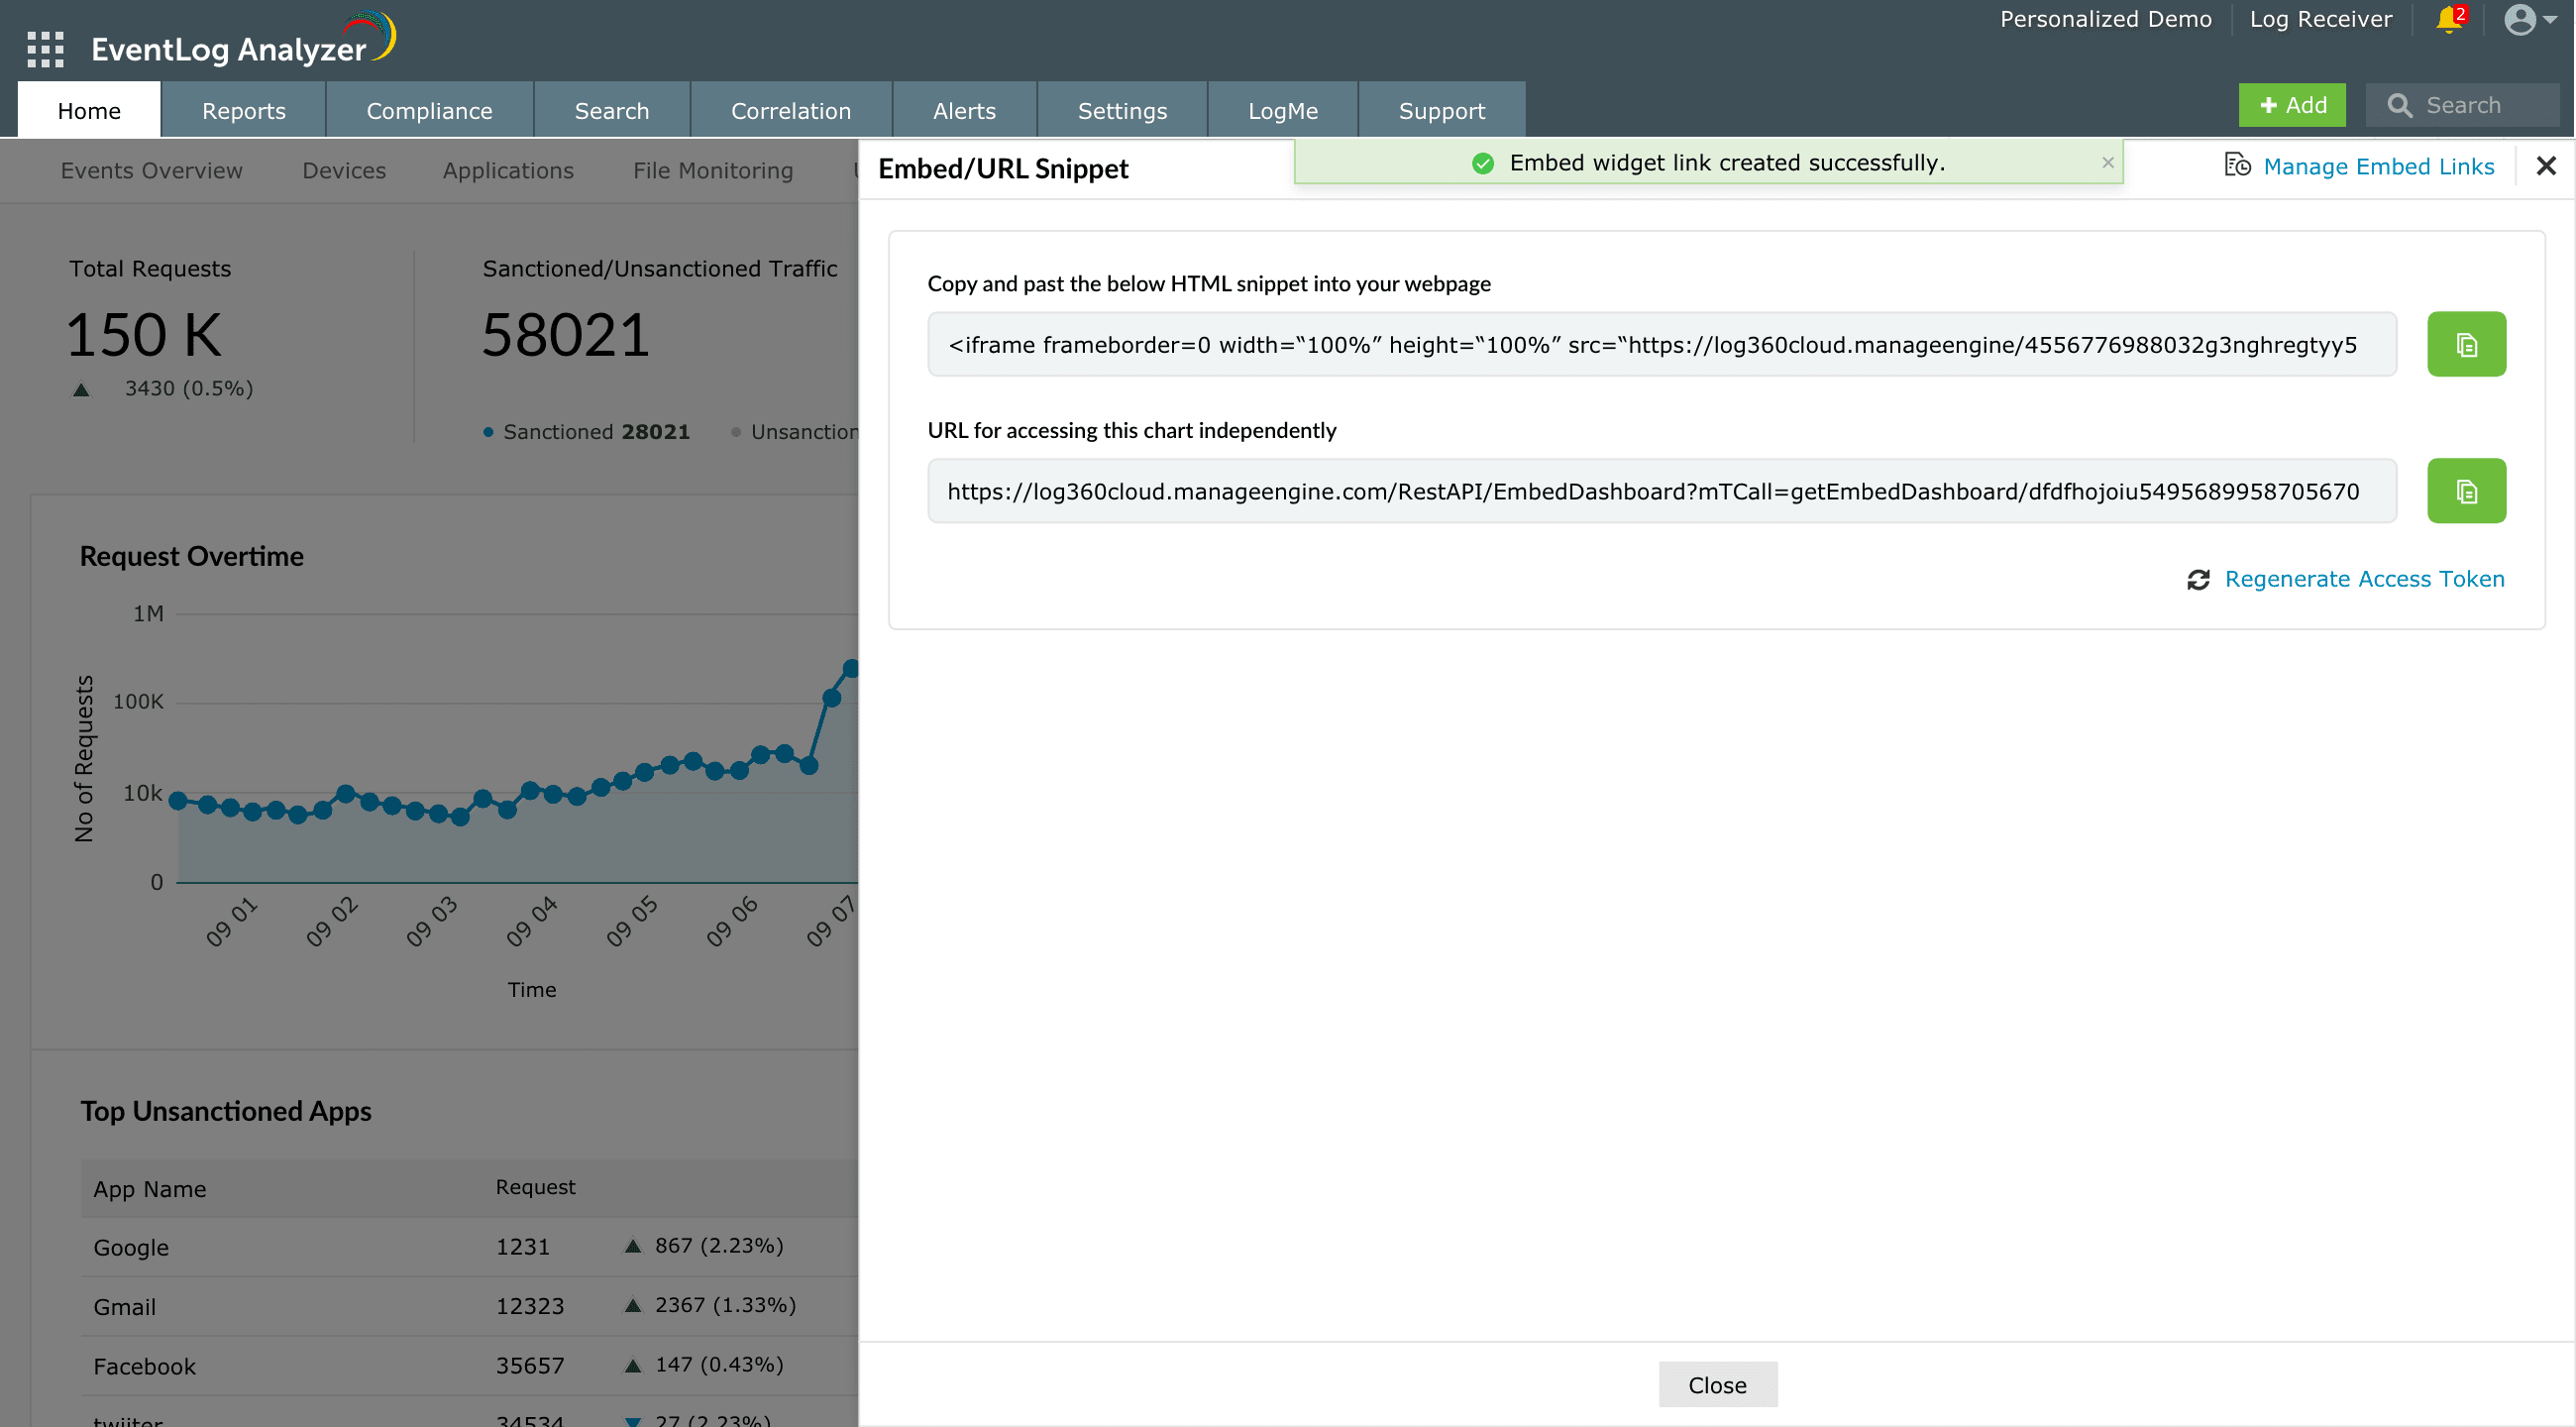
NOTE:
- The embed widget will be automatically refreshed at the specified interval.
- The generated external share link is only valid till the expiry date.
To manage embed links,
In the EventLog Analyzer dashboard, click the icon on the top-right corner and select Manage Embed Links.
- This will display a table containing all the Active Dashboard Links.
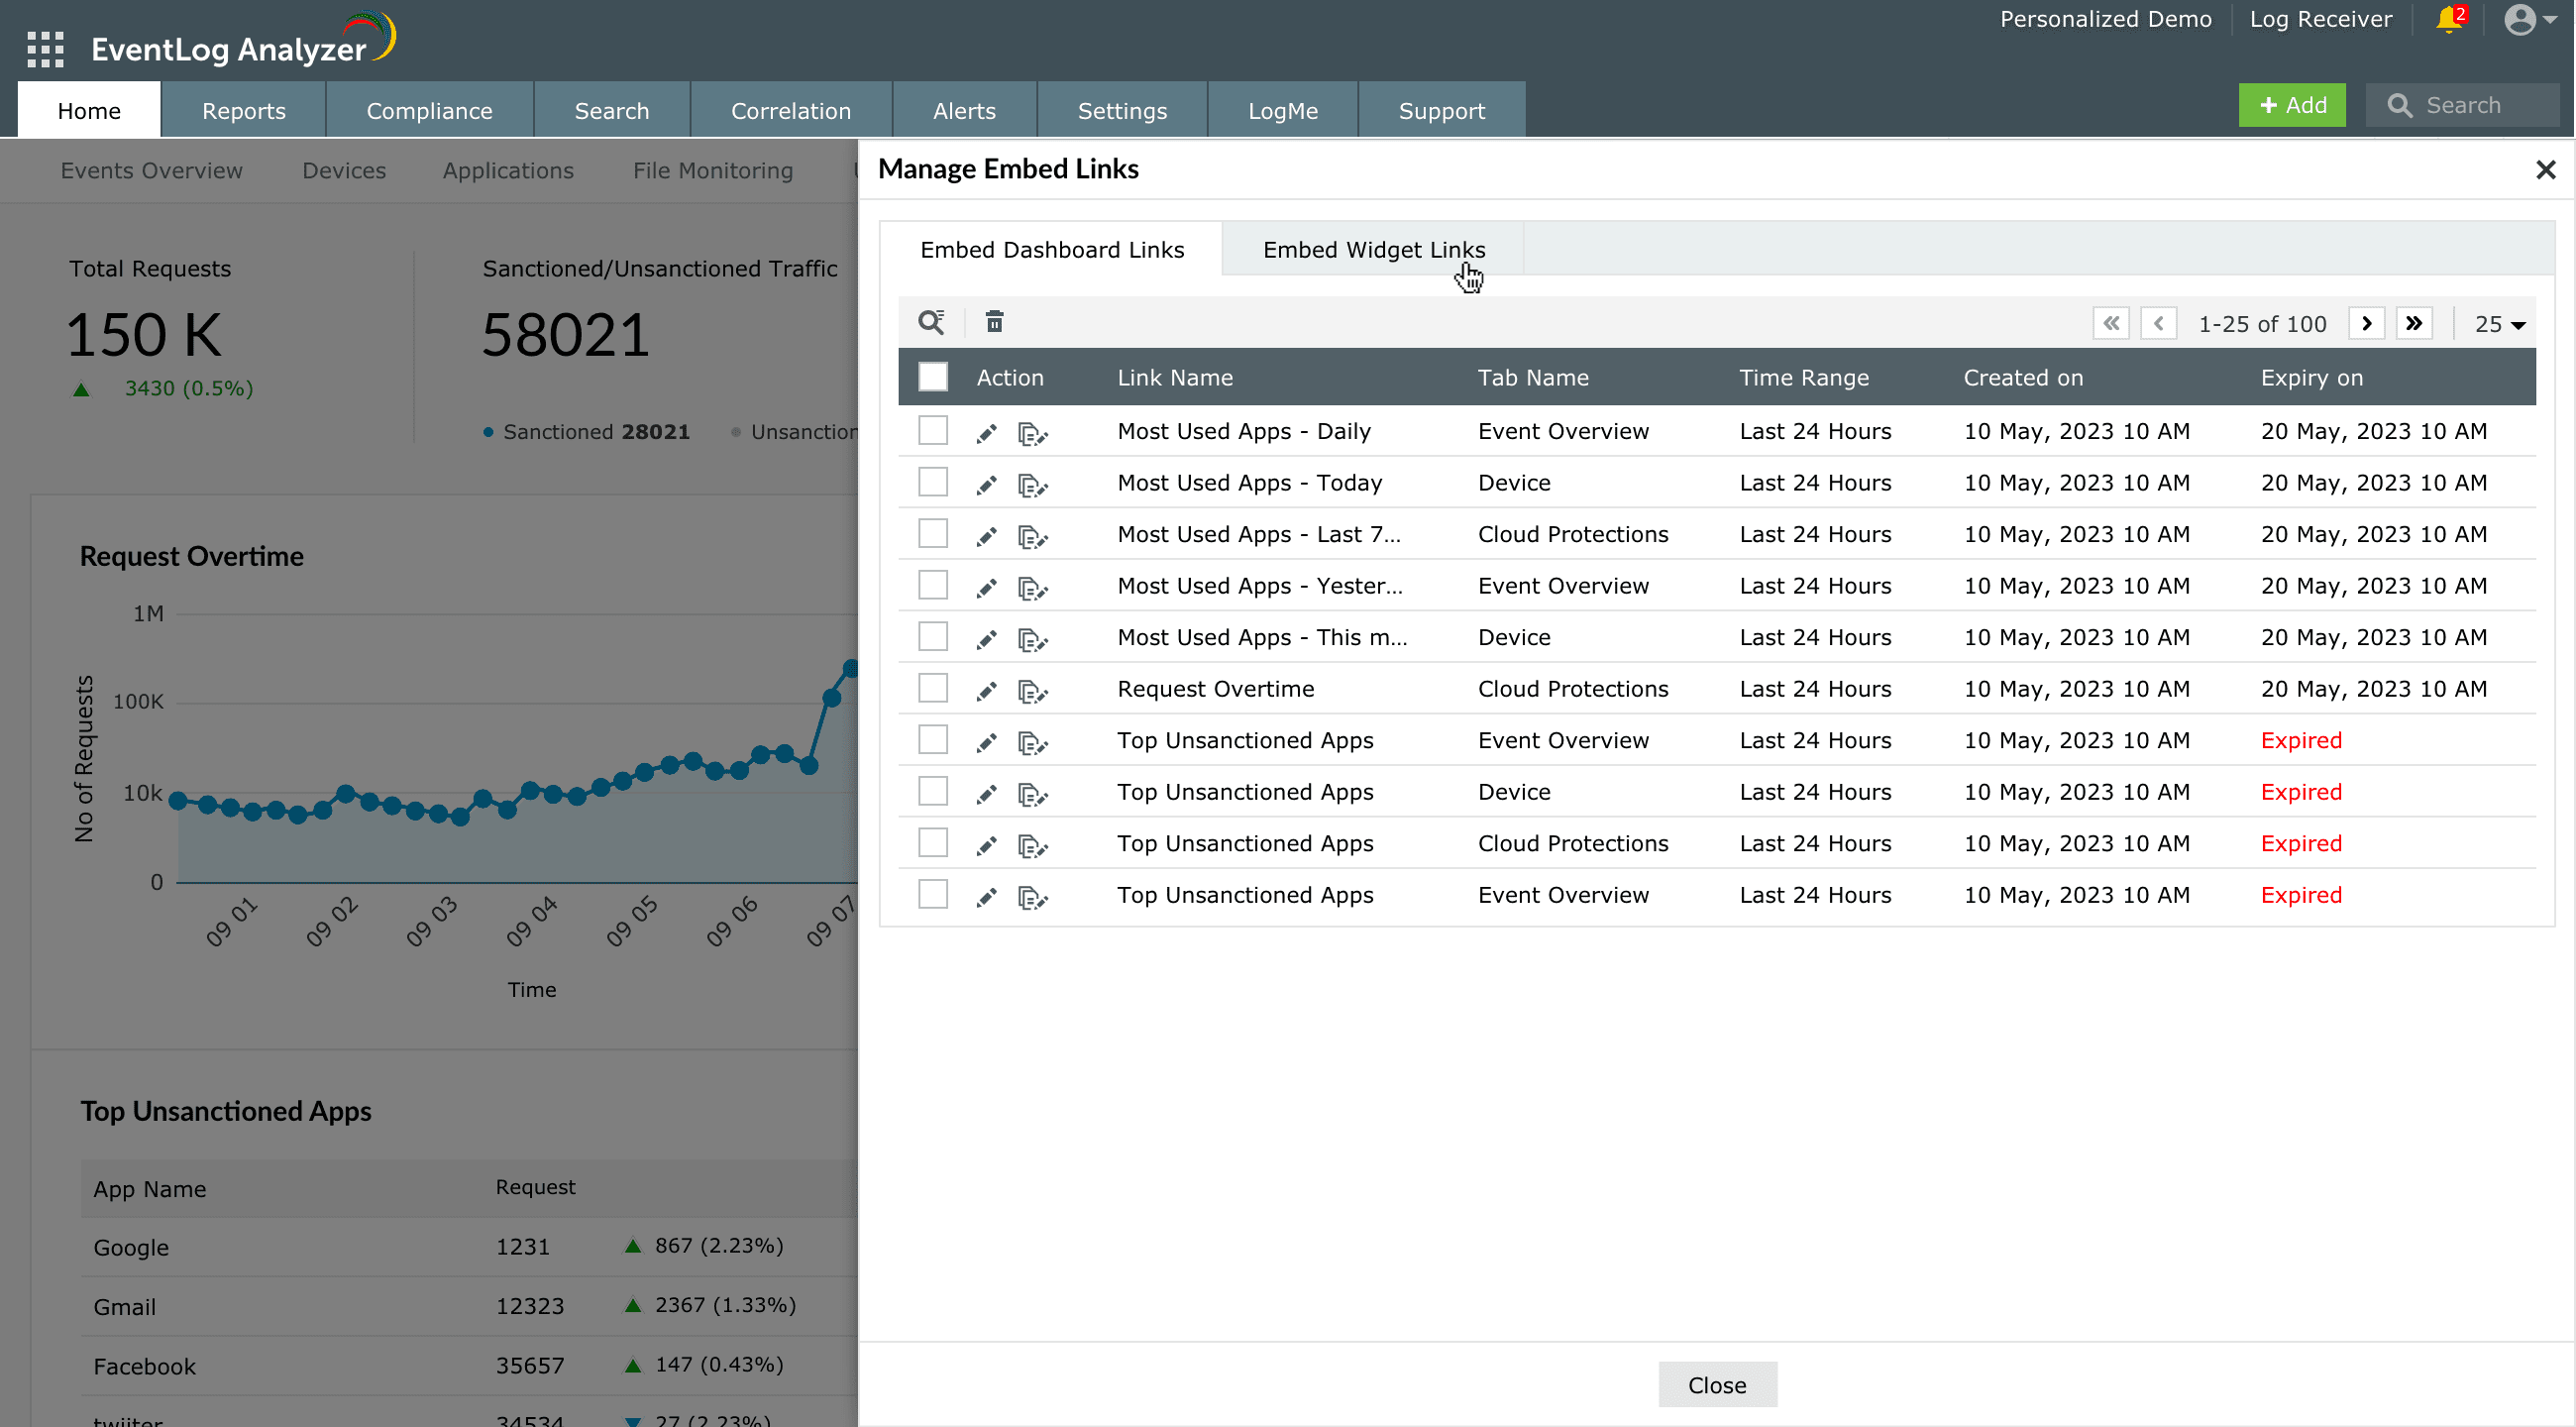
- To edit a specific link, locate the desired entry and click the Edit option associated with it.
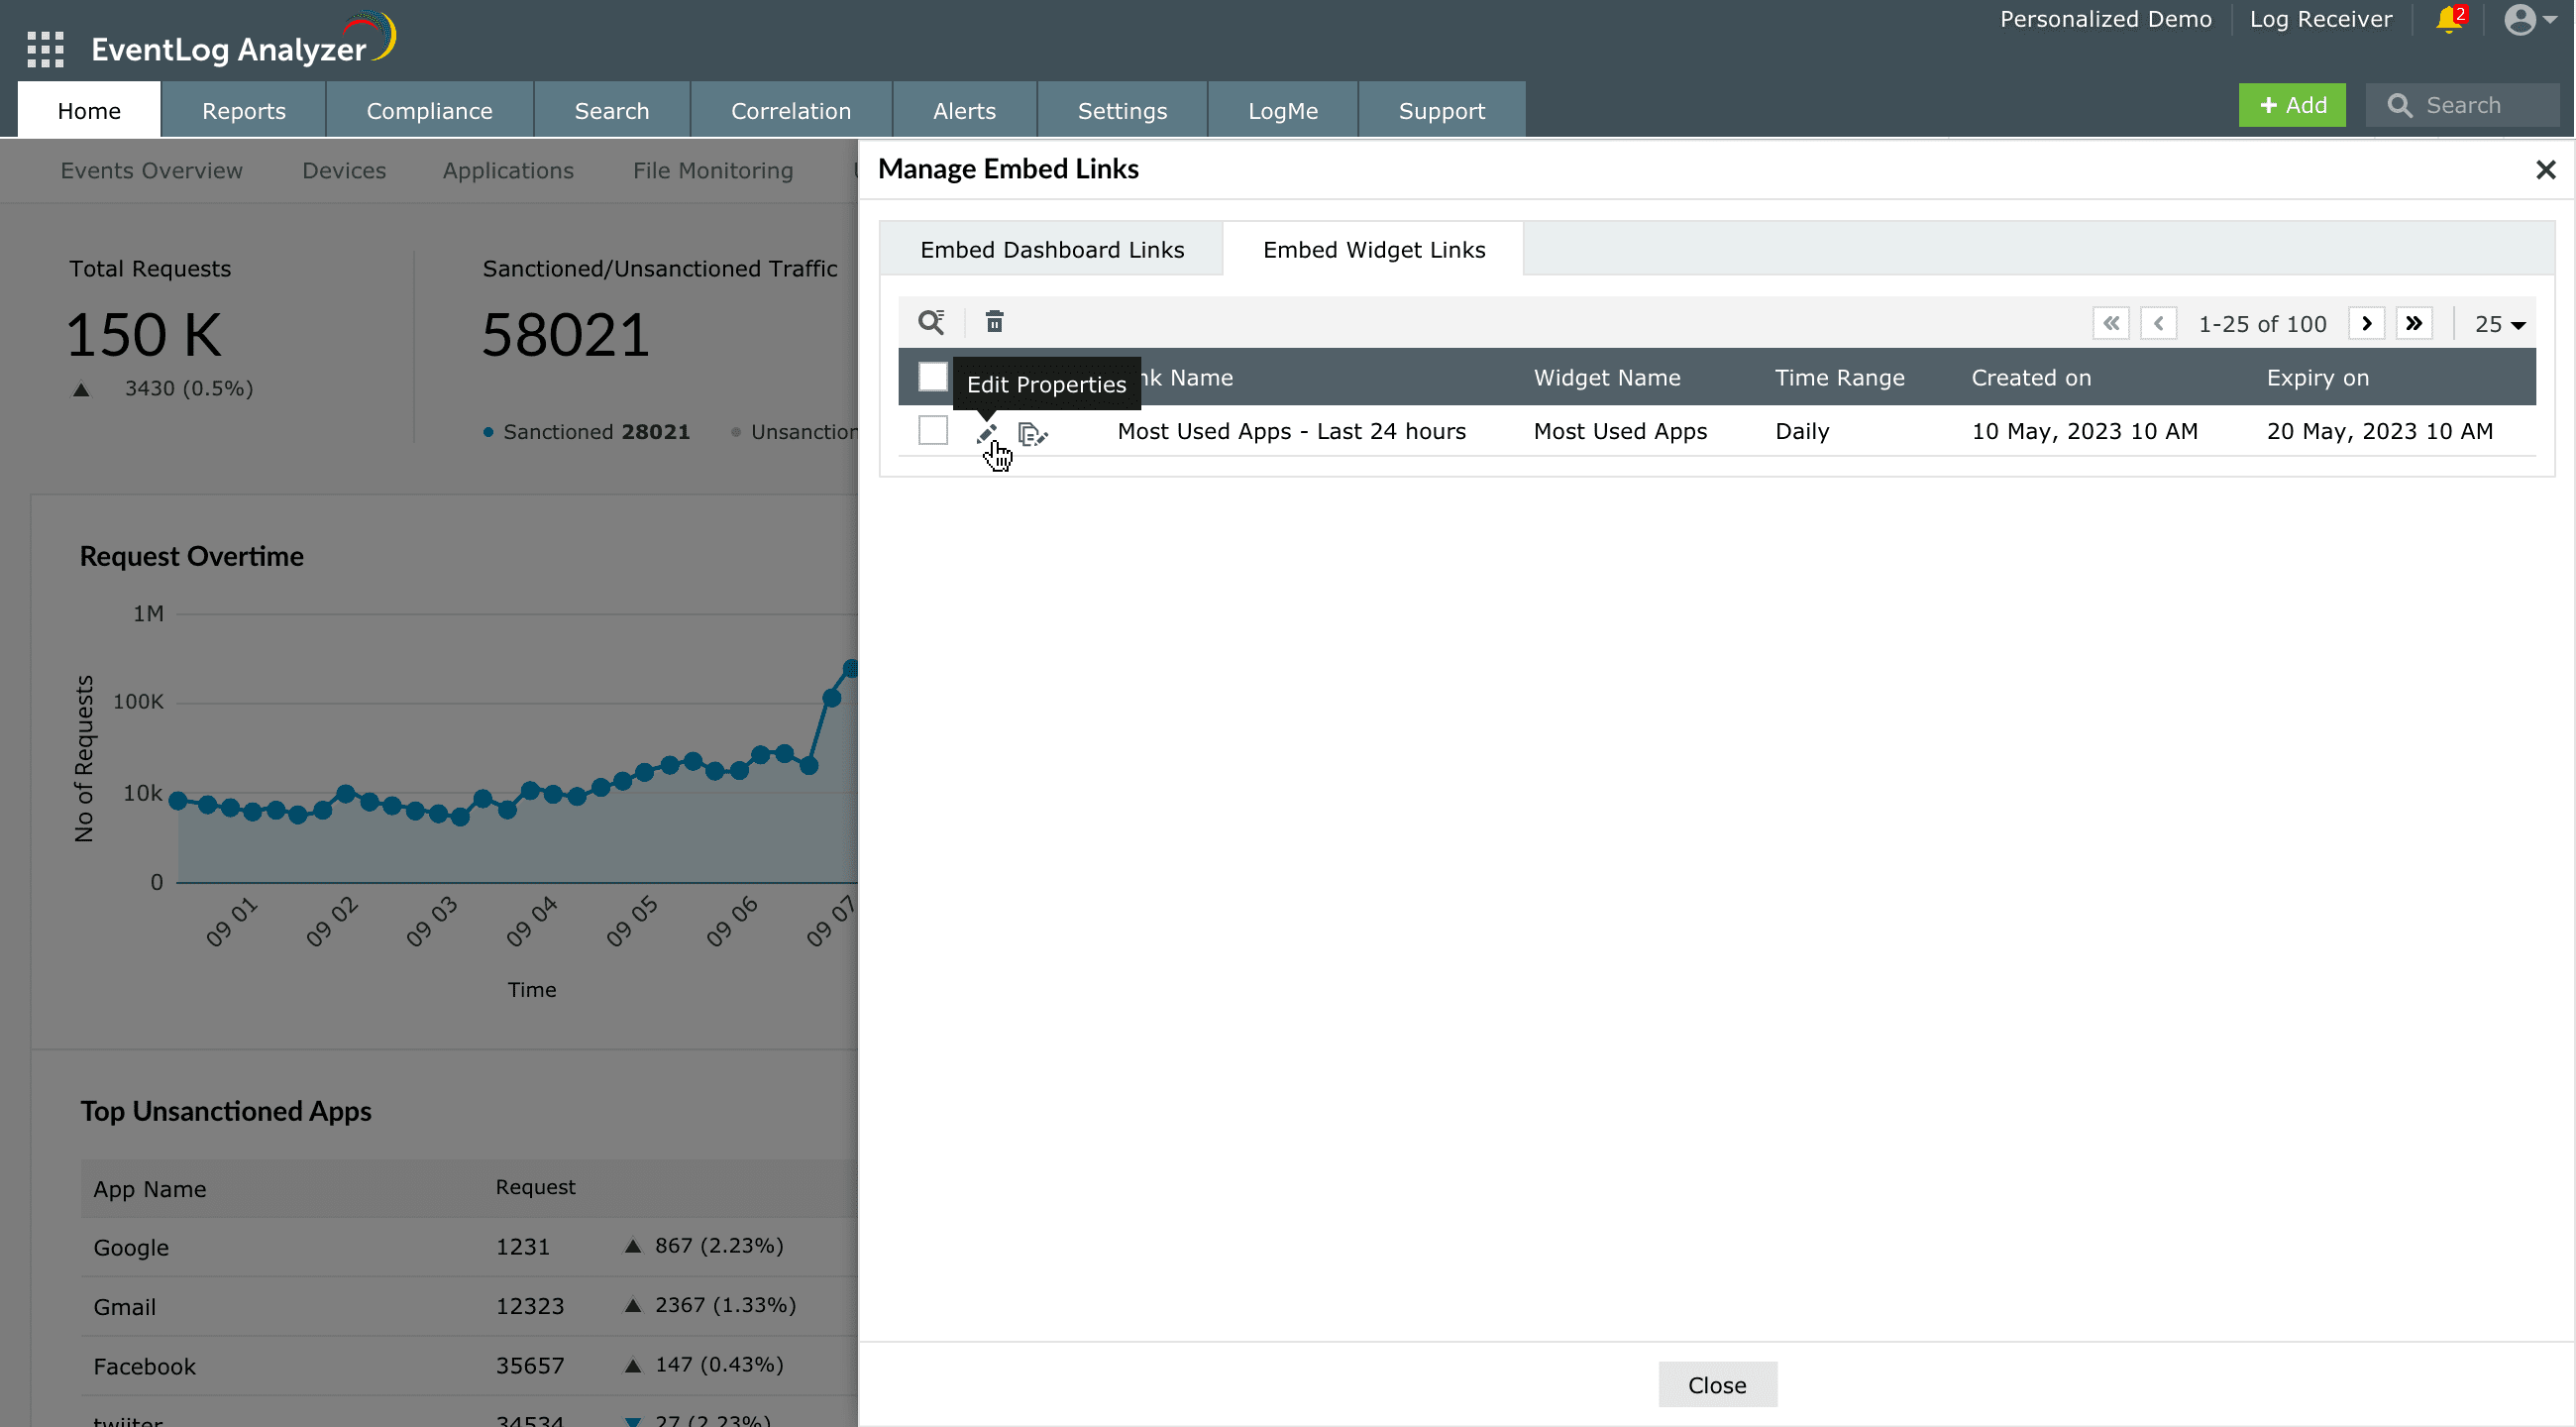
- A window will appear allowing you to modify the properties of the chosen link. Make the necessary changes.
- Once finished, click Save to confirm the updated properties for the Active Dashboard Link.
 Click here to expand