Distribution lists reports
Distribution lists simplify the process of sending emails to a great extent. Using these reports, you can find the details of all the distribution lists, discover inactive distribution lists, identify the members of each distribution list, and analyze the distribution list traffic. Navigate to the Reports tab → Exchange Server → Distribution Lists to get this information.
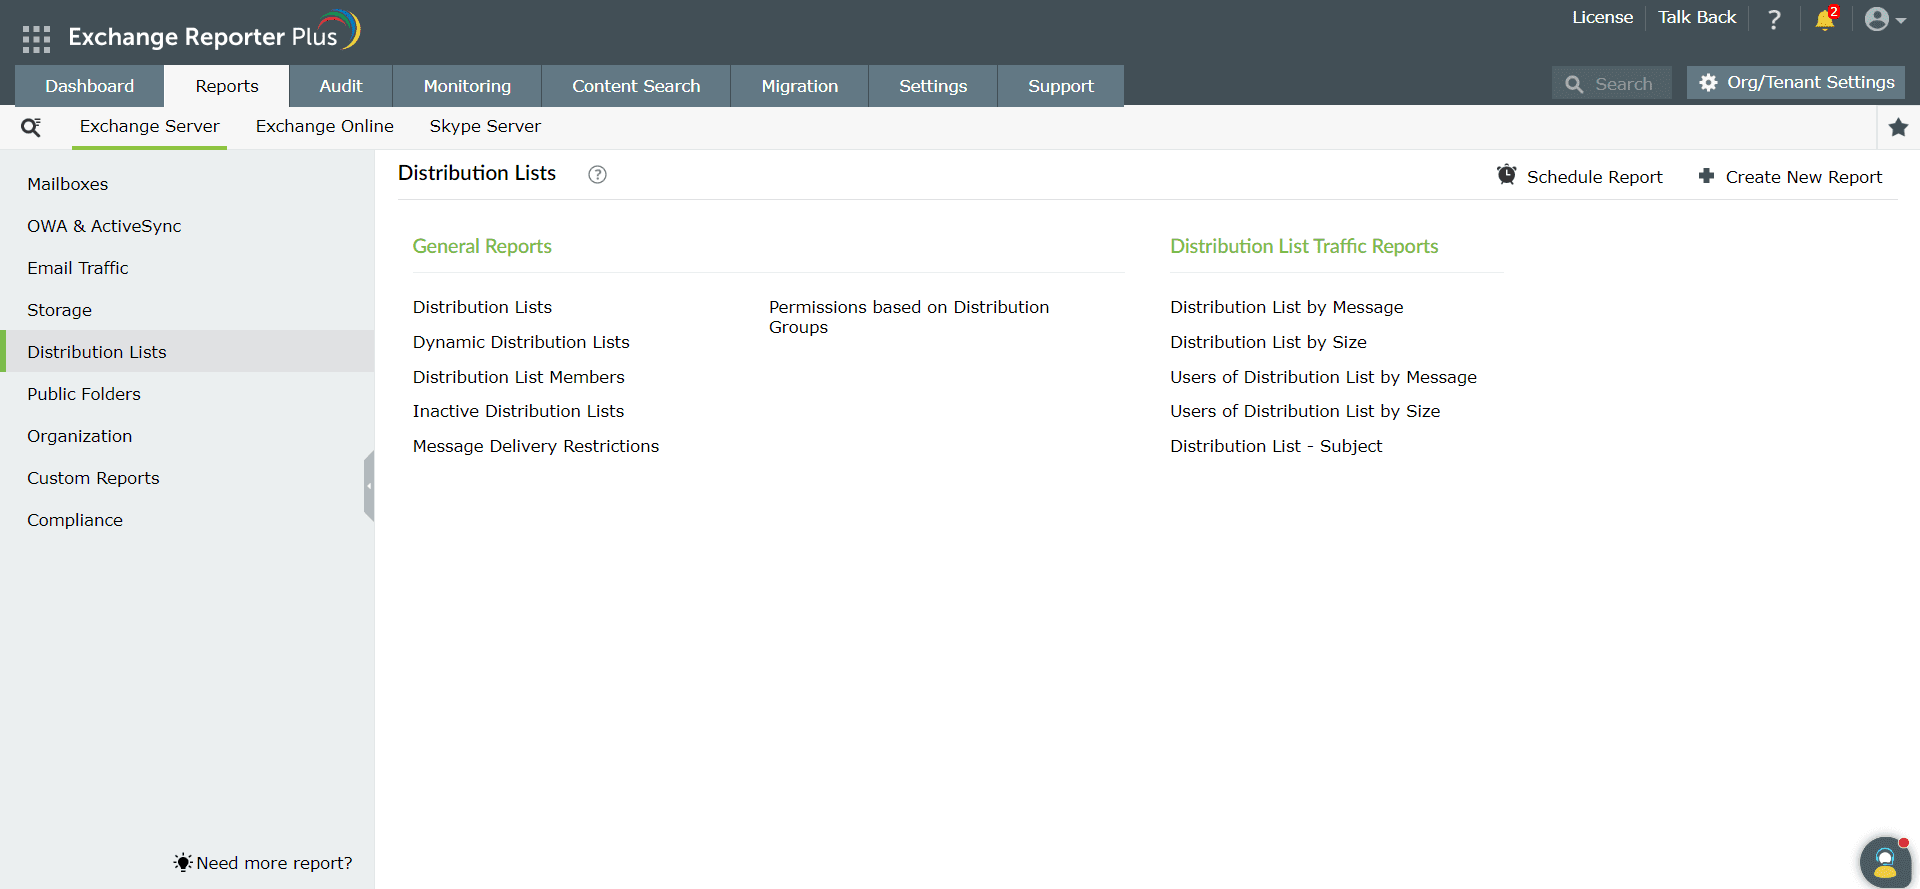
Preconfigured Distribution Lists reports
The reports available under this category are classified into two major subcategories:
General Reports
- Distribution Lists: Shows all the distribution lists and their details, including group scope, total members, and creation date.
- Distribution List Members: Lists all the users who are members of the specified distribution list.
- Inactive Distribution Lists: Shows the distribution lists that have been inactive for the past n days.
- Message Delivery Restrictions: Shows the message delivery restrictions applied for all the distribution lists.
- Permissions based on Distribution Groups: Lists the set of permissions assigned to each distribution group.
- Dynamic Distribution Lists: Shows all the dynamic distribution lists and their details, including their creation dates.
Distribution Lists Traffic Reports
- Distribution List by Message: Shows the top distribution lists by the number of emails sent and received.
- Distribution List by Size: Shows the top distribution lists by the size of emails sent and received.
- Users of Distribution Lists by Message: Shows the top users in a distribution list by the number of emails sent and received.
- Users of Distribution Lists by Size: Shows the top users in a distribution list by the size of emails sent and received.
- Distribution List - Subject: Shows the email subjects used by distribution lists for the specified period.
 ADManager Plus
 ADAudit Plus
 ADSelfService Plus
 M365 Manager Plus