Email traffic reports
Email traffic includes the incoming and outgoing emails to and from an Exchange server. The email traffic reports show all mailbox traffic, traffic to and from the internet, non-delivered email details, and much more. Navigate to the Reports tab → Exchange Server → Email Traffic to get the list of email traffic reports available in Exchange Reporter Plus.
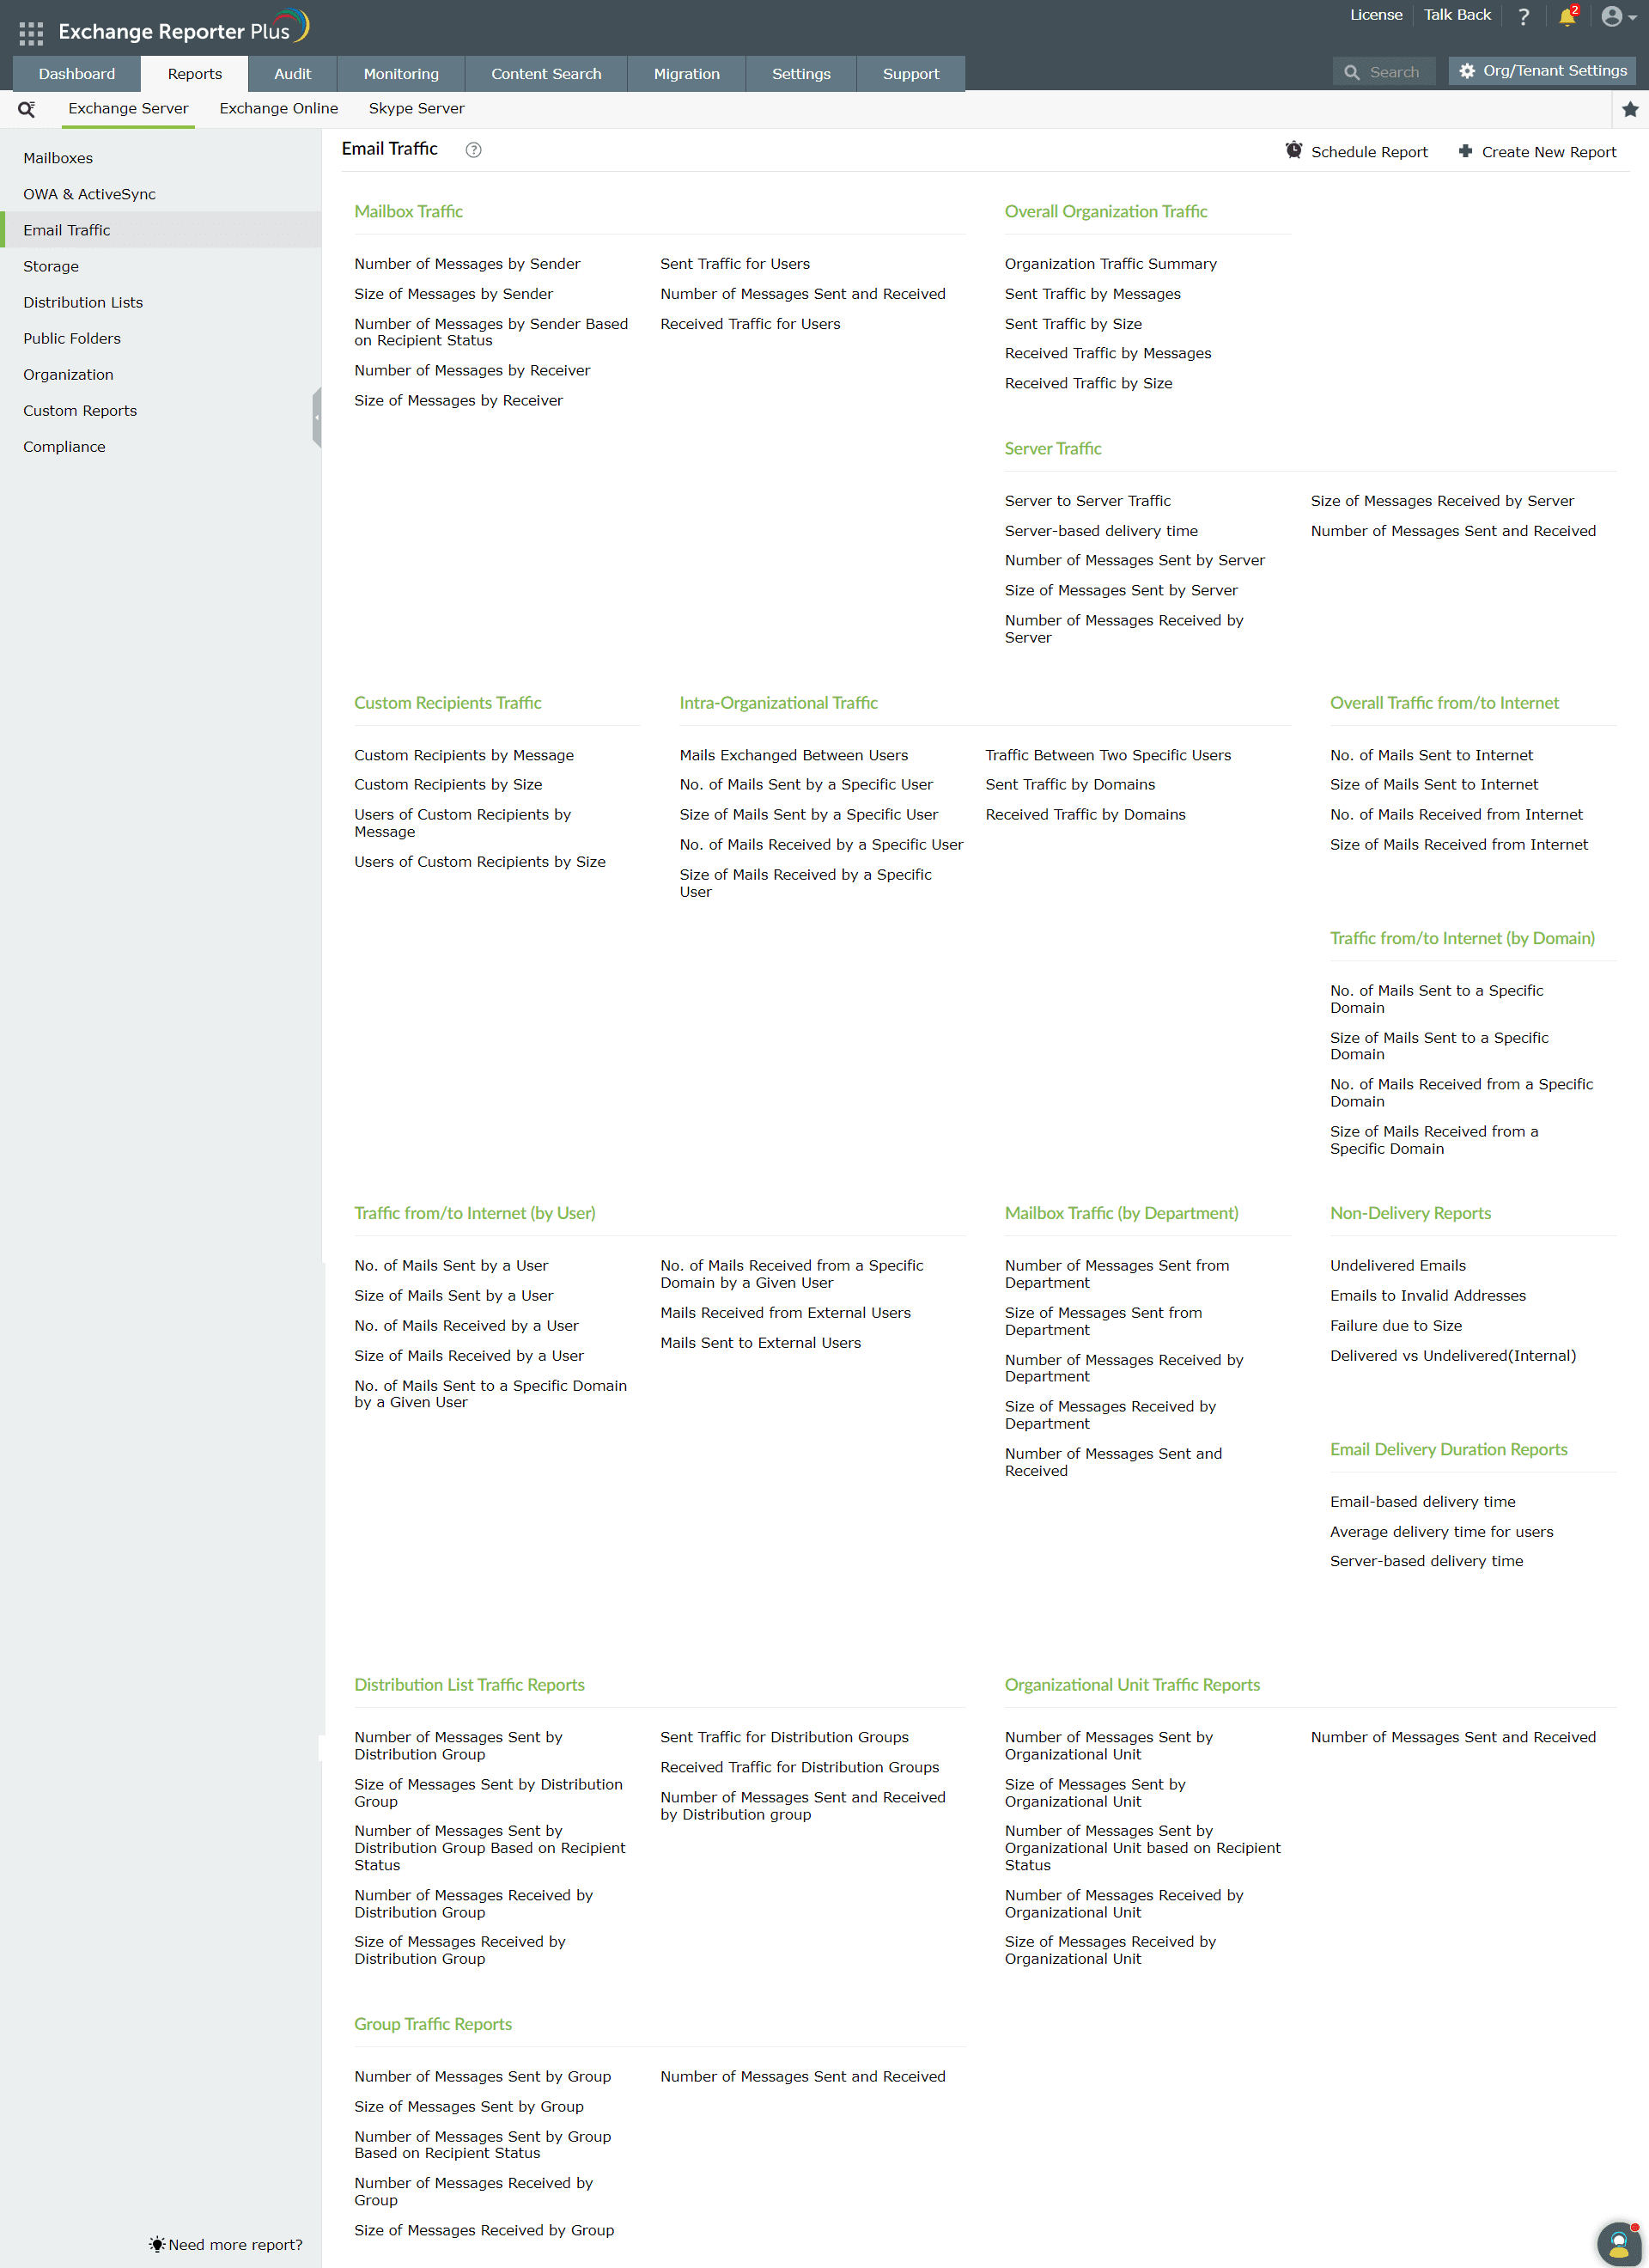
Pre-configured email traffic reports
The reports available under this category are classified into 14 major subcategories:
Mailbox Traffic
- Number of Messages by Sender: Shows the number of emails sent by users during the specified period.
- Size of Messages by Sender: Shows the size of emails sent by users during the specified period.
- Number of Messages by Receiver: Shows the number of emails received by users during the specified period.
- Size of Messages by Receiver: Shows the size of emails received by users during the specified period.
- Sent Traffic for Users: Allows you to drill down into sent email traffic based on sender, time period, and whether the recipient belongs to an internal or external domain.
- Received Traffic for Users: Allows you to drill down into received email traffic based on recipient, time period, and whether the sender belongs to an internal or external domain.
- Number of Messages Sent and Received: Shows the number of emails sent and received by each mailbox.
- Number of Messages by Sender Based on Recipient Status: Shows the number of emails sent based on to, cc and bcc details.
Overall Organization Traffic
- Organization Traffic Summary: Shows the email traffic summary for the entire organization during the specified period.
- Sent Traffic by Messages: Shows the total number of emails sent, and the percentage of internal and external emails during the specified period.
- Sent Traffic by Size: Shows the total size of emails sent, and the split between the size of internal and external emails sent during the specified period.
- Received Traffic by Messages: Shows the total number of emails received, and the split between the number of internal and external emails sent during the specified period.
- Received Traffic by Size: Shows the total size of emails received, and the split between the size of internal and external emails received during the specified period.
Server Traffic
- Server to Server Traffic: Shows the traffic between two servers along with the number and size of emails sent.
- Server-Based Delivery Time: Server-Based Delivery Time
- Number of Messages Sent by Server: Shows the top servers in terms of the number of emails sent.
- Size of Messages Sent by Server: Shows the top servers in terms of the size of emails sent.
- Number of Messages Received by Server: Shows the top servers in terms of the number of emails received.
- Size of Messages Received by Server: Shows the top servers in terms of the size of emails received.
- Number of Messages Sent and Received: Shows the top servers in terms of the number of emails sent and received.
- Server-Based Delivery Time: Shows the email delivery time based on servers.
Custom Recipients Traffic
- Custom Recipients by Messages: Shows the top custom recipients by number of emails received during the specified period.
- Custom Recipient by Size: Shows the top custom recipients by email size during the specified period.
- Users of Custom Recipients by Messages: Shows the top users of custom recipients by the number of messages sent to them during the specified period.
- Users of Custom Recipients by Size: Shows the top users of custom recipients by size during the specified period.
Intra-Organization Traffic
- Mails Exchanged Between Users: Shows the size and number of emails exchanged between users.
- No. of Mails Sent by a Specific User: Shows the number of internal emails sent by a specific user.
- Size of Mails Sent by a Specific User: Shows the size of internal emails sent by a specific user.
- Number of Mails Received by a Specific User: Shows the number of internal emails received by a specific user.
- Size of Mails Received by a Specific User: Shows the size of internal emails received by a specific user.
- Traffic Between Two Specific Users: Shows the number of internal emails sent between two users during the specified period.
- Sent Traffic by Domains: Shows the number of internal emails sent by users on a per domain basis.
- Received Traffic by Domains: Shows the number of internal emails received by domains.
Overall Traffic from/to Internet
- Number of Mails Sent to Internet: Shows the number of emails sent through the internet.
- Size of Mails Sent to Internet: Shows the size of emails sent through the internet.
- Number of Mails Received From Internet: Shows the number of emails received through the internet.
- Size of Mails Received From Internet: Shows the size of email messages received through the internet.
Traffic from/to Internet (by Domain)
- Number of Mails Sent To a Specific Domain: Shows the number of emails sent to a specific domain.
- Size of Mails Sent To a Specific Domain: Shows the size of emails sent to a specific domain.
- Number of Mails Received From a Specific Domain: Shows the number of emails received from a specific domain.
- Size of Mails Received From a Specific Domain: Shows the size of emails received from a specific domain.
Traffic from/to Internet (by User)
- Number of Emails Sent by a User: Shows the number of external emails sent by each user.
- Size of Emails Sent by a User: Shows the size of external emails sent by each user.
- Number of Emails Received by a User: Shows the number of external emails received by each user.
- Size of Emails Received by a User: Shows the number of external emails received by each user.
- Number of Emails Sent to a Specific Domain by a Given User: Shows the number of external emails each user sent to a specific domain.
- Number of Emails Received From a Specific Domain by a Given User: Shows the number of external emails each user received from a specific domain.
- Emails Received From External Users: Shows the details of emails received from external users.
- Emails Sent to External Users: Shows the details of emails sent to external users.
Mailbox Traffic (by Department)
- Number of Messages Sent From a Department: Shows the number of emails sent by each department during the specified period.
- Size of Messages Sent From a Department: Shows the size of emails sent by each department during the specified period.
- Number of Messages Received By a Department: Shows the number of emails received by each department during the specified period.
- Size of Messages Received By a Department: Shows the size of emails received by each department during the specified period.
- Number of Messages Sent and Received: Shows the number of emails sent and received by each department.
Non-Delivery Reports
- Undelivered Emails: Lists all the undelivered emails for the selected time period.
- Emails to Invalid Addresses: Lists all the emails that were not delivered due to invalid recipient addresses.
- Failure Due to Size: Lists all the emails that were not delivered due to email size restrictions.
- Delivered vs. Undelivered (Internal): Shows all the internally delivered and undelivered emails in graphical format.
Email Delivery Duration Reports
- Email-Based Delivery Time: Shows the delivery time for all emails.
- Average Delivery Time for Users: Shows the average time taken to deliver emails for each user.
- Server-Based Delivery Time: Shows the average time each server takes to deliver emails.
Distribution Lists Traffic Reports
- Number of Messages Sent by Distribution Group: Shows the number of emails sent by distribution groups in your Exchange server.
- Size of Messages Sent by Distribution Group: Shows the size of emails sent by distribution groups in your Exchange server.
- Number of Messages Sent by Distribution Group Based on Recipient Status: Shows the number of emails sent by a distribution group based on to, cc and bcc details.
- Number of Messages Received by Distribution Group: Shows the number of emails received by distribution groups in your Exchange Server.
- Size of Messages Received by Distribution Group: Shows the size of emails received by distribution groups in your Exchange server.
- Sent Traffic for Distribution Groups: Shows the total sent email traffic for all distribution groups.
- Received Traffic for Distribution Groups: Shows the total received email traffic for all distribution groups.
- Number of Messages Sent and Received: Shows the number of both sent and received emails per distribution group.
Organizational Unit Traffic Reports
- Number of Messages Sent by Organizational Unit: Shows the number of emails sent by OUs in your Exchange server.
- Size of Messages Sent by Organizational Unit: Shows the size of emails sent by OUs in your Exchange server.
- Number of Messages Sent by Organizational Unit based on Recipient Status: Shows the number of emails sent by a OU based on to, cc and bcc details.
- Number of Messages Received by Organizational Unit: Shows the number of emails received by OUs in your Exchange Server.
- Size of Messages Received by Organizational Unit: Shows the size of emails received by OUs in your Exchange server.
- Number of Messages Sent And Received: Shows the number of both sent and received emails per OU.
Group Traffic Reports
- Number of Messages Sent by Group: Shows the internal, external and actual number of emails sent by a group.
- Size of Messages Sent by Group: Shows the size of internal, external and actual emails sent by a group.
- Number of Messages Sent by Group Based on Recipient Status: Shows the number of emails sent per group based on to, cc and bcc details.
- Number of Messages Received by Group: Shows the internal, external and actual number of emails received by a group.
- Size of Messages Received by Group: Shows the size of internal, external and actual emails received by a group.
- Number of Messages Sent And Received: Shows the total number of emails sent and received by all groups.
 ADManager Plus
 ADAudit Plus
 ADSelfService Plus
 M365 Manager Plus