Forensics
The Forensics link lets you set criteria and view specific details about the traffic across a single interface or WLC device. Data for Troubleshooting reports is taken directly from raw data. Which means that Troubleshooting reports will be available only for the maximum time period for retaining raw data, configured under Settings -> NetFlow -> Storage Settings -> Raw Data Settings. Localization is supported in this report.
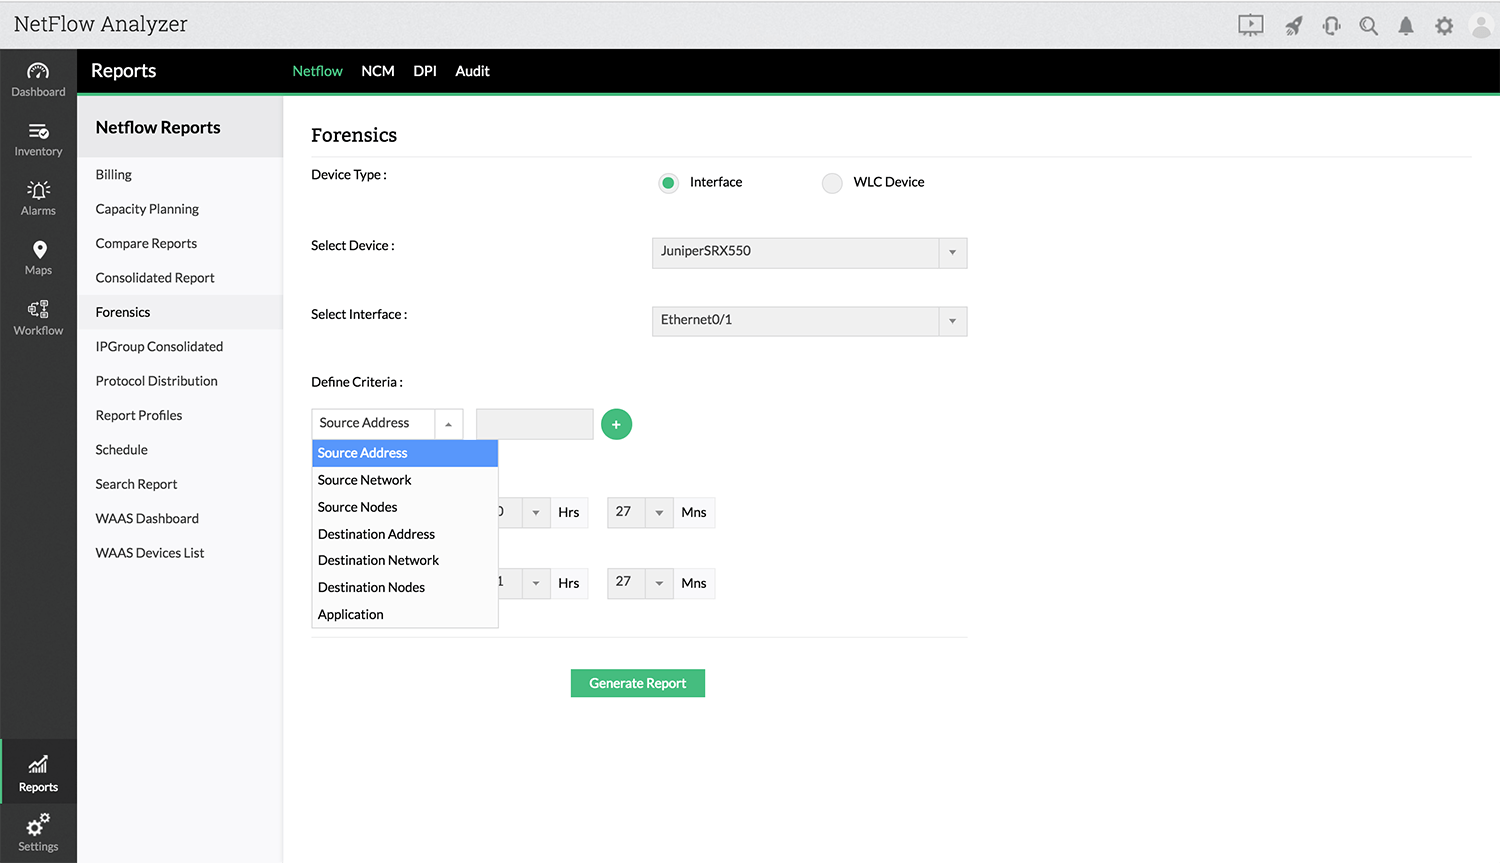
Click on Reports icon  -> Forensics to generate the report , For Interfaces, click the Select Devices link to change the interface that you want to troubleshoot. For WLC Devices, select the Controller and Access Point to view the report. Under Search Criteria, enter the criteria on which the traffic needs to be filtered.
The From and To boxes let you choose custom time periods for the report. Ensure that the time period selected, falls within the Raw Data Retention Period set under Settings, otherwise graphs will show no data.
Use the Traffic Type option to be either Speed, Volume, Utilization or Packets to show the traffic graph generated in the report based on your selection.
Once you select all the desired criteria, click the Generate Report button to display the corresponding traffic IN/OUT, Application IN/OUT, Source IN/OUT, Destination IN/OUT, DSCP IN/OUT, TCP Flag IN/OUT, Next Hop, Conversation IN/OUT, Multicast IN/OUT and Medianet IN/OUT.
The default report view shows the IP addresses of the hosts.
You can export ouput of each view in CSV or Excel by click on the icon  at the top right corner of the report.
Want to learn more about the feature? Check out this link.