Schedule Reports
Schedule feature in NetFlow Analyzer is an easy way to generate reports in Daily, weekly and Monthly basis. A scheduler is configured to set the parameters for automating the generation of reports.
To create an schedule navigate to reports tab  and click on Schedule.
Netflow Analyzer calculates the bandwidth utilization on the specified Interfaces, Interface groups, IP Group, WLC Devices, Access point groups, SSID groups for every minute. Based on the schedule opted for, reports are generated at various time intervals.The Schedule Reports feature lets you Create new Schedules and Delete existing ones. The Scheduler List page lists all existing schedules , along with the Schedule details,Status, Report types,and the Last Report Generated time.
Schedule Profile
Schedule Profile show the Schedule Profiles you have created and the status of the Profiles:
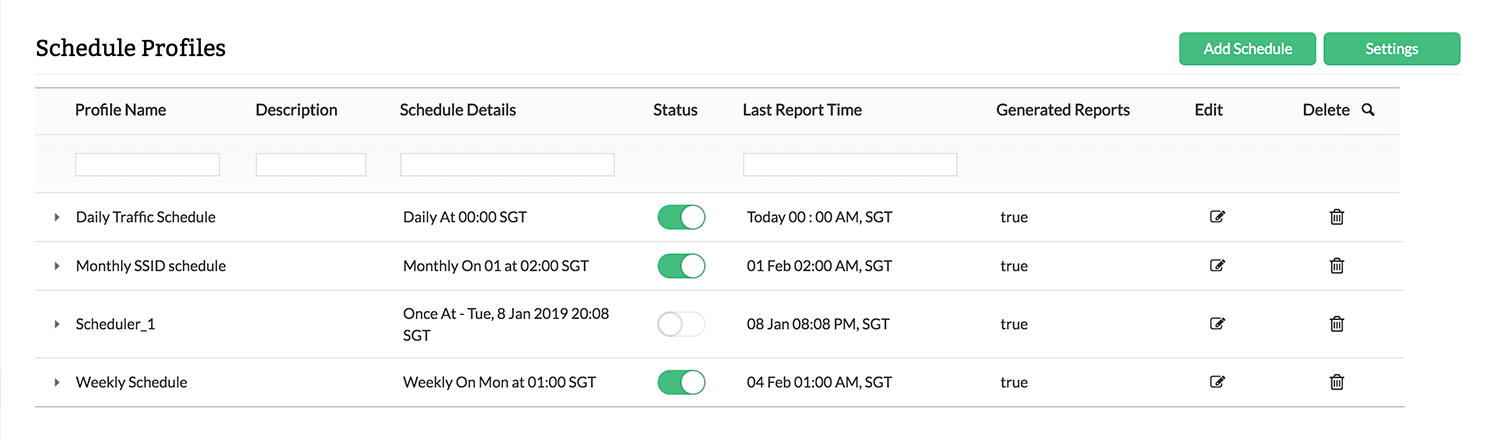
The various columns displayed in the Schedule Profile page are described in the table below:
| Column | Description |
| Profile Name | The name of the Schedule when it was created. Click on the Schedule's name to see more information about the schedule's configuration |
| Description | Show the Description you have set for the schedule |
| Schedule Details | Show what type for schedule is created either Daily, Weekly, Monthly or Only Once |
| Status | By default all schedules are Enabled, which means they are active. Click the  icon to disable a schedule. When this is done, reports will no longer be generated for that configuration. Click the icon icon to disable a schedule. When this is done, reports will no longer be generated for that configuration. Click the icon  to enable the schedule again. to enable the schedule again. |
| Last Report Time | This column lists the last time when this schedule was run and a report created. |
| Generated Reports | By clicking on View Reports it is possible to view all the previous reports that have been generated. The number of reports that are stored is based on the user definition in the Schedule Setting page. (By enabling the item "Enable older reports to be accessed from UI" it is possible to retrieve even older reports.) For Daily Schedule up to 90 reports can be stored. For Weekly Schedule up to 104 reports can be stored. For Monthly Schedule up to 60 reports can be stored. |
| Edit | Click on this icon .JPG?dc=201605140059-8) to edit the created schedule. to edit the created schedule. |
| Delete | Click on this icon .JPG?dc=201605140058-8) to delete the schedule to delete the schedule |
Add Schedule
Add Schedule button on the right top to create an Schedule. Please give the blow parameter to Add the schedule:
| Parameters | Description |
| Schedule Name | Provide an appropriate name to Schedule profile |
| Description | Provide description of the profile to identify the purpose of the schedule created |
| Device Type | You can schedule reports for an Interfaces, Interface group, IP Group, WLC Devices, Access point groups, or SSID group. Select the option based on you requirement. Interface option allow you to select Interface for which you need the reports to be scheduled. IP groups and Interface Groups will allow you to select the created IP and Interface groups for which you need to schedule the reports. Access point groups and SSID Groups will allow you to select the created Access point and SSID groups for which you need to schedule the reports. WLC devices option allow you to select WLC devices for which you need the reports to be scheduled. |
| Report Type | The type of report to be generated - Please select as per your requirement from the dropdown consisting the following:
|
| Report Format | You can select the format as PDF or CSV with which the reports will be exported to your email address |
| Time Zone | You can Select the Time Zone based for the reports to be generated. This will help operation to get reports who are in different geographic locations. |
| Report Days | Select the report generation frequency as one from : Daily, Weekly, Monthly and Only Once. Depending on this the report will be generated at the appropriate time intervals. |
| Report Date | You can select the Date for which you need the report to be generated. This option is only available for the Only Once option only |
| Report Time | Select the time period at which the reports has to be generated based on the schedule days you have selected |
| Report Period | You can select the Period for which for which the data should refelect in the Report to be genereted For Only Once Option you can select the Report Period to be Previous Day, Last 24 hours, Today, Last 6 hours, Last Hour, Previous Week, Last 7 days, Previous Month, Last 30 days, Last Quarter and Custom. Custom Select allows you to sepcify the From and To time period for which you need the report. For Daily, weekly and Monthly reports you can select the time period to be Previous Day, Last 24 hours, Last 6 Hours, Last Hour, |
| Mail Notification | You Can Select the Mail Notification to be ON or OFF. If you select ON you will receive the reports generated in the schedule to the email address you will specify.
|


Schedule Settings
This link lets you set parameters that could be applied across all the generated reports. The parameters include:
- Host Name display in reports - This determines how the host name is displayed in reports. It could be chosen as one of
o IP Address ( or )
o DNS Name
- Graph Options (Report Type to be shown in reports) - This determines how the data is to be shown in the generated reports. This could be one of
o Utilization (in %) ( or )
o Speed (in bps)
- Mail Attachment option - The format in which the attachments are to be mailed. It could be one of
o Zipped file ( or )
o PDF - The number of PDF files to be sent in a mail is to be specified. The number may range from 5 to 50 in increments of five
- Qos Options - This determines what the QOS report contains. This could be choosen from one of below:
o DSCP ( or )
o TOS
- Enable older reports to be accessed from UI