Self Monitoring
NetFlow Analyzer enables the product to automatically run routine health and threshold checks and notify users with its Self Monitoring settings. With Self Monitoring, you can now monitor and set thresholds for the various NetFlow processing methods and receive alerts via email and notifications. This automation ensures that the device in which NetFlow Analyzer is installed and running from is healthy and monitored.
Configuring Self Monitoring in NetFlow Analyzer
To configure Self Monitoring, go to Settings > General Settings > Self Monitoring.
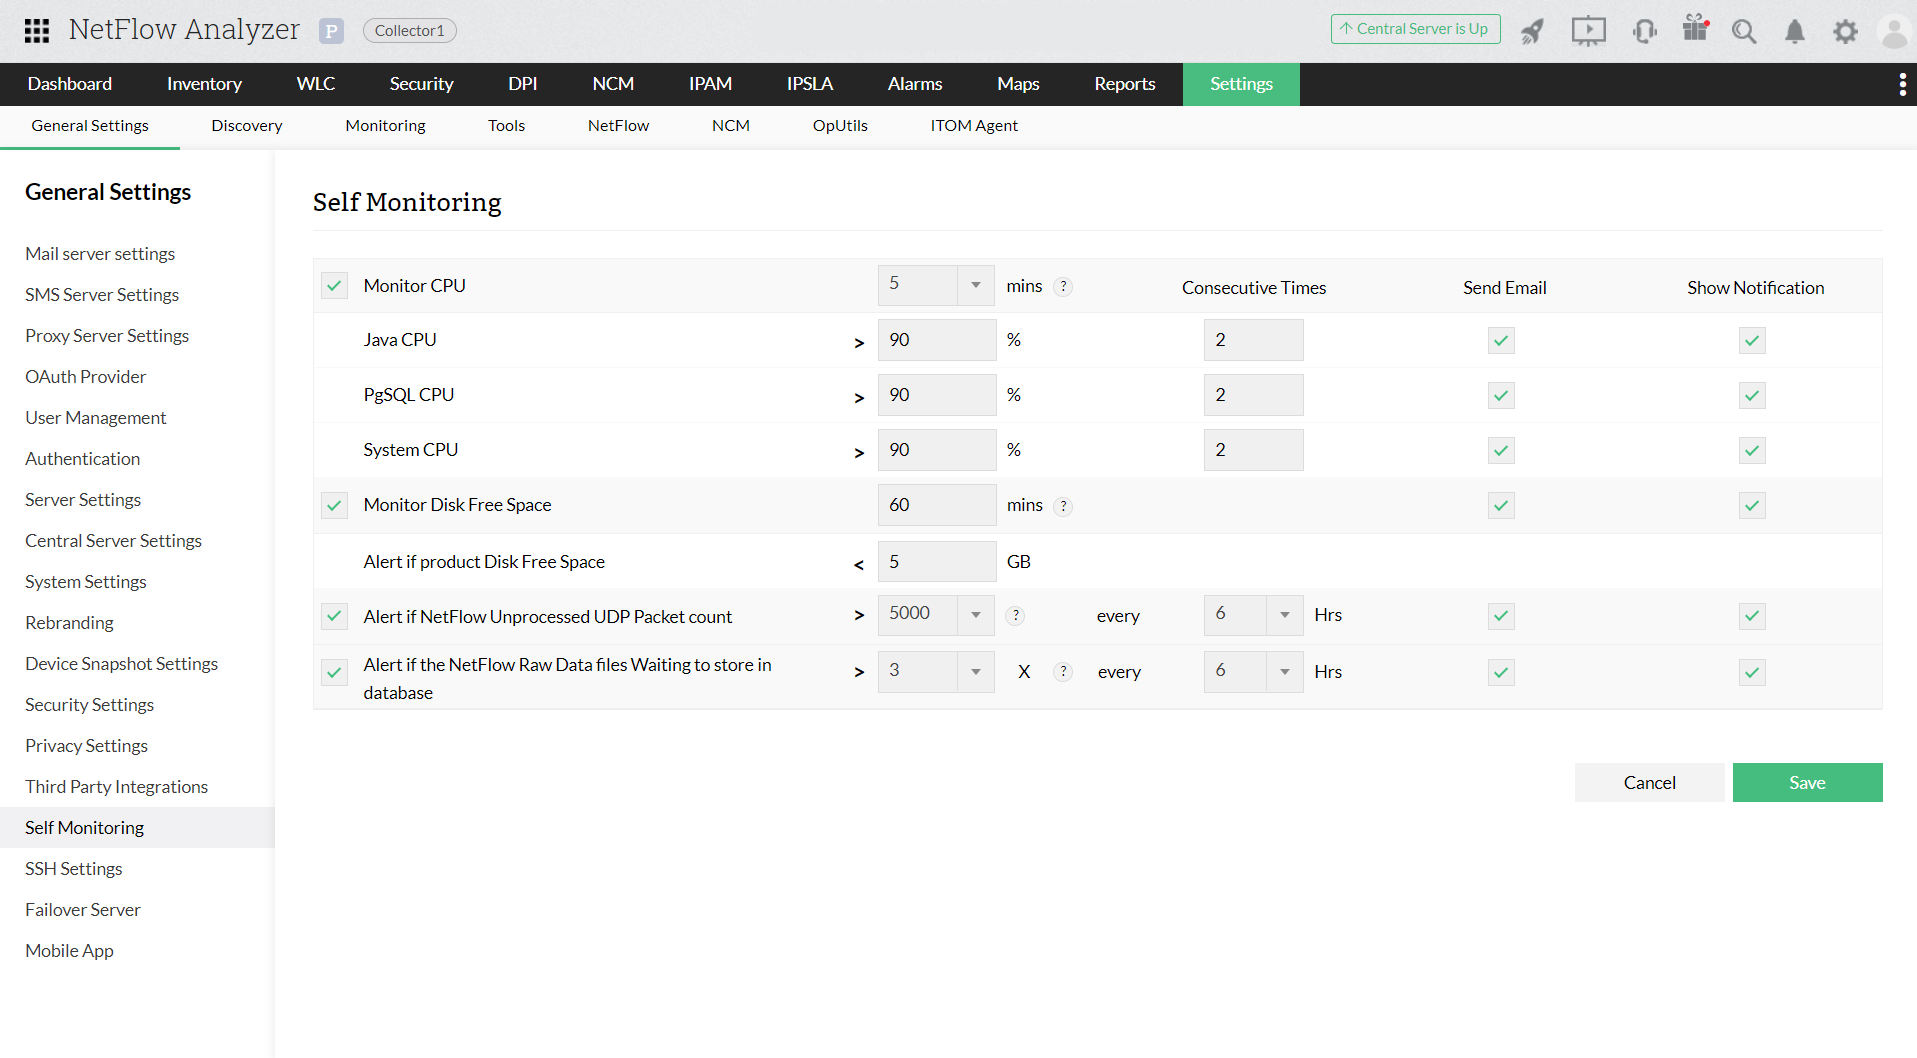
NetFlow Analyzer Unprocessed UDP Packet Count
NetFlow UDP packets stand over the top of the Internet Protocol to transfer data packets over the network. When an incoming set of flow packets are received, NetFlow processes these packets to the required form for further evaluation. When these incoming flows are large in quantity, they are made to wait in queues. When this queue goes beyond a certain value, depending upon the system specification in which the product is installed, the product may start working improperly. The new Self Monitoring check feature helps to alert users to this condition and take appropriate measures.
Under the Self Monitoring tab:
- Select the packet count from the drill down menu of NetFlow Unprocessed UDP packet count (5,000, 7,500, 10,000, 12,500, 15,000).
- Select a time period (every 3 hrs, 6 hrs, 12 hrs, 24 hrs, 48 hrs), with 6 hrs being the default.
- Select whether you'd like to receive the alert via email, notification, or both.
- Click Save.
If you received a threshold violation notification, contact our customer care for support at netflowanalyzer-support@manageengine.com.
Monitor NetFlow Raw Data Files
When the raw data is enabled for a certain device, the incoming data packets are configured to be stored onto the database. And as raw data is enabled for more devices, the process tends to become bulky. The raw data files waiting to store in the database may queue, leading to poor performance.
Setting thresholds ensures that an alert is raised when the queue value goes above a certain times the router count (X).
- Select the router count in the drill down (1X, 2X, 3X, 4X, 5X), with 3 times the router (3X) count being the default.
- Select the time period (every 3 hrs, 6 hrs, 12 hrs, 24 hrs, or 48 hrs), with 6 hrs being the default.
- Choose whether you'd like to receive the alert via email, notification, or both.
- Click Save.
If the value goes beyond the threshold limit, the following solutions can be implemented:
- Disable the raw data for some devices to reduce the overall load.
- For PostgreSQL database, use the High-Perf add-on to solve the problem.
If you are already using High-Perf or if the above steps are not viable, please contact support at netflowanalyzer-support@manageengine.com.