Applications
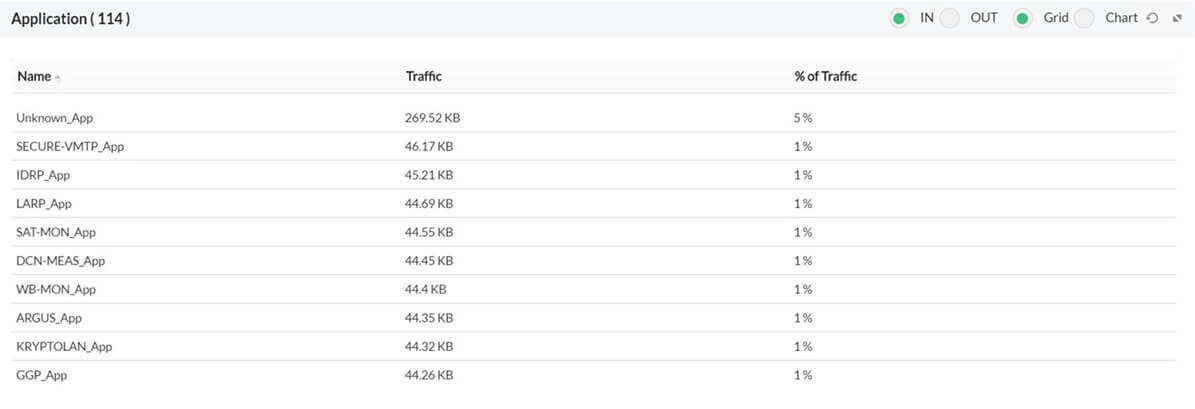
The Applications tab displays all the applications that pass through a specific interface for a selected period of time. Choose between IN and OUT to display the application-wise distribution of incoming or outgoing traffic respectively for selected interface using the radio button  above the widget . The default view of the application report shows Traffic IN details. The applications, for the ease of monitoring can be grouped as application groups and top-sites.
We have 2 views to view the Application view. You can select view by click on the Radio Buttons  above the widget.
Chart View
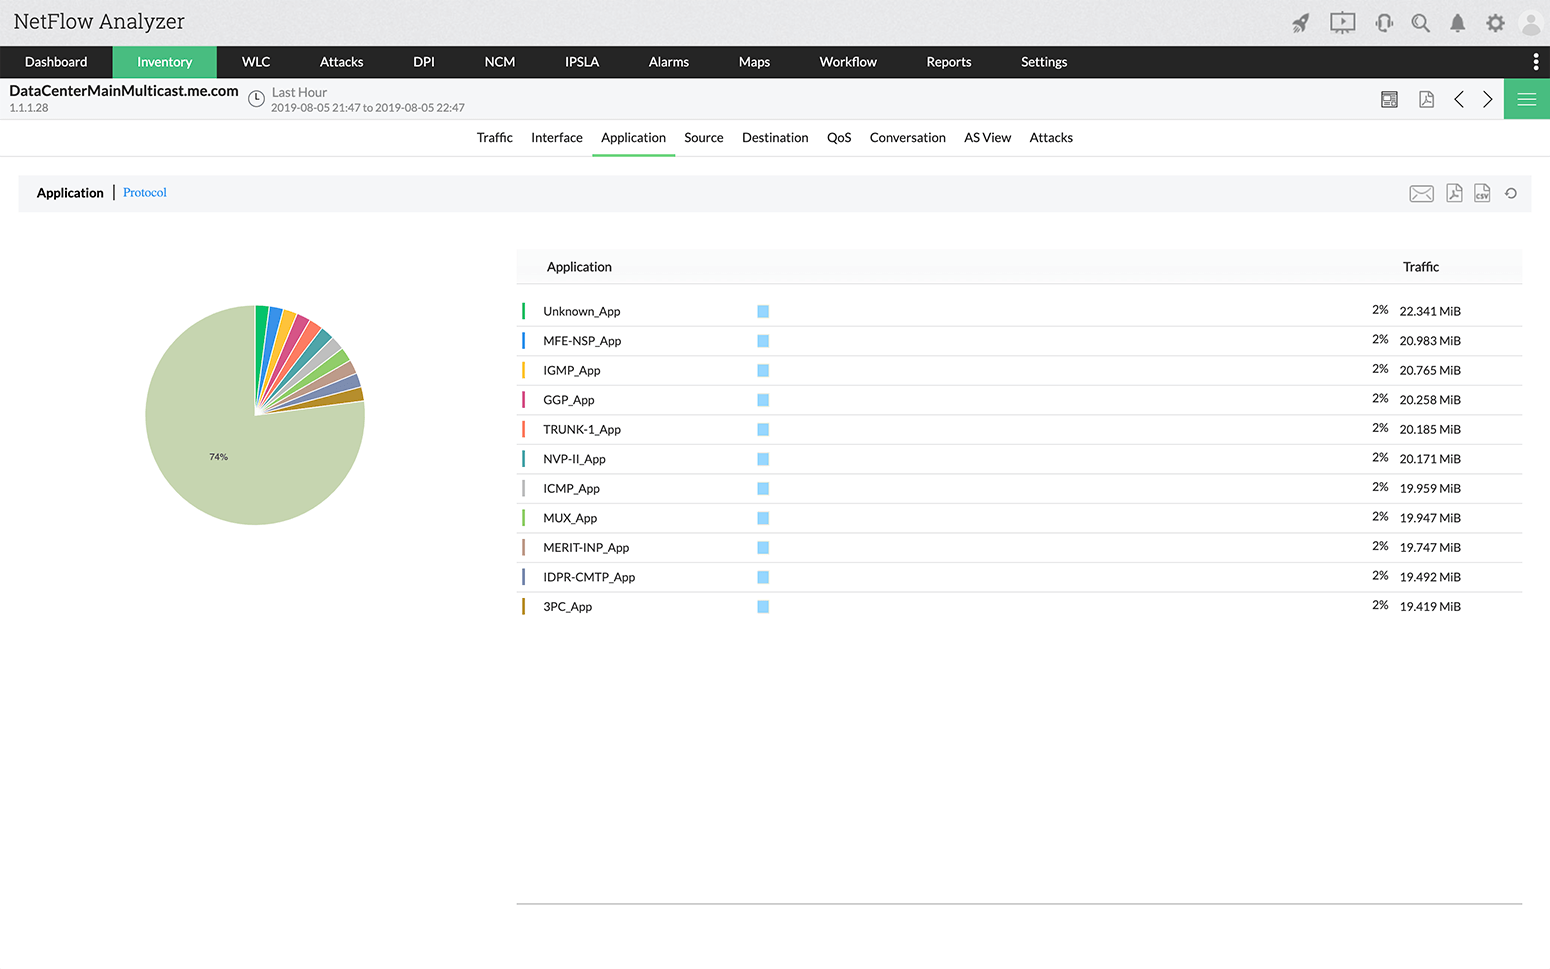
List View:
Applications Report
The report shows application-wise distribution of incoming and outgoing traffic. The list of applications are ordered to show the top applications that contribute to maximum network traffic along with the volume of traffic and the total percentage of network traffic it occupies. Clicking on the application name will highlight the detailed report of the traffic.
// The Show Ports Link next to an application name indicates that that application is not identified by NetFlow Analyzer. When you click on Show Ports Link, a window opens up showing the port and protocol details for this application. If it is a valid application you can then add it to the list of applications in the Application Mapping page. ( This Option will be available in next release )
 | The Show Ports Link will be displayed next to an unknown application only in the Last Hour report. |
Click on an application's name to see the Top Conversations that contributed to this application's traffic.
You can export the report as PDF by clicking on the  icon.
icon.
Applications Group
This report displays different applications that are grouped together for the ease of view. This feature enables you to group the applications as a single entity.
Creating an application group:
To create applications group navigate to Settings -> NetFlow -> Group Settings -> Application Group
- Select Application Group
- Click on "add" to create a new application group
- Specify the group name, a description about the group and select the applications you want to group together
- Click "save" to view the application group.
Now, a new application group has been created.
Adding a sub application
The "Add Sub App" options allows you to add a sub application to the list of applications under top sites tab. Through this, you can add a name to the IP address, range, or network and associate it with an application name. This helps identify the IP network, range or address that has accessed a particular application.
Viewing Top Protocols
Click on the drop arrow and select Protocol link to see the top protocols for the selected Devices in Devices reports view:
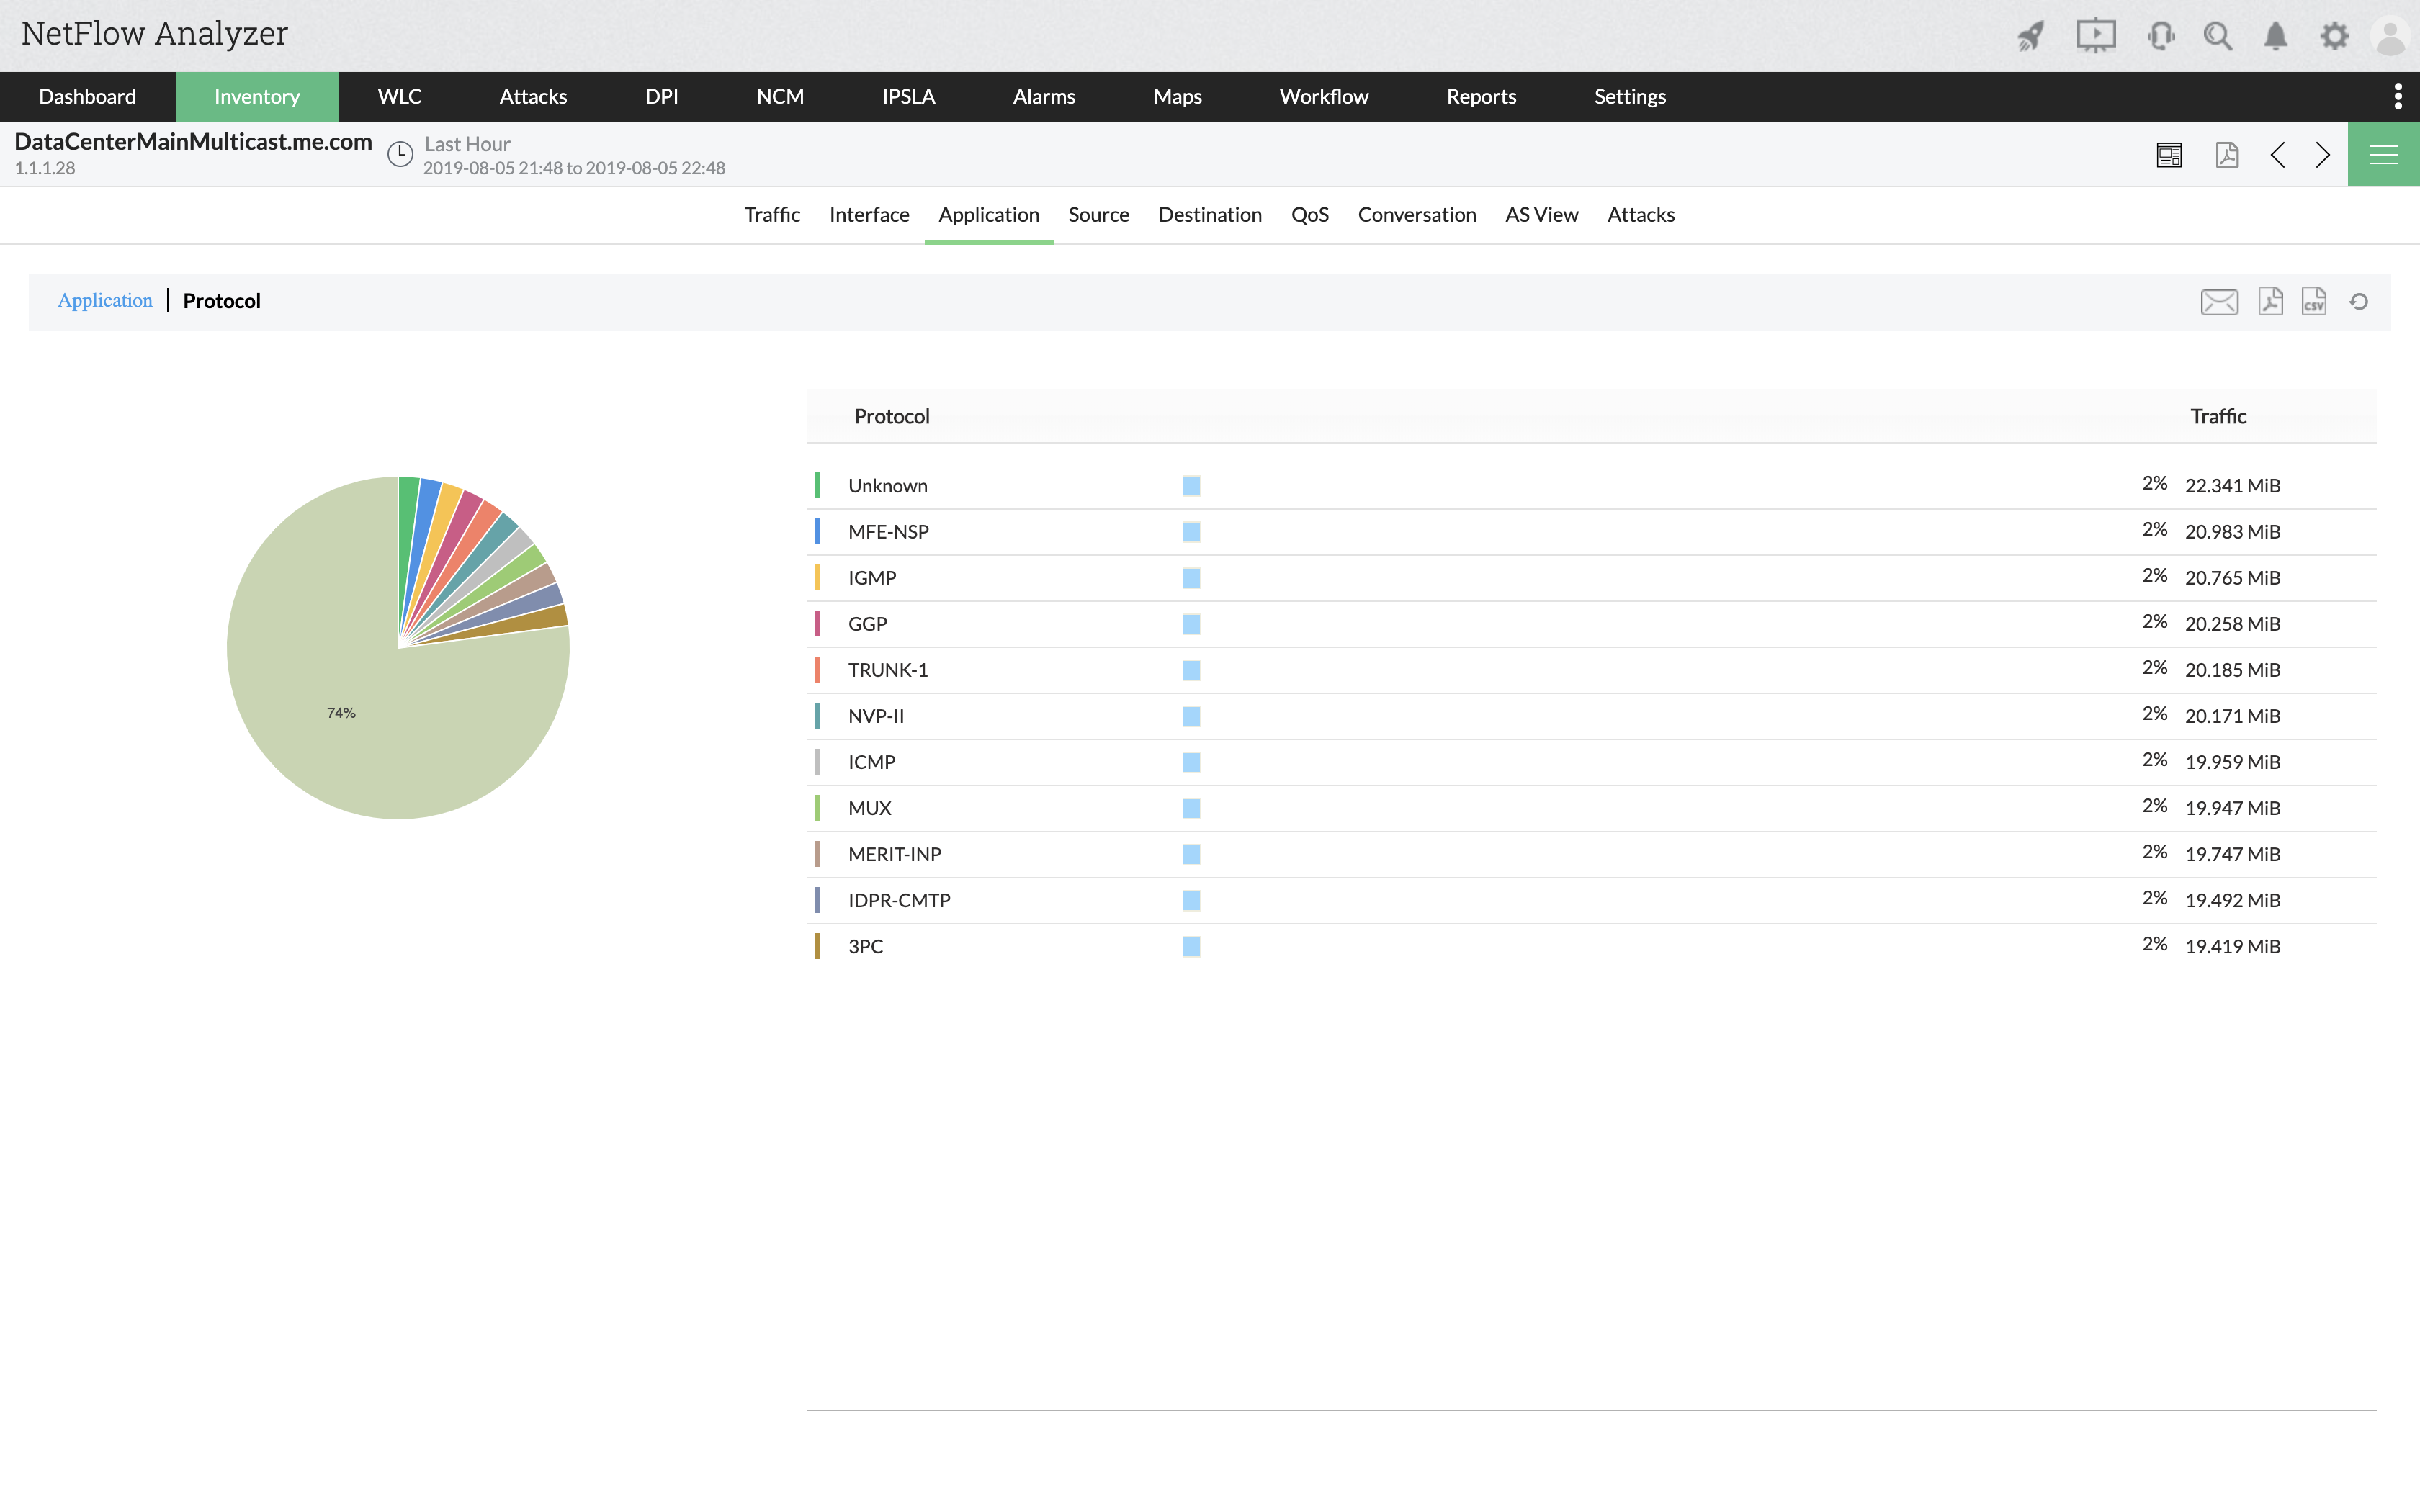
Choose between IN and OUT to display the protocol-wise distribution of incoming or outgoing traffic respectively.
| This report sorts traffic based on the protocol used, while the Application IN/OUT Report sorts traffic based on the application, i.e., the combination of port and protocol.
|
The pie chart shows what percentage of bandwidth is being used by each protocol. From here, you can the export the report as a PDF by clicking on the  icon.
icon.
Support for Internet Protocol Version 6(IPV6)
IP version 6 (IPv6) is a new version of the Internet Protocol, designed as the successor to IP version 4 (IPv4). IPv6 increases the IP address size from 32 bits to 128 bits, to support more levels of addressing hierarchy.
NetFlow Analyzer now offers support for IPV6. You can view the raw data records for the last two hours in IPV6 format. since the IPV6 addressing format yet to be adapted by most people worldwide we are offering support for IPV6 format only at raw data level. The raw data collected for top ten applications, source, and destination for the past two hours can be viewed in IPV6 format.