Traffic Overview in NetFlow Analyzer
Traffic overview provides details information on top talker in your network in an quick view with the Information on the Interfaces monitored using the Heat Map, Top Conversations, Top QOS, Top Applications, Top Protocols, Device Summary, and Recent Alarms .
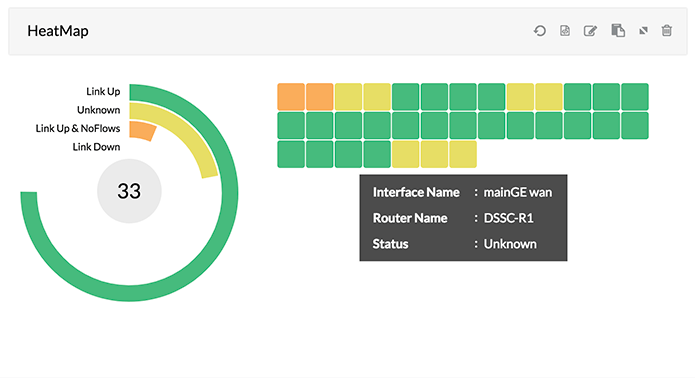
Heat Map Widget
Provides the information on the Interfaces monitored and sending flows, inactive interfaces that are not sending flows and interfaces that are administratively down with different color codes.
You can also mouse over to the heat map to get the Interface detail, Device with which the interface is associated with and the status of the interface. You can even click on the any interface in Heat map and this will take you to the Interface details view.
 | Widget names can be changed by clicking on the edit icon next to the widget |
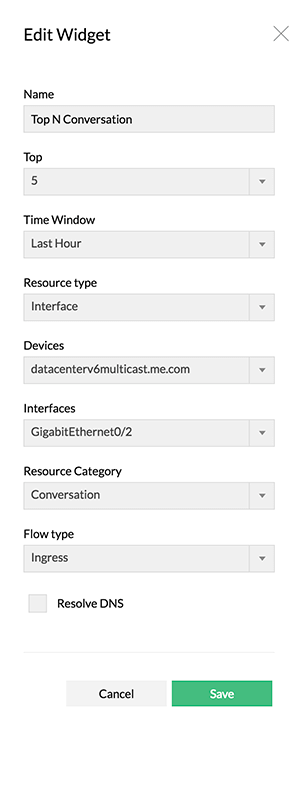
Top N Conversations
The table gives a glance about the top 5 or 10 conversations based on the Device, Interfaces , Interface Groups or IPGroups with information on Source IP, Destination IP, Application and Traffic utilized. By default the widget will show the top conversations from all the devices monitored in NetFlow Analyzer.
You can customize the Widget to view the information based on Interfaces, interface groups or IP groups for different time periods like Last 30 mins, Hourly, 6 Hours, 24 Hours, Today and Yesterday by clicking on the edit icon ![]() on the right top of the Widget.
on the right top of the Widget.
You can get the widget information based on IP address or Network address by selecting the Resource Category in the Edit view.
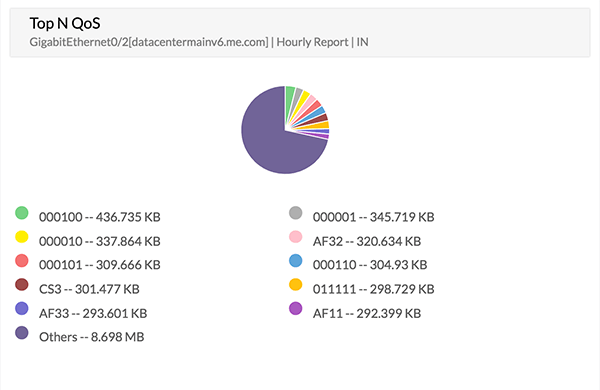
The chart gives a glance about the top 10 DSCP and its utilization based on the Device, Interfaces, Interface Groups or IPGroups. By default the widget will show the top DSCP based information from all the devices monitored in NetFlow Analyzer.
You can customize the Widget to view the information based on Interfaces or IP groups for different time periods like Last 30 mins, Hourly, 6 Hours, 24 Hours, Today and Yesterday by clicking on the edit icon ![]() on the right top of the Widget.
on the right top of the Widget.
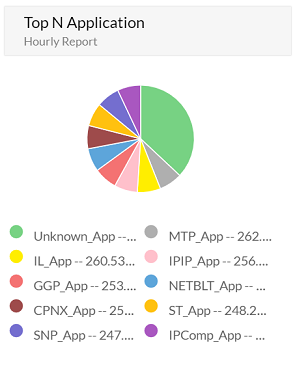
The table gives a glance about the top 10 Application and its utilization based on the Device, Interface, Interface Groups or IPGroups. By default the widget will show the top Applications based information from all the devices monitored in NetFlow Analyzer.
You can customize the Widget to view the information based on Interfaces or IP groups for different time periods like Last 30 mins, Hourly, 6 Hours, 24 Hours, Today and Yesterday by clicking on the edit icon ![]() on the right top of the Widget.
on the right top of the Widget.
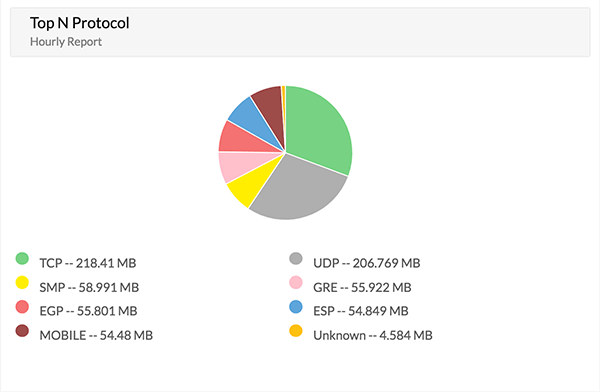
The table gives a glance about the top 10 Protocol and its utilization based on the Device, Interfaces, Interface Groups or IPGroups. By default the widget will show the top Protocols based information from all the devices monitored in NetFlow Analyzer.
You can customize the Widget to view the information based on Interfaces or IP groups for different time periods like Last 30 mins, Hourly, 6 Hours, 24 Hours, Today and Yesterday by clicking on the edit icon ![]() on the right top of the Widget.
on the right top of the Widget.
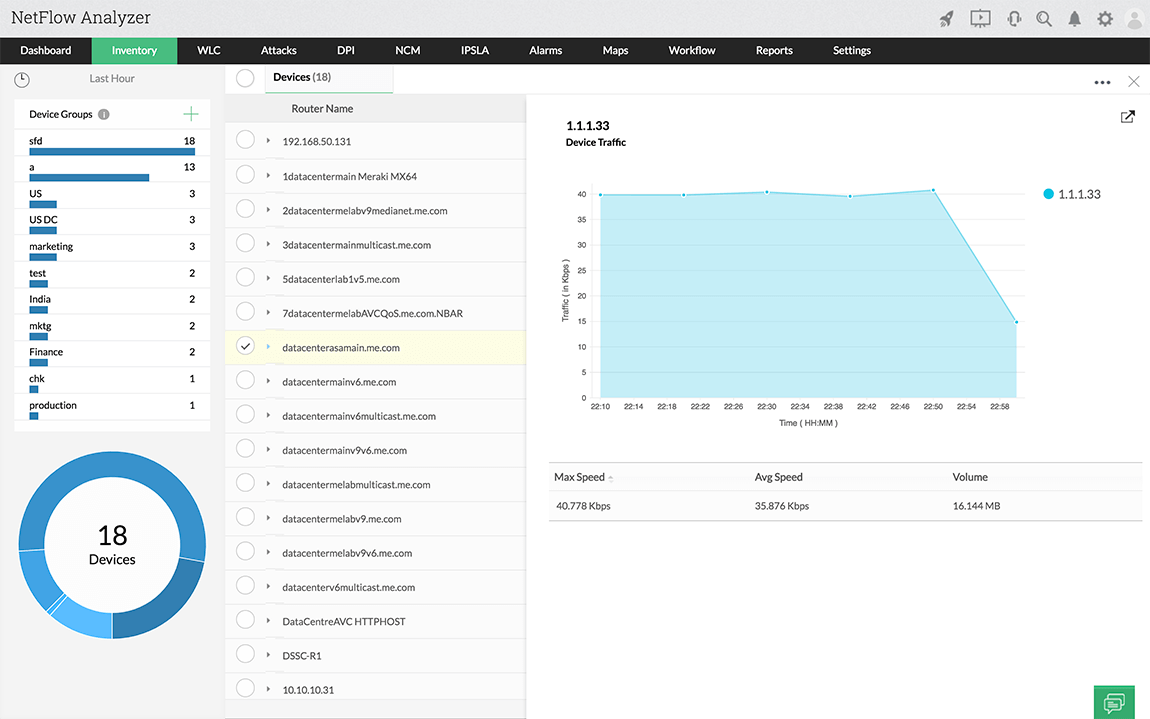
Device Summary
Quick Details on Devices Monitored with Device Summary details based on categories like Routers, Switches, Firewalls and WLC. You can get to the Device details view by directly cliking on any device.
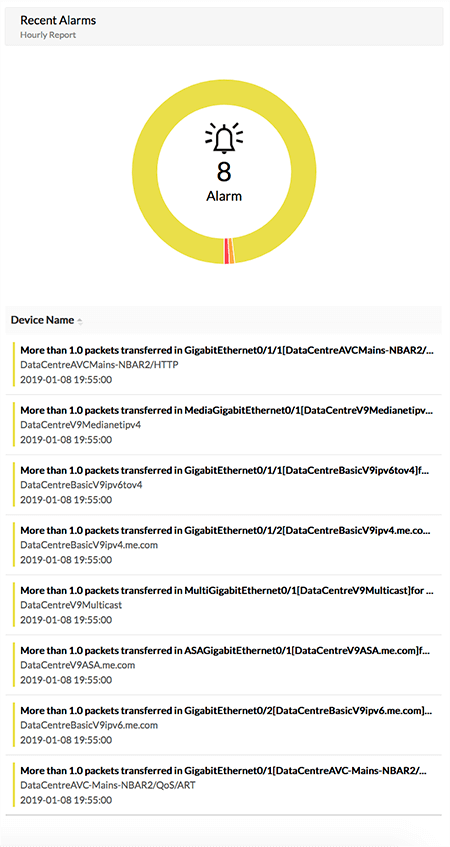
The alerts report provides an at-a-glance view of the alerts generated in the network for the last hour and a specified time period. The alerts are generated based on the list of criteria provided in the alert profile.Click on the last hour or all alert link to view the type of alerts. The report lists the device name, the interface and the time at which the alert was last generated and the number of such alerts.