Over 15,000 happy customers worldwide trust OpManager

Saint Gobian
NASA
Time Warner Cable
Lorean Paris
Siemens
DHL
Alcatel Lucent

What makes OpManager a stronger alternative to Nagios XI?

All-in-one IT management console

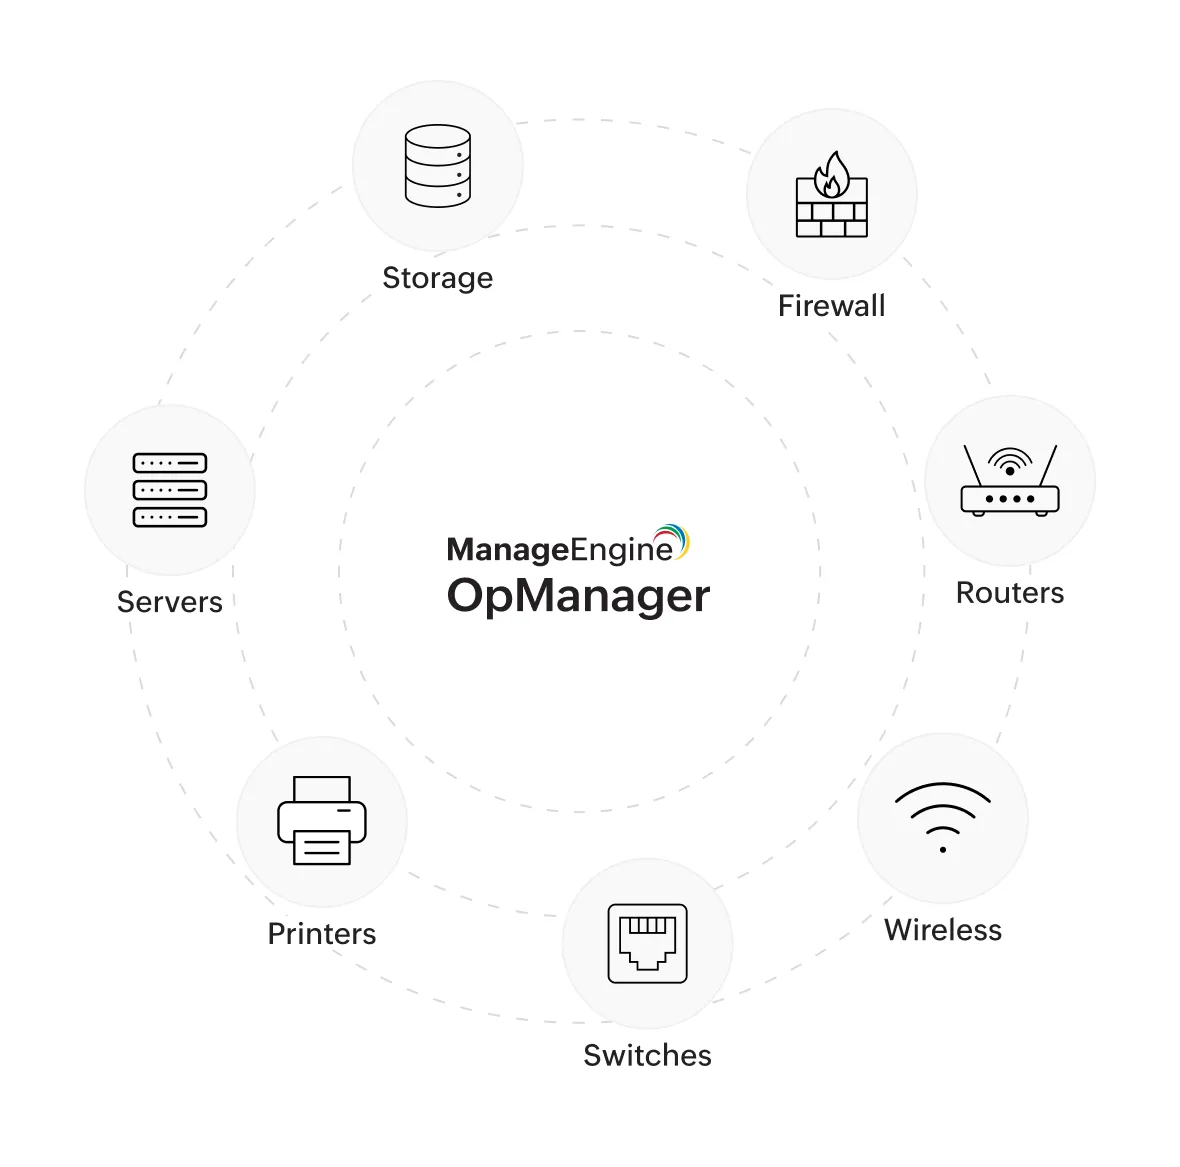
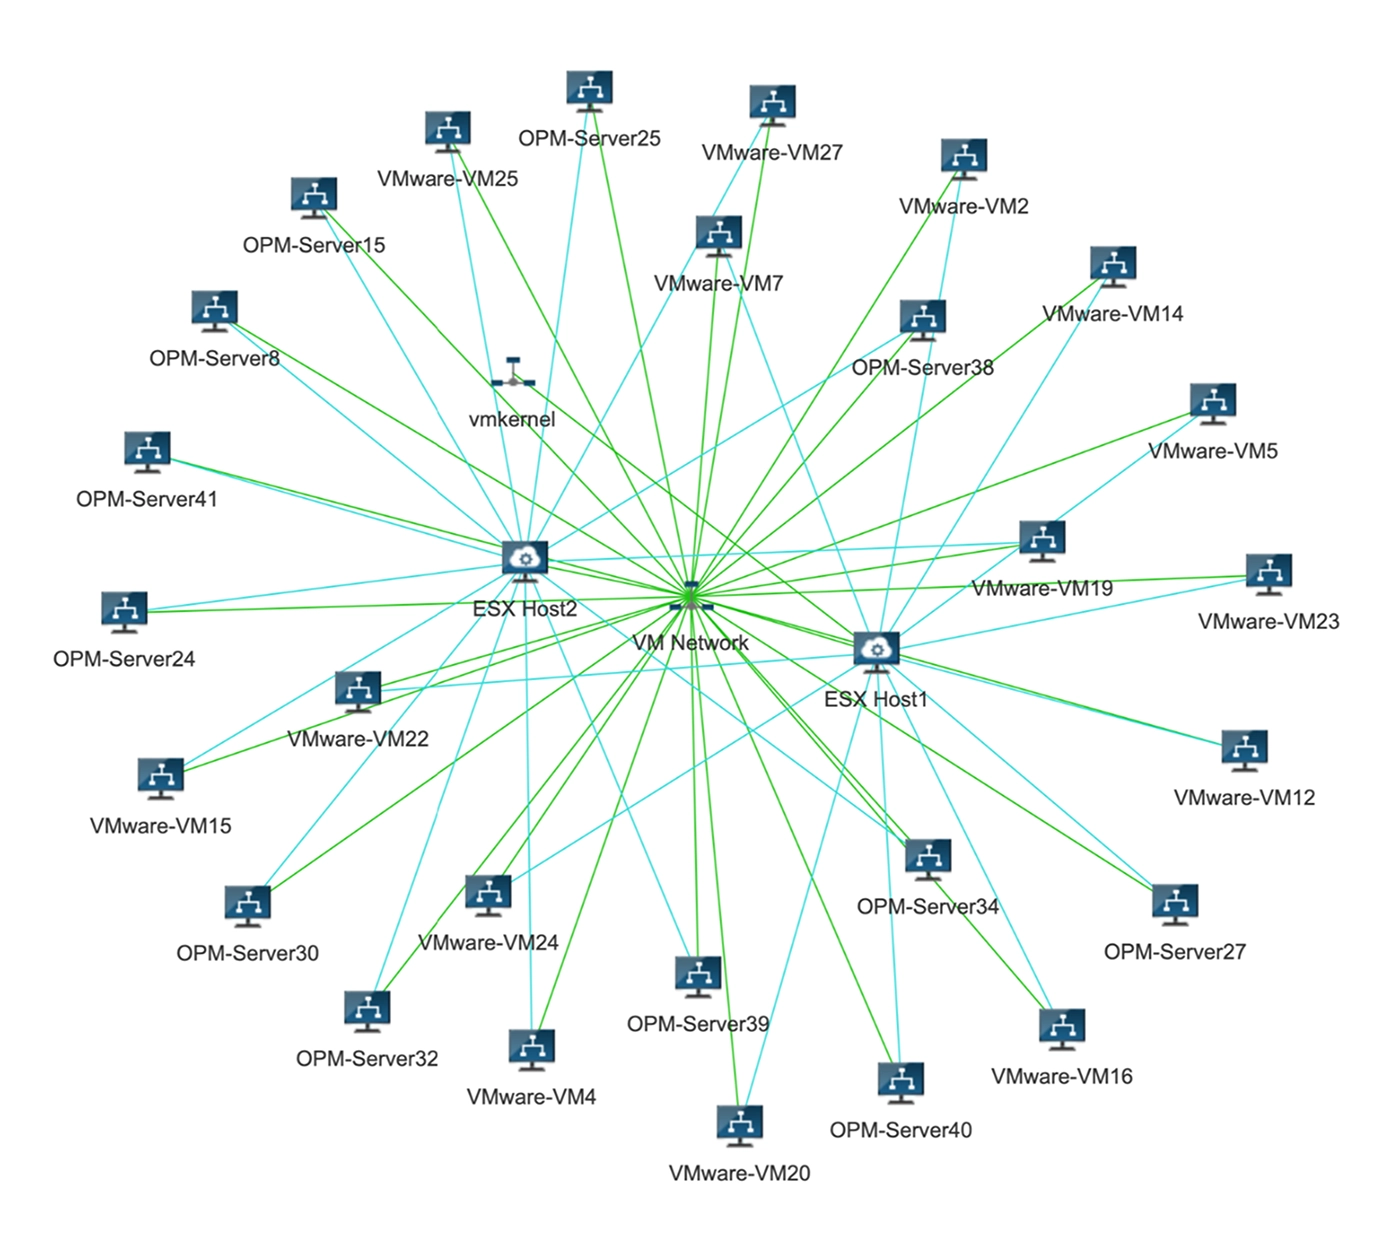
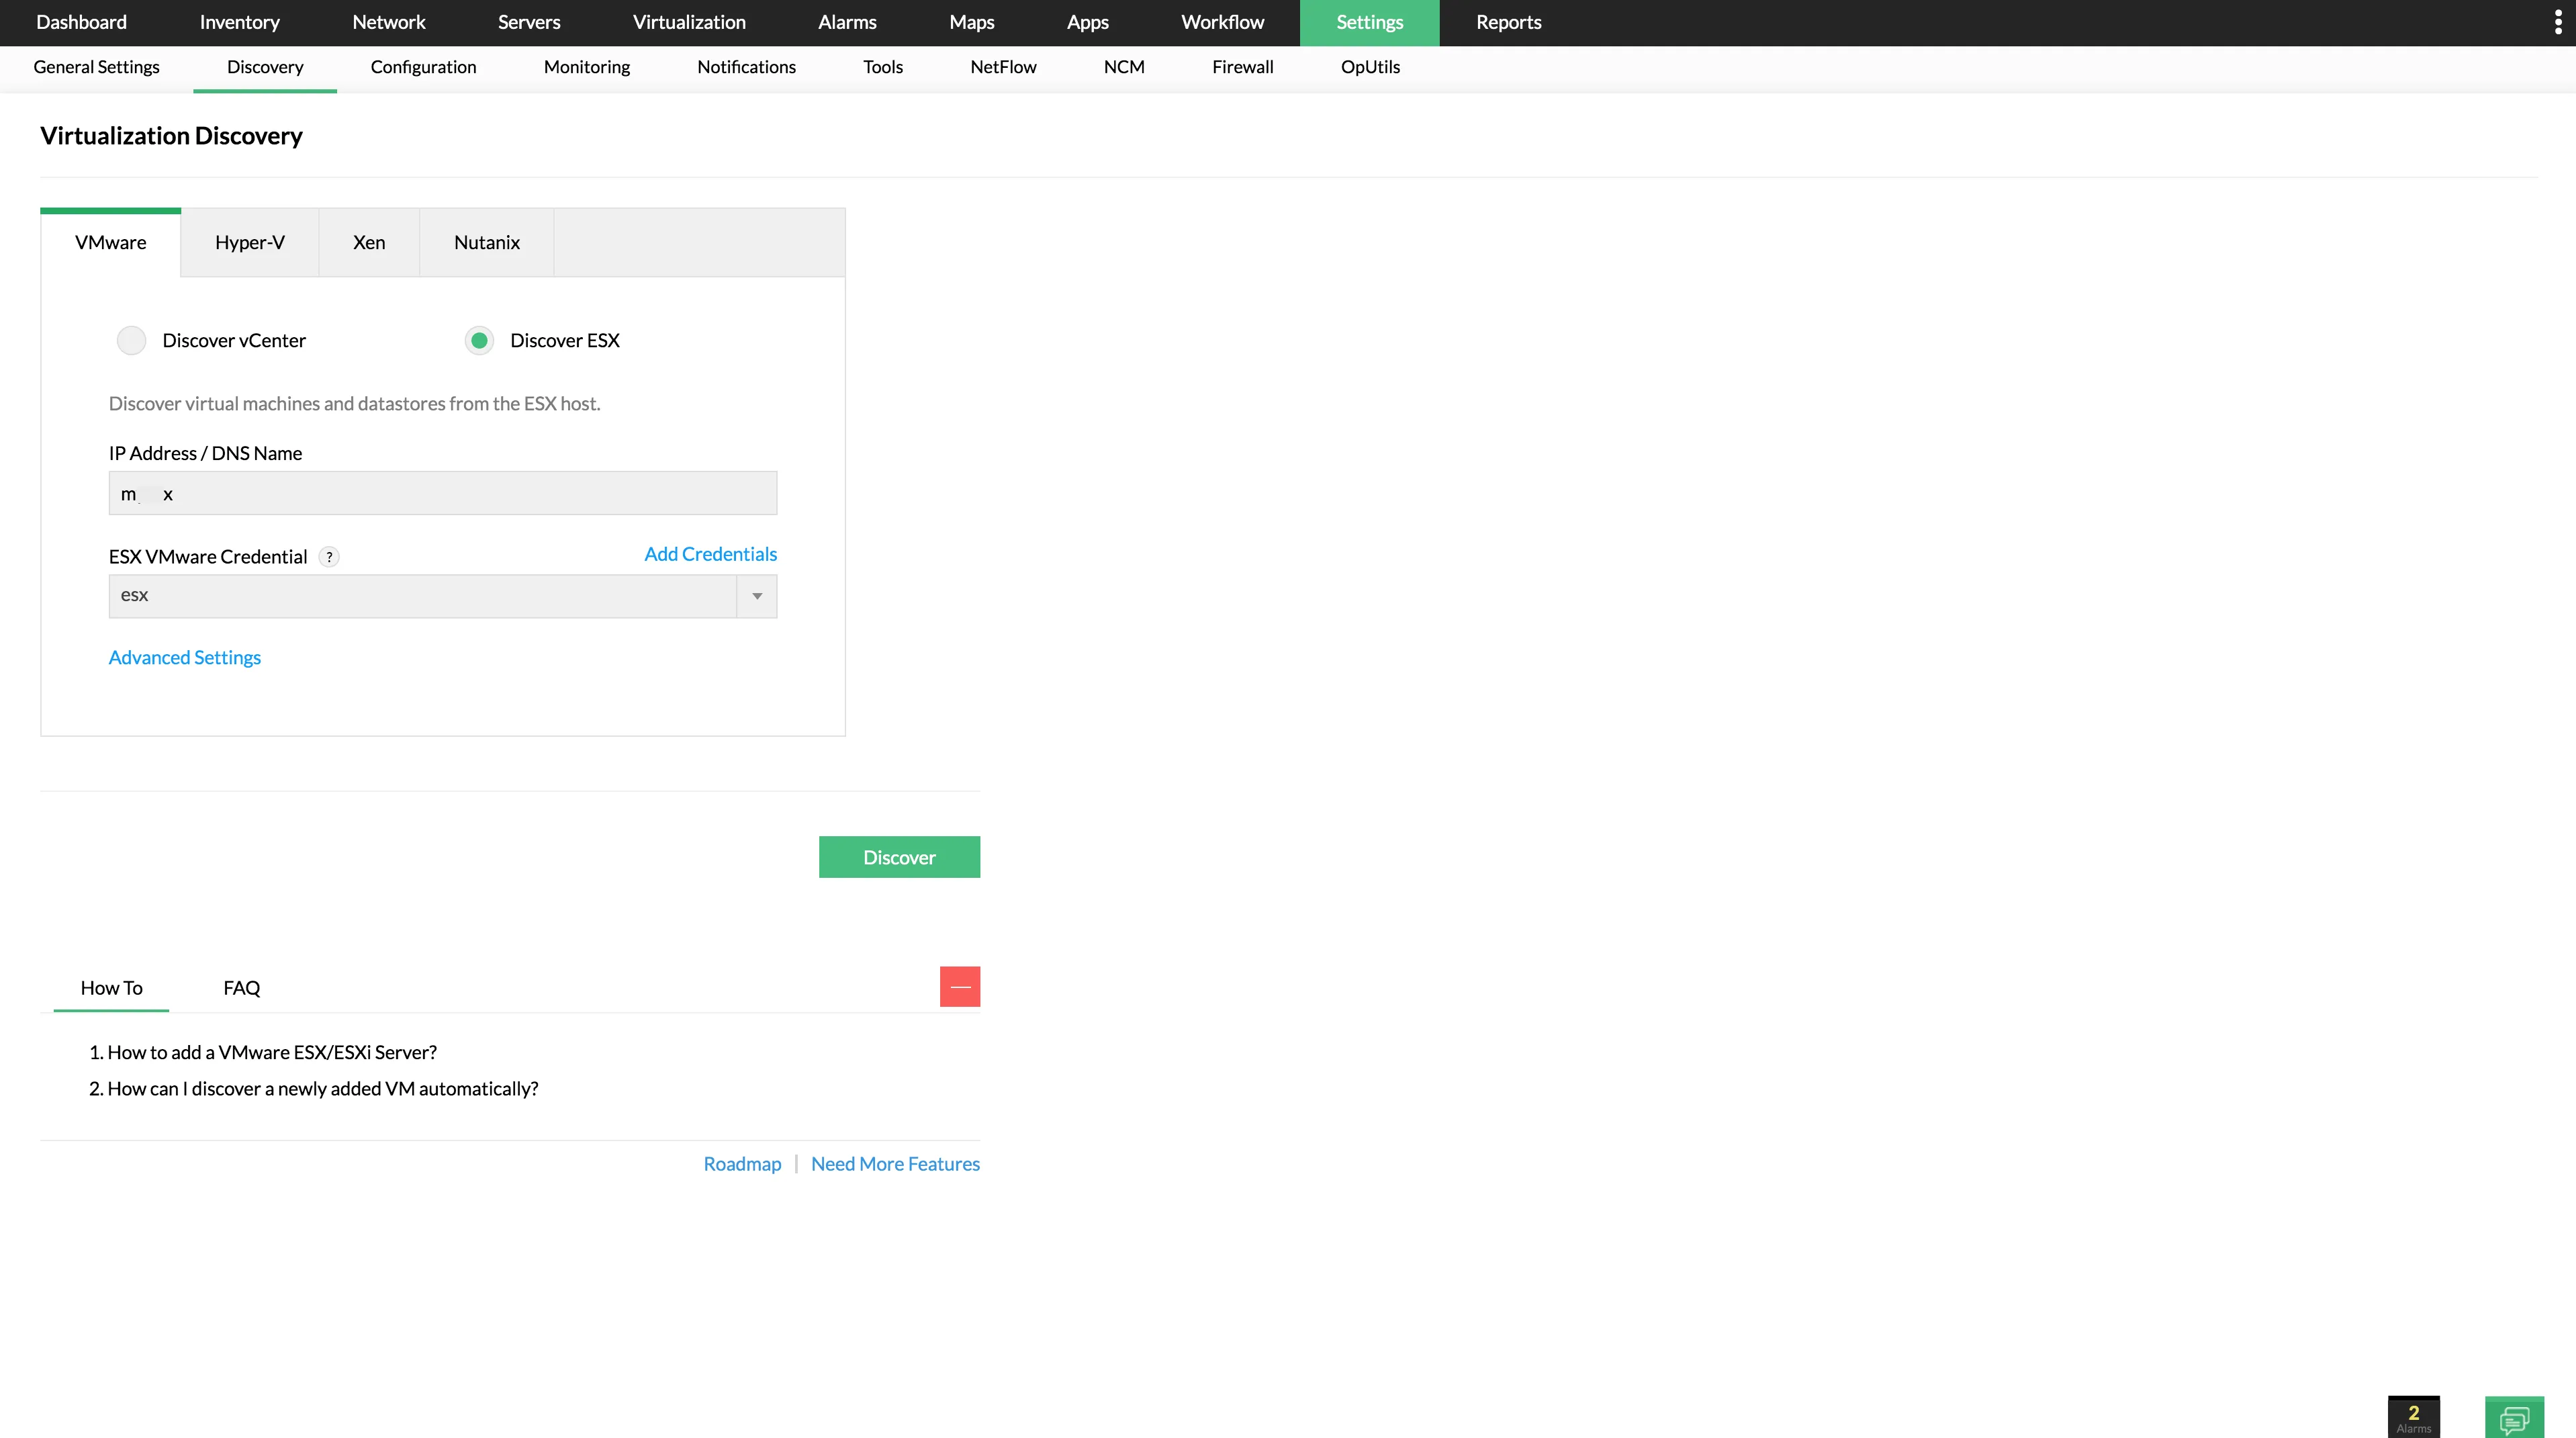
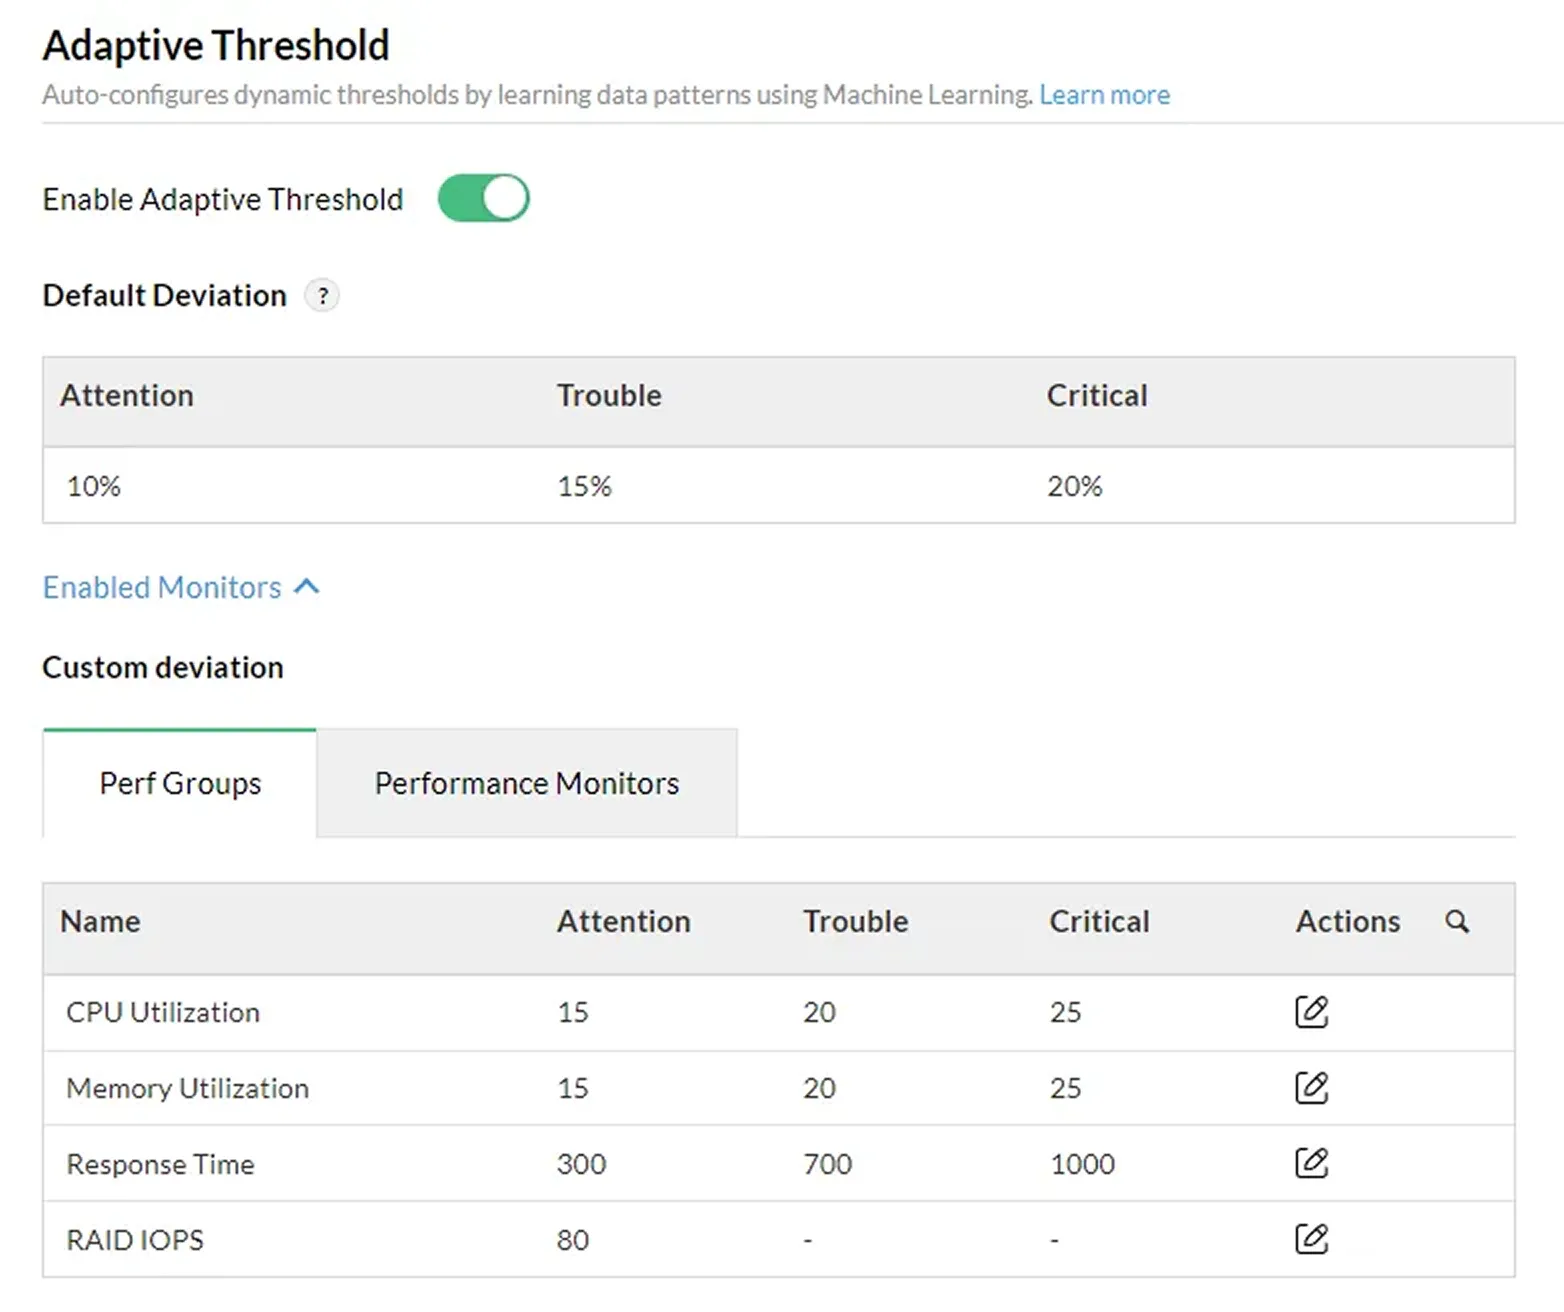
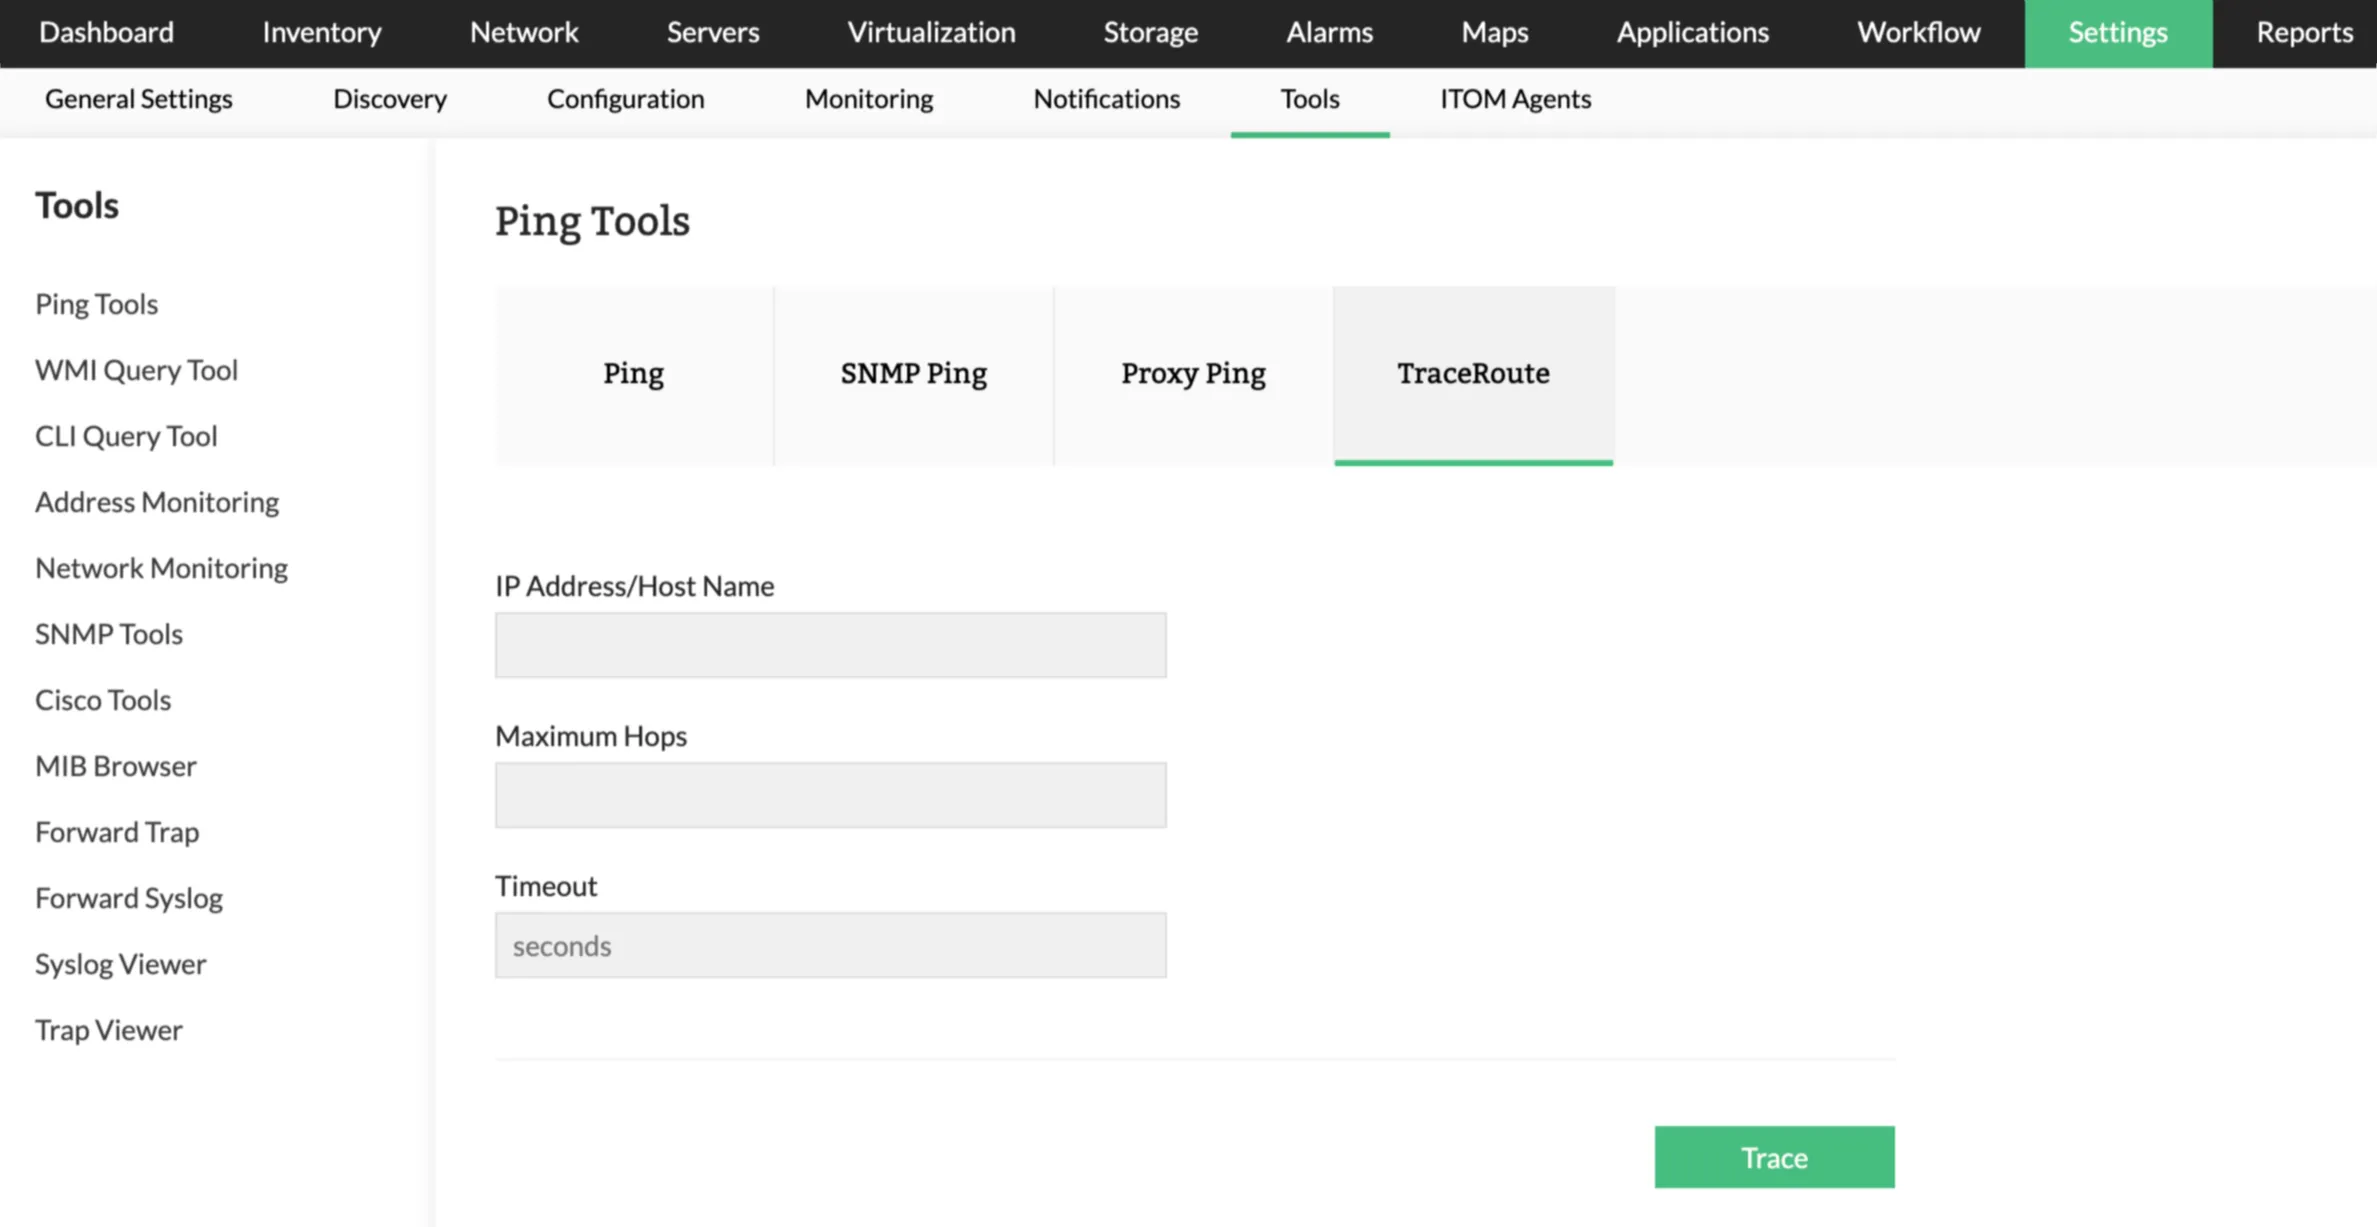
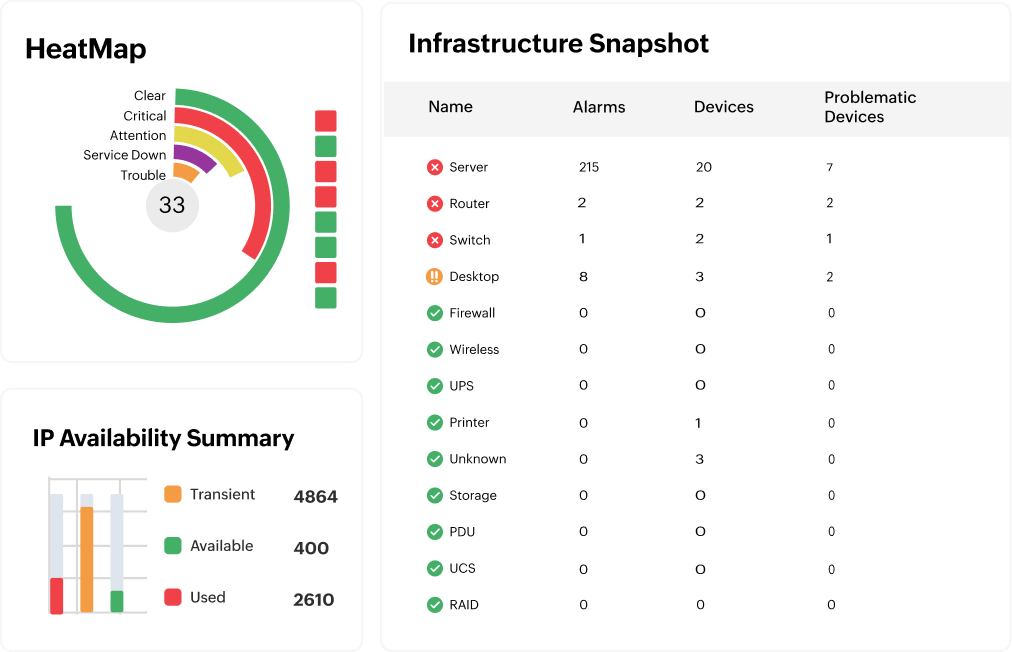
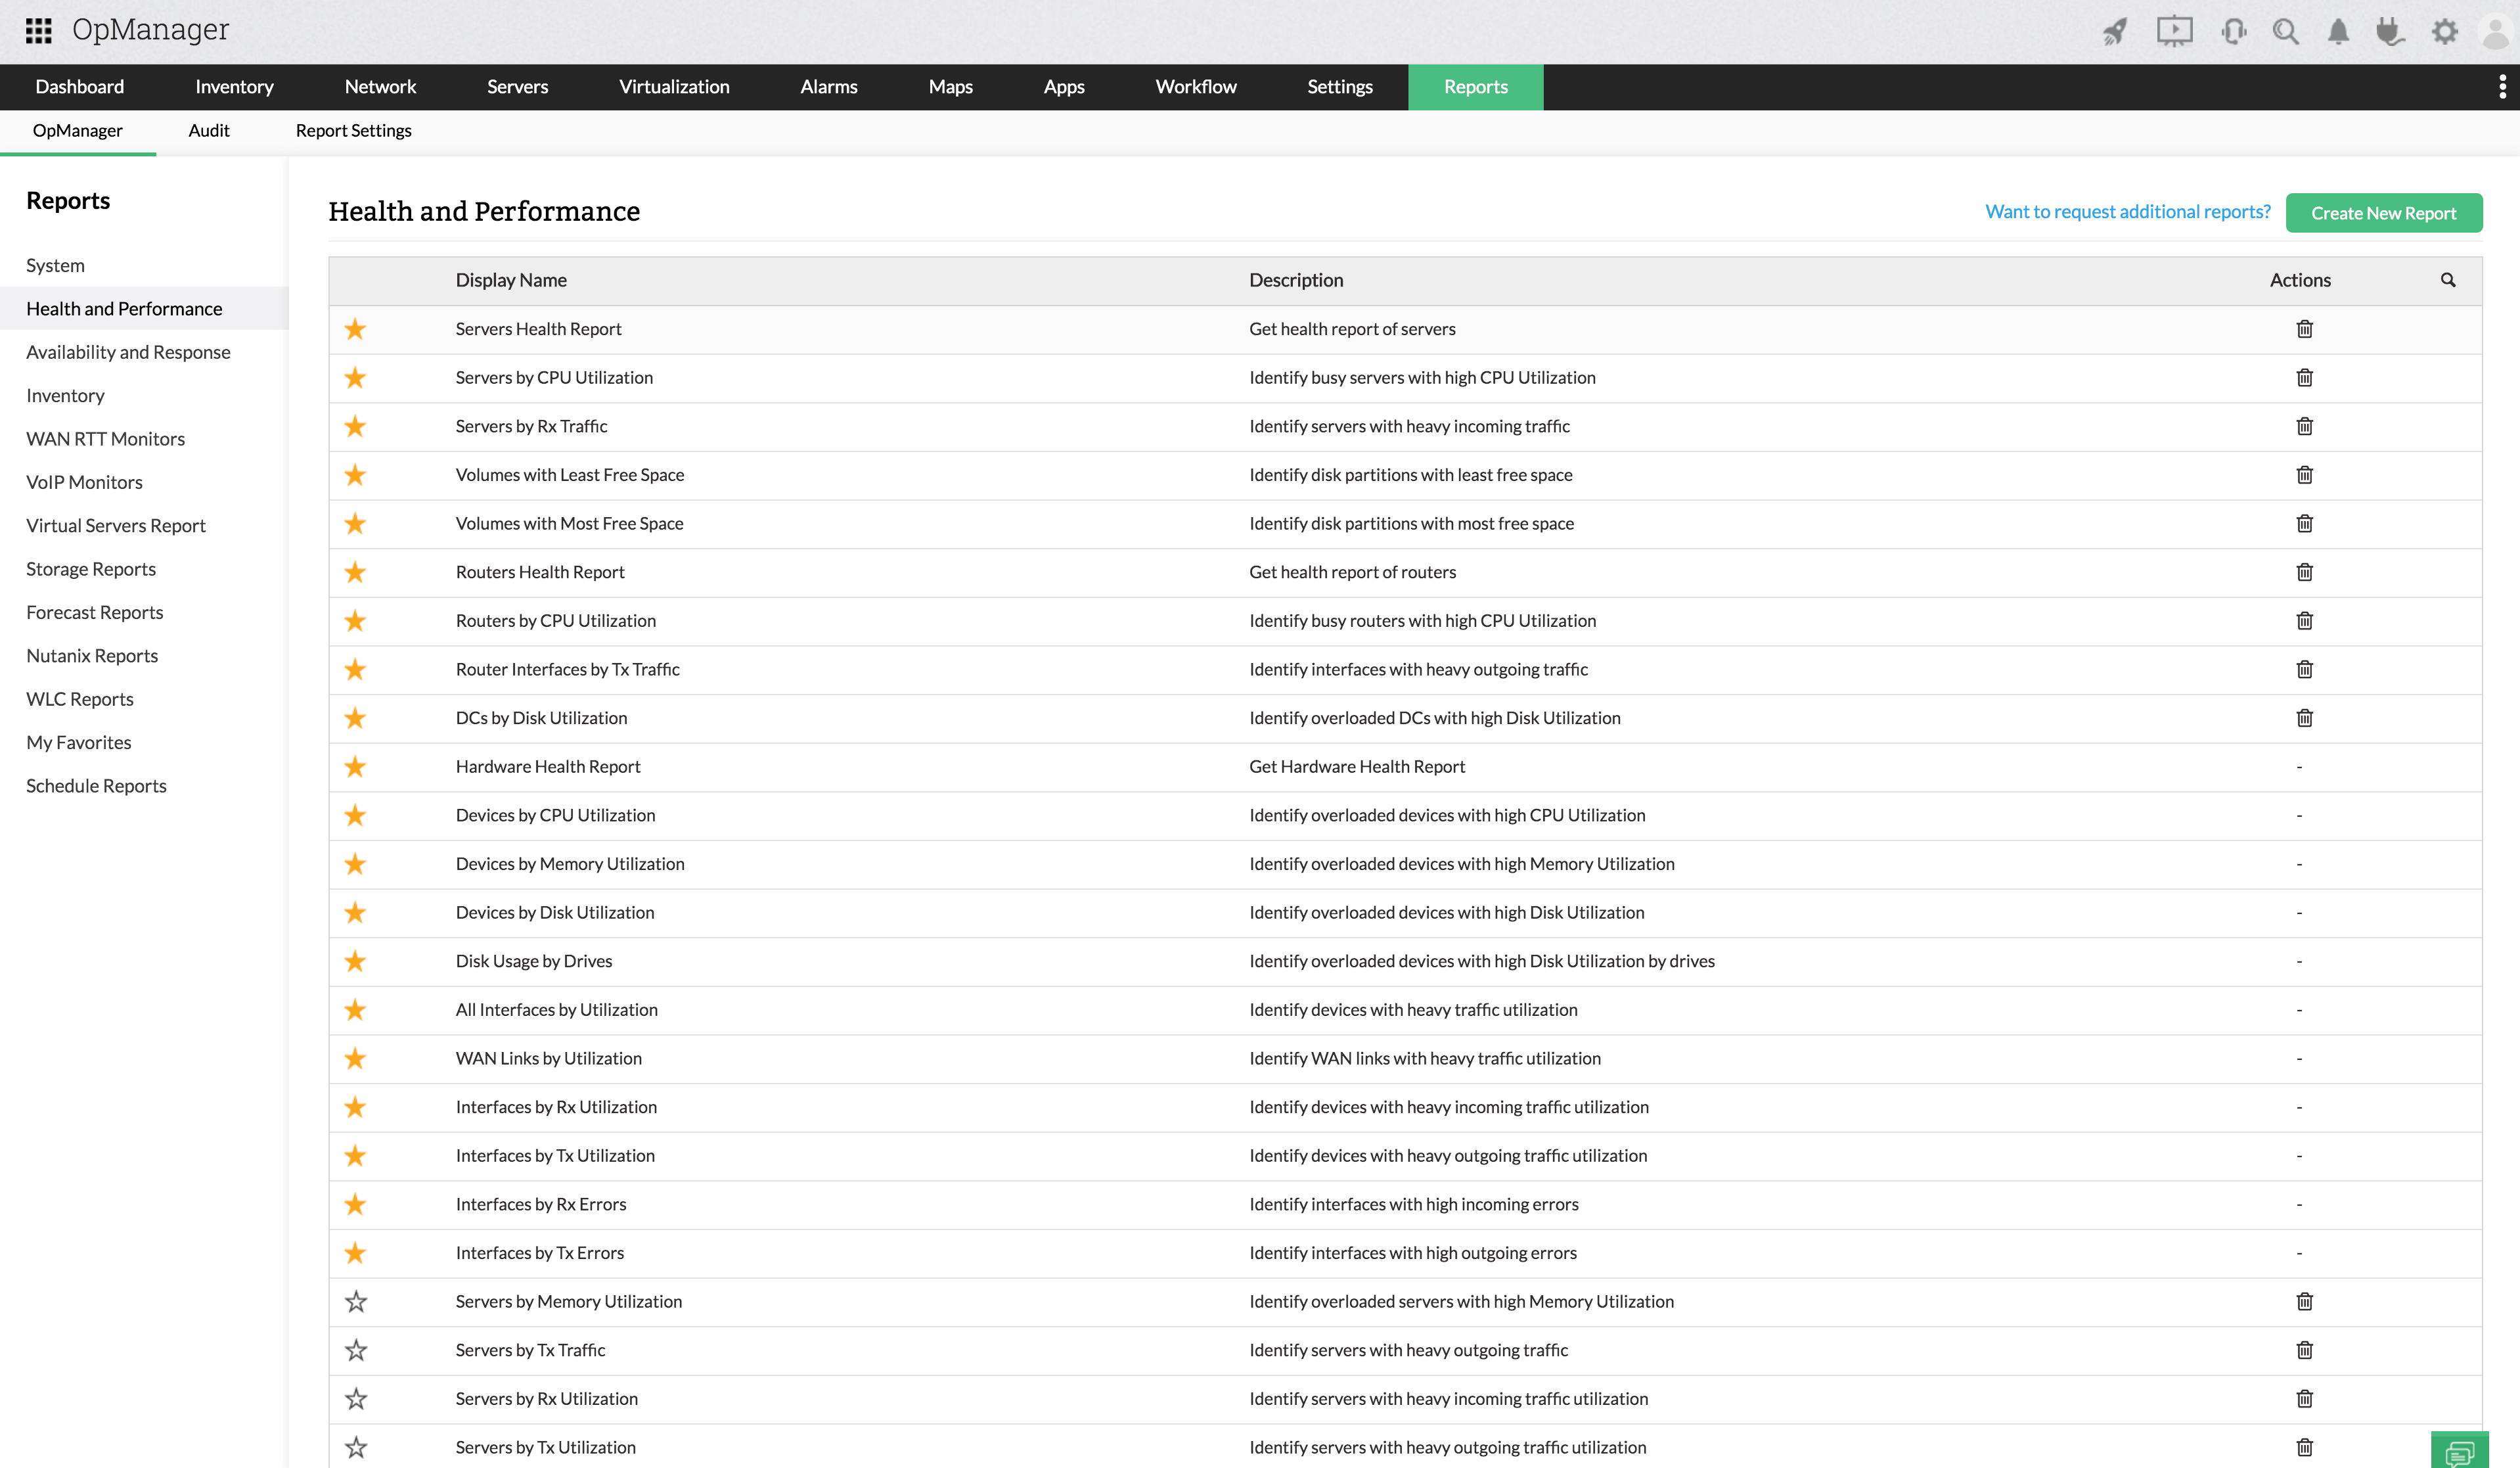
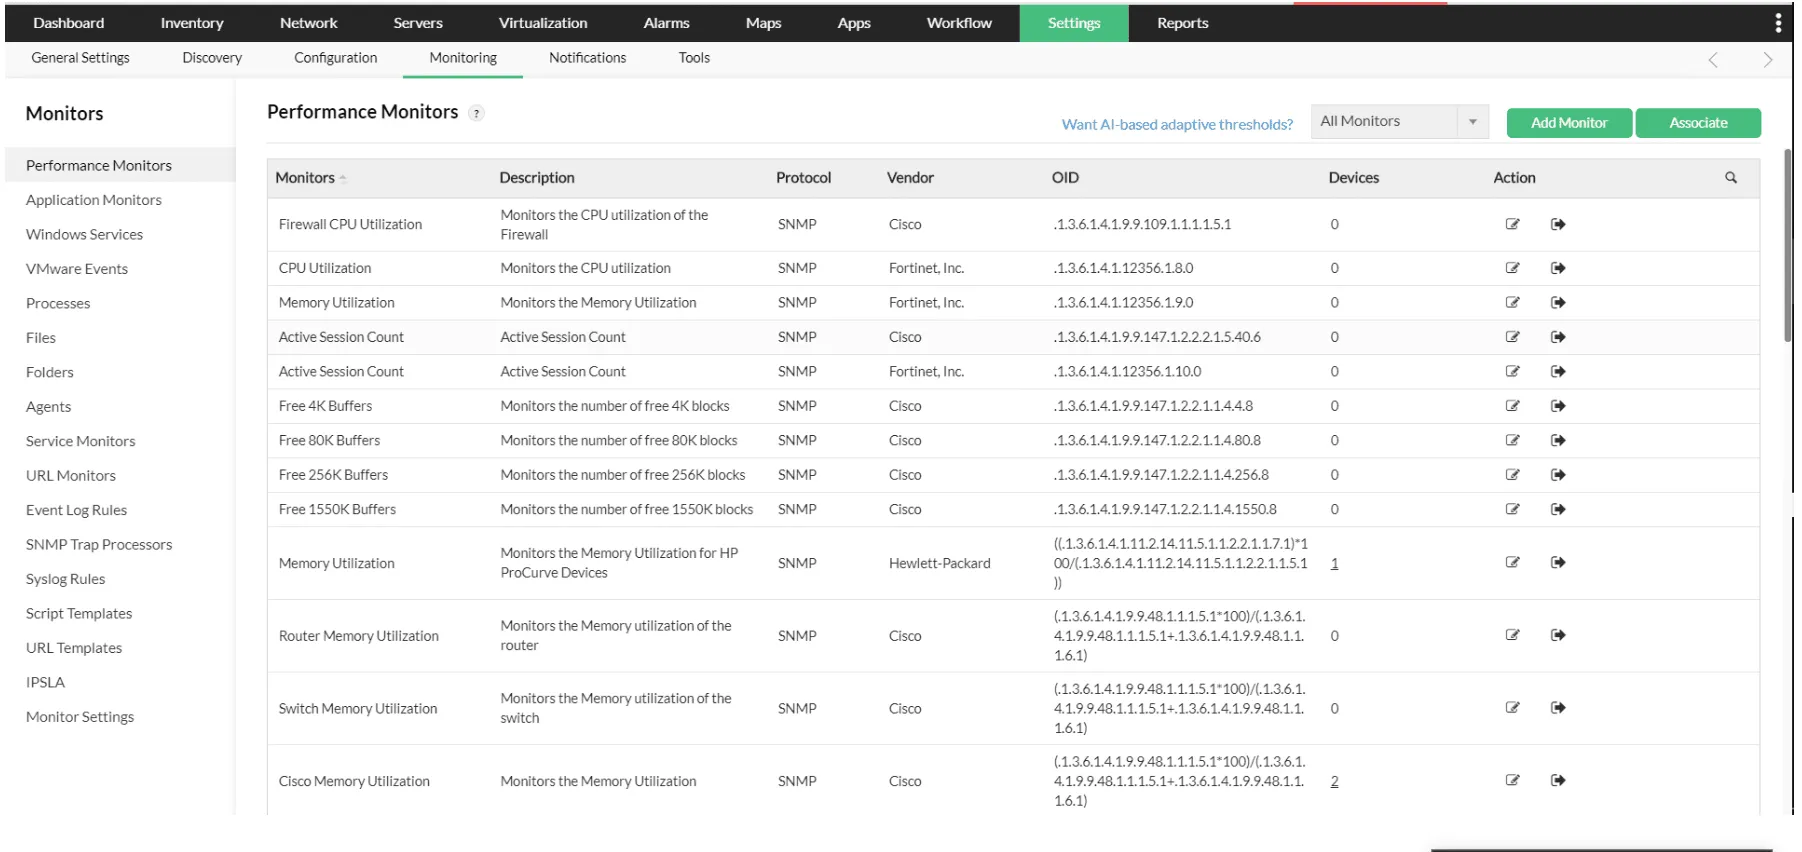
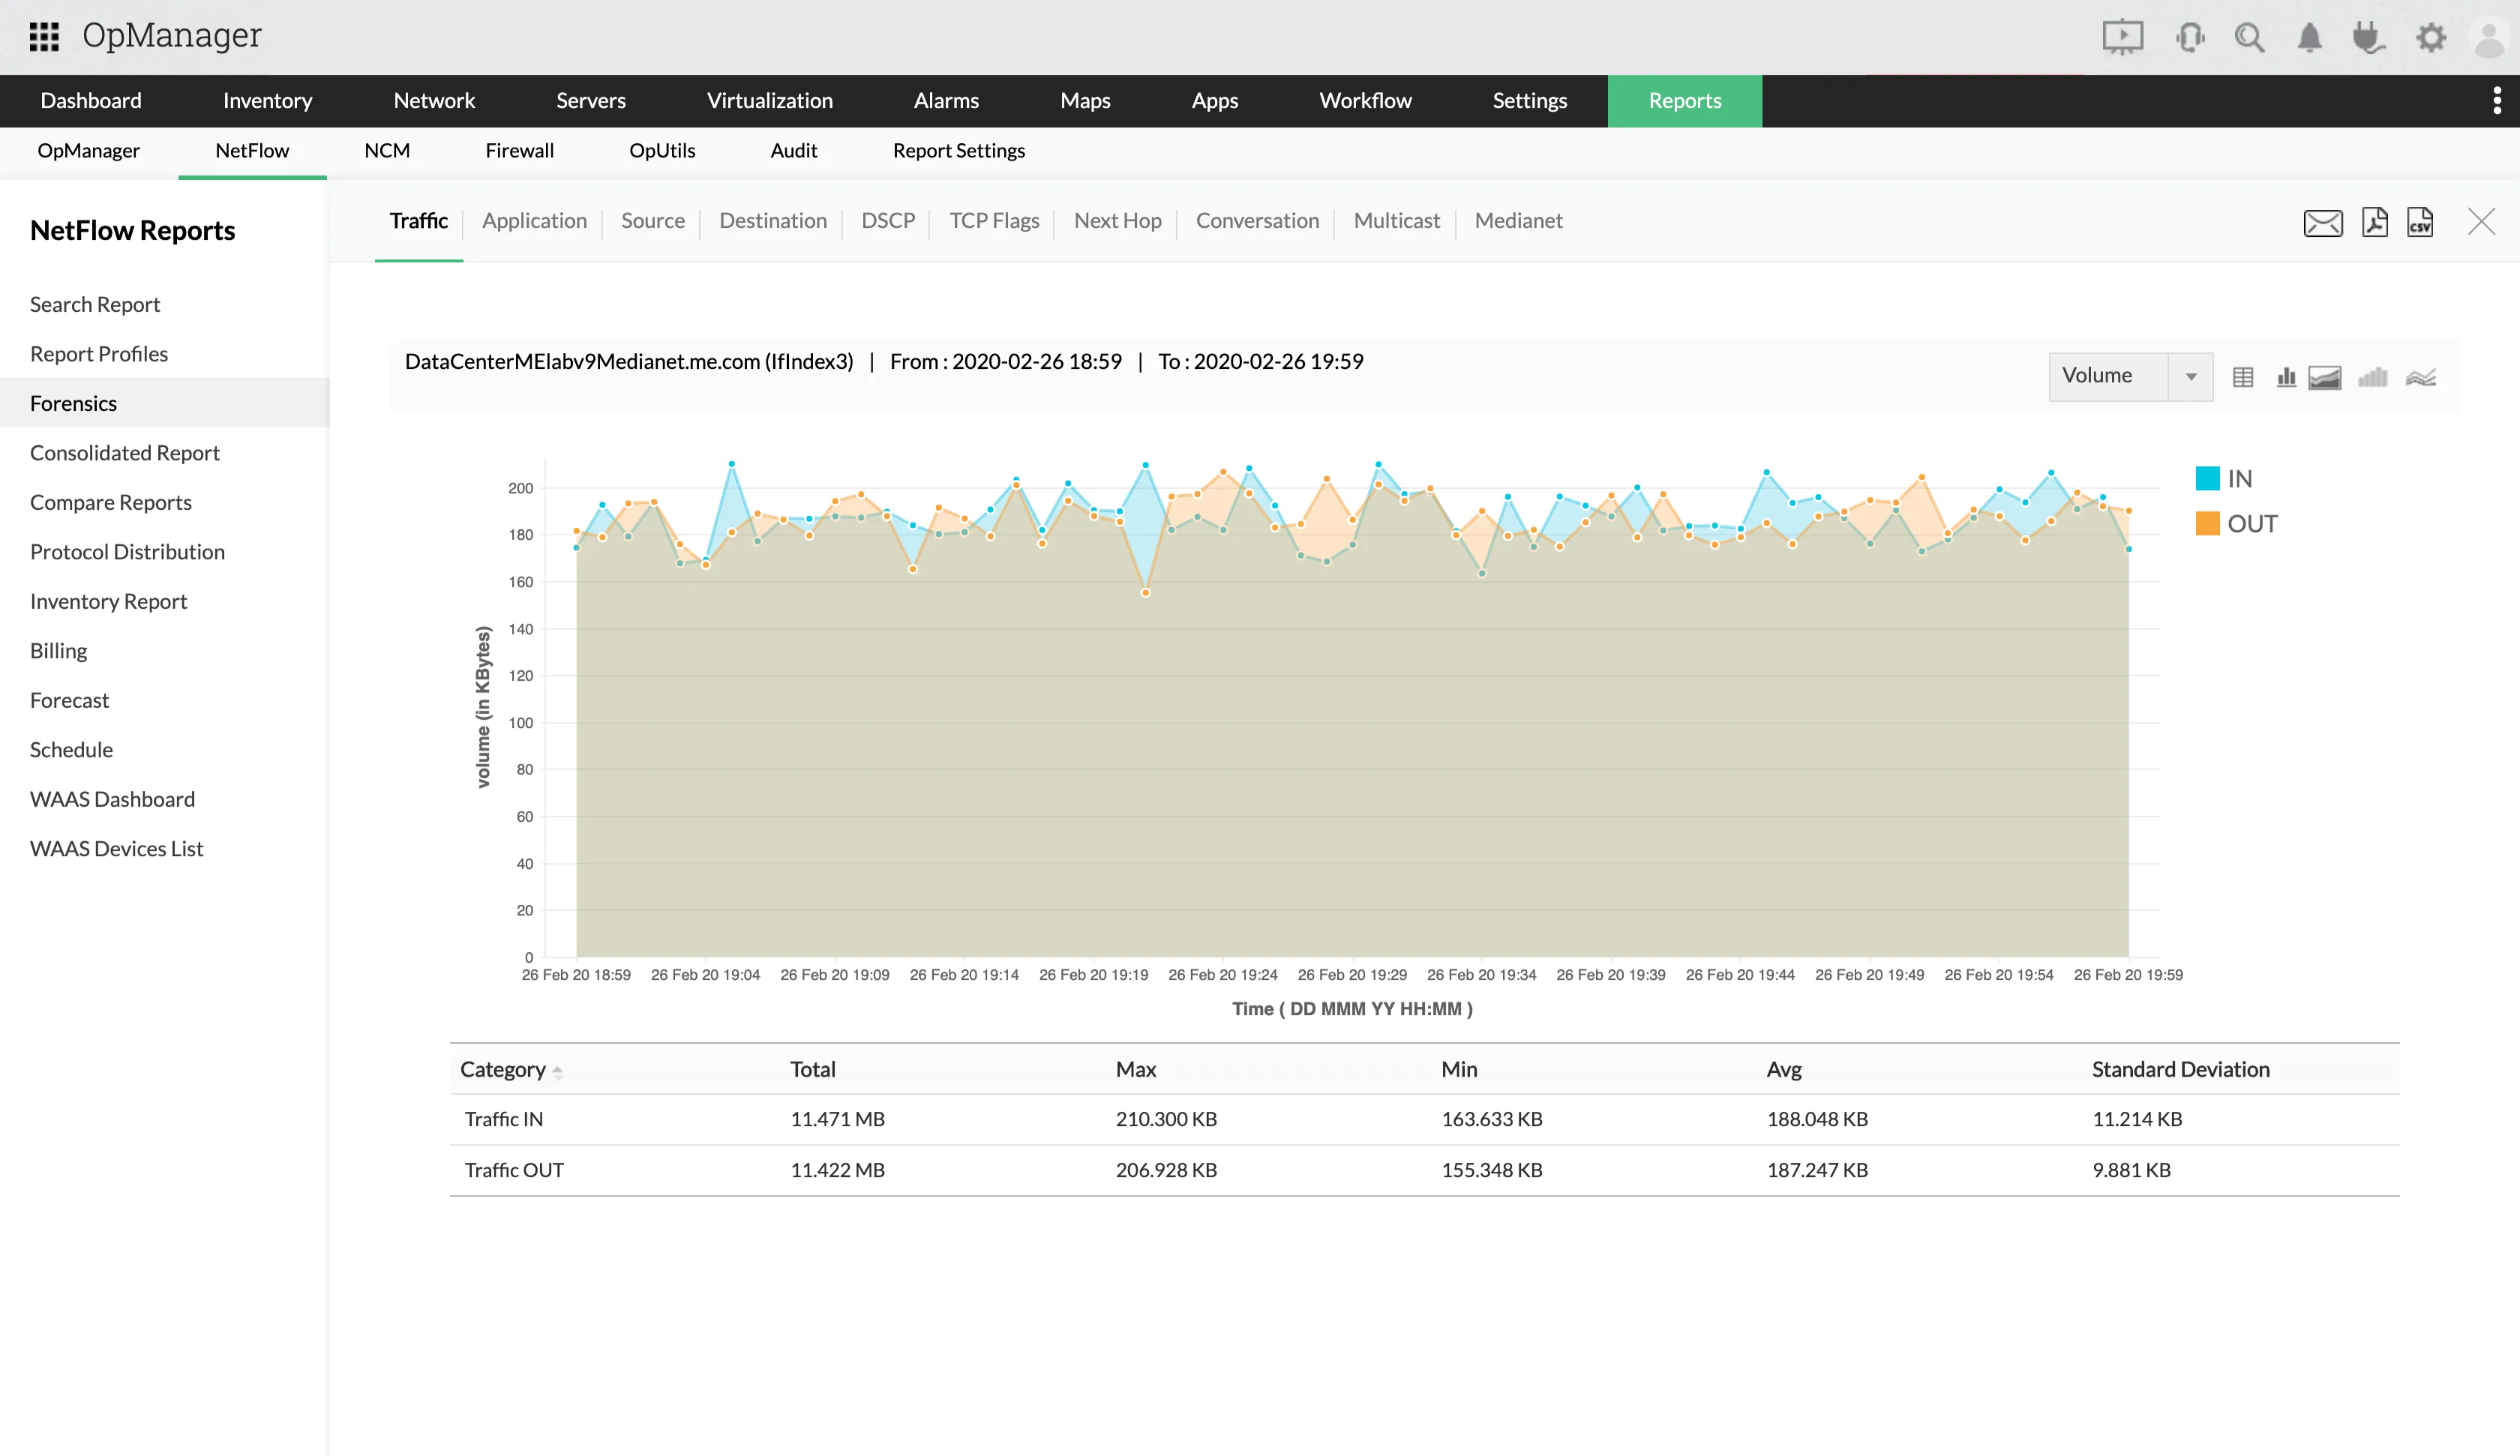
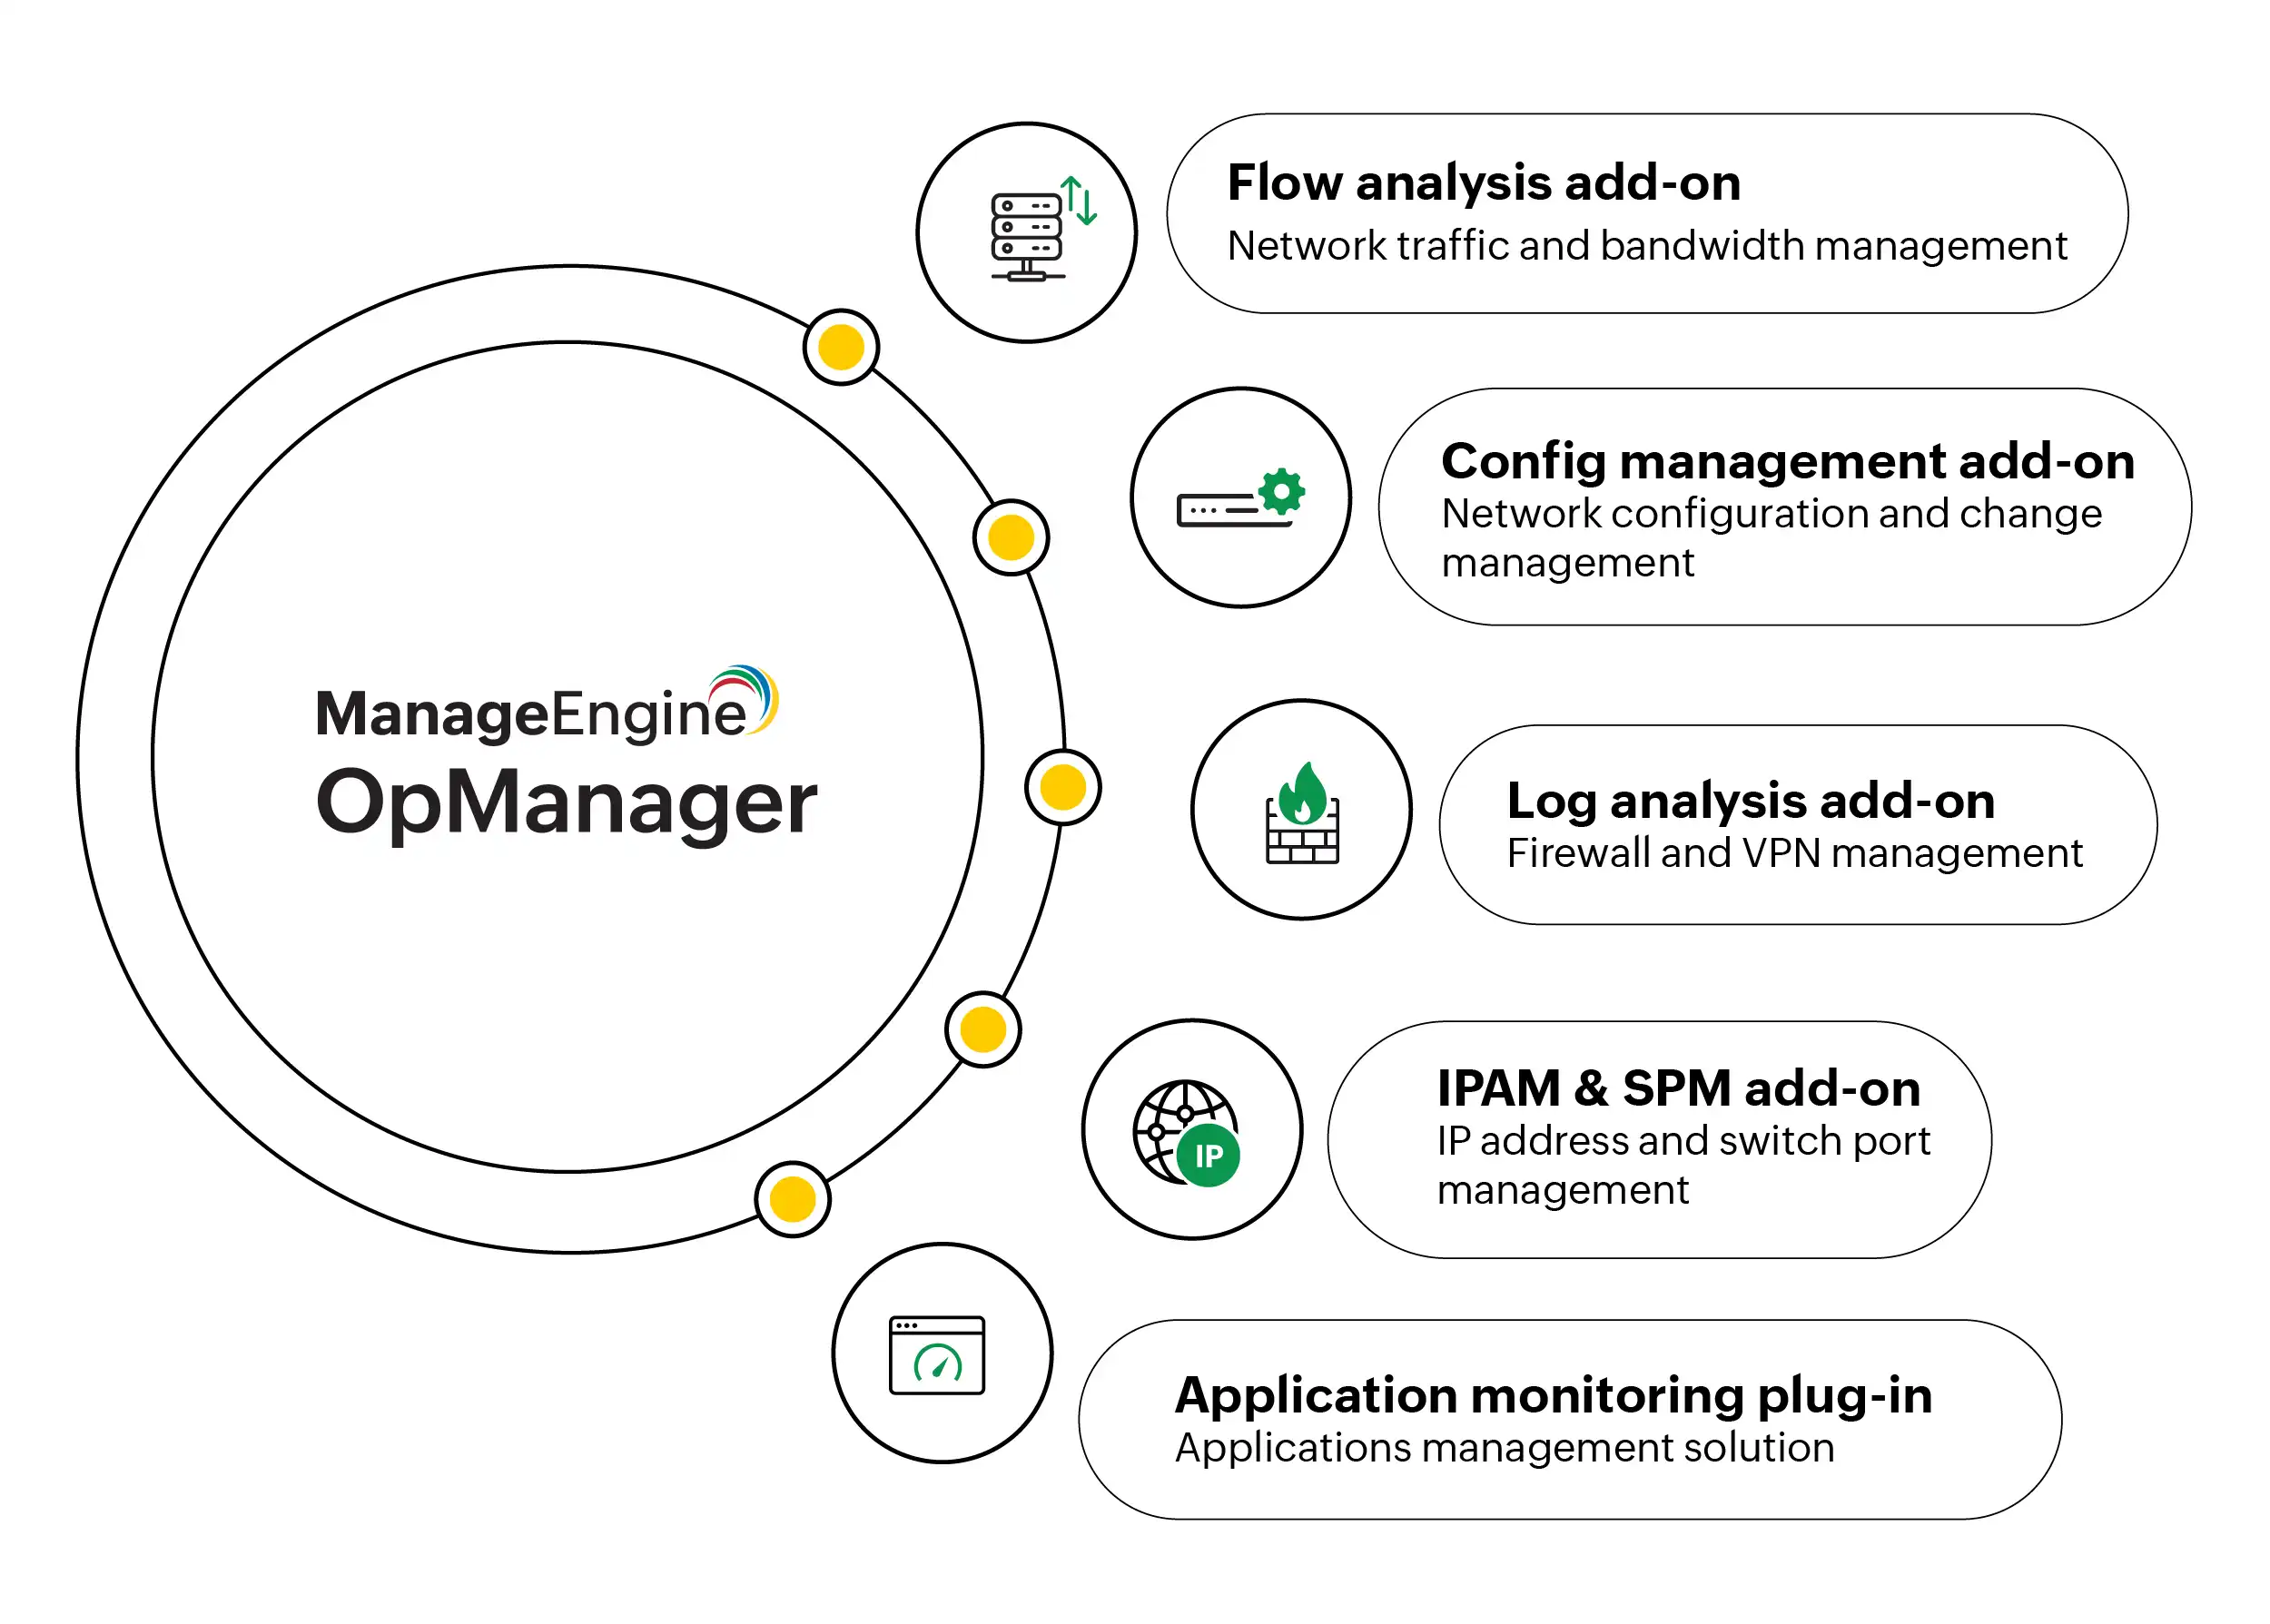
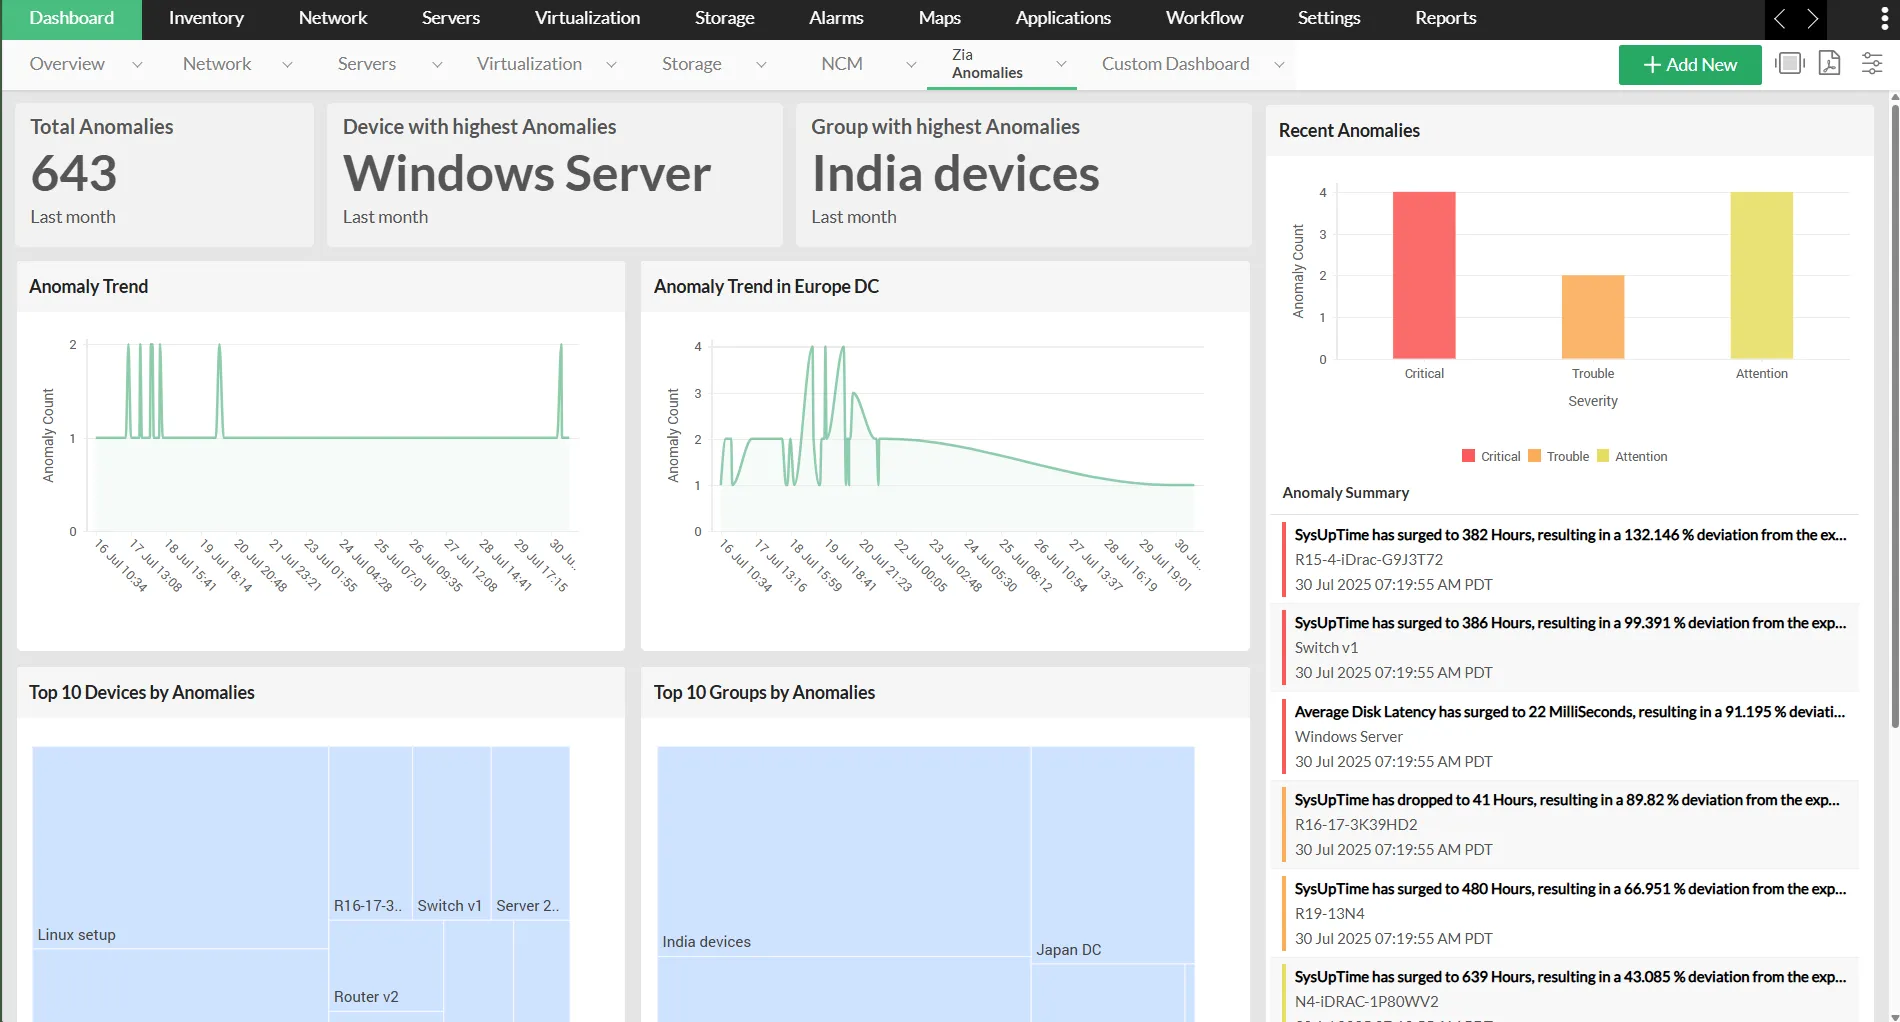
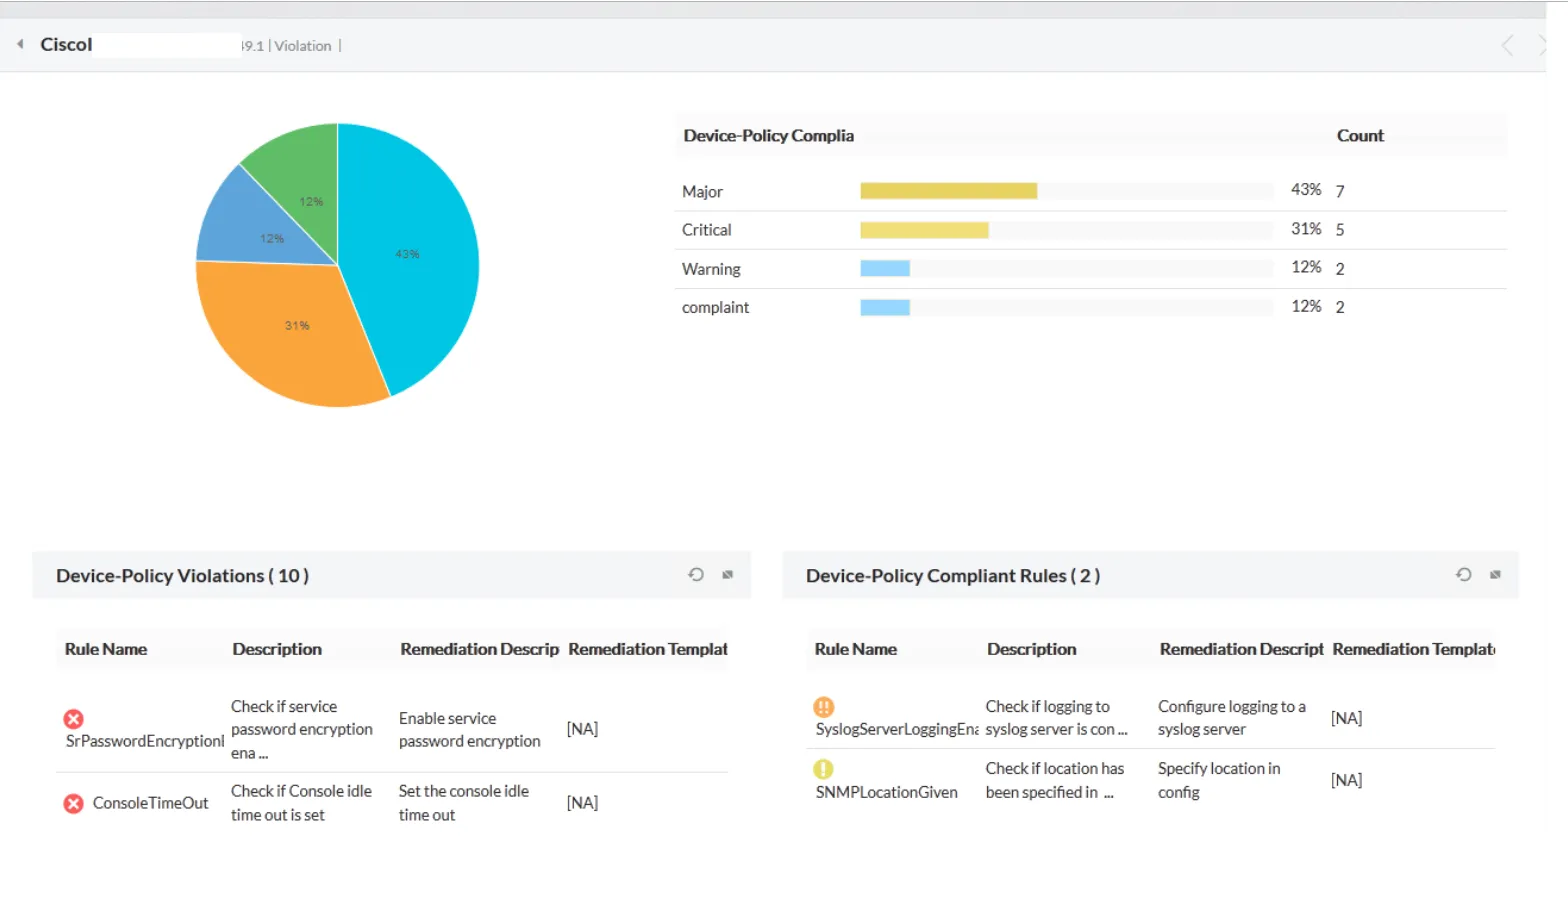
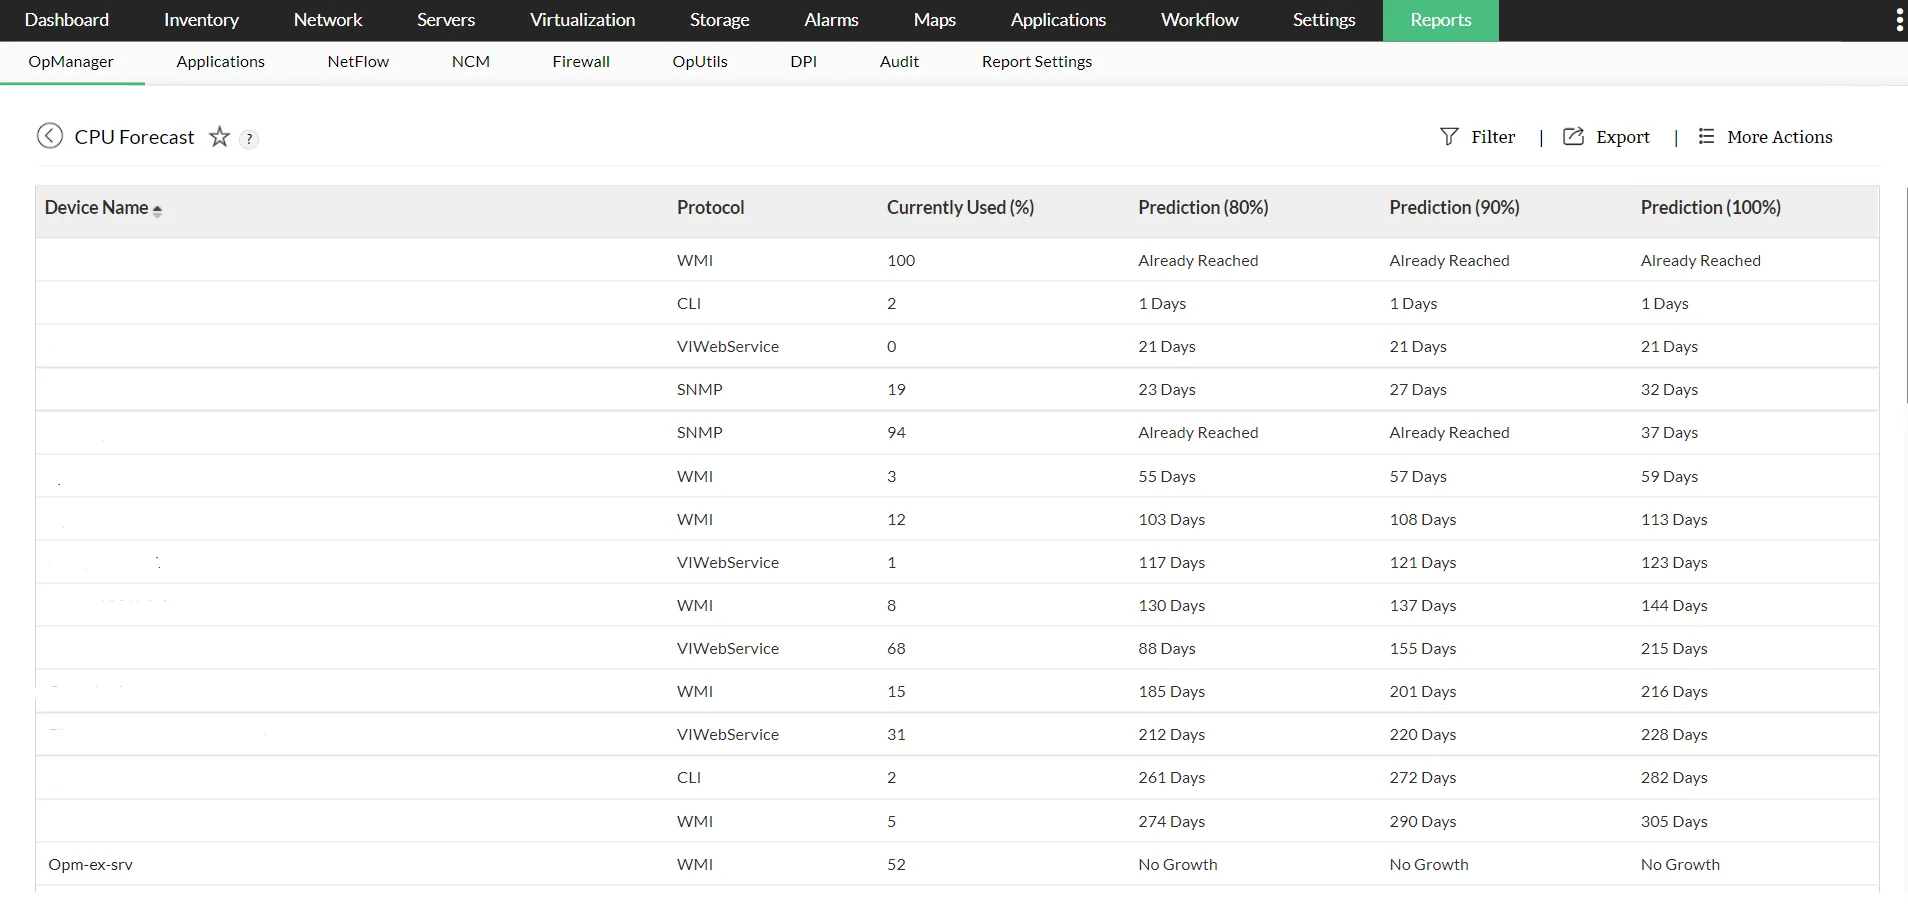
Integrated monitoring platform without Plugin overhead

OpManager eliminates the complexity of managing plugins and auxiliary tools by offering a fully integrated monitoring suite from day one. Automatic discovery, topology maps, flow analytics, configuration management, and rich visual dashboards all work natively in a single console, unlike Nagios XI's plugin-centric approach that requires ongoing maintenance and additional components to achieve similar depth.

Pricing

Flexible licensing for OpEx or CapEx alignment

While Nagios XI locks customers into a perpetual-only structure, OpManager provides the freedom to choose between subscription or perpetual models. This flexibility makes it easier for organizations to align monitoring investments with OpEx or CapEx preferences, scale more fluidly, and adapt procurement as their infrastructure grows or modernizes.

Full-stack

Transparent, device-based pricing with fixed AMS

OpManager's device-based pricing avoids the cost creep commonly seen in node-based licensing, where every new host, VM, or monitored IP drives up the bill. With OpManager's clearly defined 20% AMS rate, customers benefit from consistent, transparent long-term costs, whereas Nagios XI renewals fluctuate based on node count and can escalate significantly as environments expand.

Choose a reliable alternative to Nagios XI

All-in-one monitoring that scales without licensing shocks

While Nagios XI may appear competitive initially, its long-term costs add up quickly. The Standard Edition for 100 nodes is priced at $2,495, with an annual AMS renewal of $2,062, nearly the cost of the license itself. OpManager offers a more cost-effective alternative with an AMS renewal of just $399. This significantly lower ongoing support cost, combined with built-in monitoring capabilities and reduced dependency on plugins, results in a substantially lower total cost of ownership. Over time, OpManager delivers better value, predictable costs, and a higher ROI compared to Nagios XI.

Features OpManager
(Standard Edition)
(Standard Edition)
Price
$1,995
(100 devices)
$2,495
(100 nodes)
AMS (Annual maintenance and support) $399 $2,062
Server monitoring (Windows/Linux)   Requires plugins/agents
Network infrastructure monitoring   Requires plugins/wizards
Advanced Interface monitoring   Requires plugins/wizards
Virtualization monitoring   Requires plugins/wizards
Automated network topology mapping    
Email support Unlimited Only 10 cases/year
Licensing Subscription & Perpetual Perpetual only

Feature-rich Nagios XI Alternative

Infrastructure
Automation
Visibility
Integrations
Analytics

Broad device coverage without dependency on add-ons

OpManager monitors servers, routers, switches, wireless controllers, and virtual environments with built-in profiles. Nagios XI covers core devices, but deeper insights for many device families require plugins or custom checks.

Broad device coverage without dependency on add-ons
Automated discovery with accurate topology mapping

Automated discovery with accurate topology mapping

OpManager automatically discovers devices and builds L2 connectivity maps and topology diagrams. Nagios XI supports topology views, but richer visual layers often involve plugins or manual configuration.

End-to-end virtualization insights with minimal setup

OpManager provides ready-to-use templates for VMware, Hyper-V, and Citrix monitoring, enabling complete visibility with little manual work. Nagios XI supports these platforms, but full insight typically requires configuration wizards or additional setup.

End-to-end virtualization insights with minimal setup

Faster onboarding with intelligent monitoring templates

OpManager automatically applies device templates and thresholds for rapid deployment. Nagios XI offers setup wizards, but deeper profiling frequently depends on plugins or custom checks.

Faster onboarding with intelligent monitoring templates
Smart thresholding that cuts down false alerts

Smart thresholding that cuts down false alerts

OpManager leverages dynamic baselining and anomaly cues to deliver cleaner, more meaningful alerts. Nagios XI supports alerting, but advanced behavioral analytics often require scripts or add-ons.

Integrated diagnostic tools that accelerate troubleshooting

OpManager consolidates ping, traceroute, SNMP tools, syslog, traps, and more into a unified console. Nagios XI provides basic diagnostics, but extended capabilities often rely on external utilities or plugins.

Integrated diagnostic tools that accelerate troubleshooting

Visual layers that make issues easier to pinpoint

OpManager offers NOC views, heatmaps, L2 maps, and 3D rack visualizations for rapid fault identification. Nagios XI includes dashboards, but advanced visual layers are typically plugin-driven.

Visual layers that make issues easier to pinpoint
Comprehensive reports that support audits and planning

Comprehensive reports that support audits and planning

With 100+ built-in reports covering SLA, capacity, forecasts, bandwidth, and anomalies, OpManager simplifies audit readiness. Nagios XI provides performance graphs and basic capacity reports, with broader reporting relying on plugins or customization.

High-granularity metrics for deeper performance analysis

Seamless ITSM integrations that speed up resolution

OpManager integrates directly with ServiceDesk Plus, Jira, ServiceNow, Slack, and Teams. Nagios XI supports integrations, but many require plugins or scripting.

Seamless ITSM integrations that speed up resolution

Built-in traffic analytics for real-time bandwidth insights

OpManager includes NetFlow-based traffic analysis within the same console. Nagios XI requires a separate product, Nagios Network Analyzer, for comparable visibility.

Unified management suite that reduces operational complexity

OpManager connects with NCM, NetFlow Analyzer, APM, and Firewall Analyzer as part of one ecosystem. Nagios XI requires multiple separate products and community plugins to match similar capabilities.

Unified management suite that reduces operational complexity

AI-driven anomaly detection for proactive fault prevention

OpManager baselines performance behavior and flags deviations using ML. Nagios XI does not seem to have native AIOps or machine-learning analytics.

AI-driven anomaly detection for proactive fault prevention
Built-in configuration management that enhances compliance

Built-in configuration management that enhances compliance

OpManager's integrated NCM handles backups, versioning, compliance checks, and rollbacks. Nagios XI lacks native NCM capabilities.

Predictive forecasting to plan capacity with confidence

OpManager provides forecasting for CPU, memory, disk, bandwidth, and device growth. Nagios XI includes basic capacity graphs but lacks multi-metric or ML-driven forecasting.

Predictive forecasting to plan capacity with confidence

Switch from Nagios XI to OpManager with a guided evaluation

If you're searching for alternatives to Nagios XI, you can try a free guided OpManager evaluation with ManageEngine's dedicated product experts. By registering for a free evaluation, you can use a fully functional and personalized OpManager installation for 30 days, get tailored custom quotes, and schedule one-to-one sessions with our team!

Get started with OpManager!

Register for a free product evaluation by filling this form

1

Evaluate

Start off with a fully functional product trial to evaluate OpManager

2

Calculate ROI

Get detailed pricing and licensing information for your requirements

3

Schedule a POC demo

Talk to our product experts one-on-one to choose the plan that suits you best!

Enter name Enter name
Enter a valid business email address Enter your business email address
Enter phone number Enter phone number name

OpManager, in a minute-and-a-half

Eliminate network bottlenecks and minimize unplanned downtime with an all-in-one monitoring console. OpManager's historic, real-time, and predictive insights can help you improve performance across your network, server, and storage systems.

OpManager, in a minute-and-a-half

ManageEngine OpManager: Adored by customers and review platforms

Brian Law
 

OpManager is the eyes and the ears of our network. Not just during the day, but 24x7x365.

Brian Law

FP McCann, United Kingdom

Rohan Manuel
 

OpManager meant that my work-life balance was possible... I get real-time proactive data anytime, anywhere.

Rohan Manuel

Work Healthy Australia, Australia

Wayne Innis
 

OpManager is a single pane of glass to review, troubleshoot, and diagnose any problem.

Wayne Innis

Qarbon Aerospace, United States

I have been working with OpManager for a long, and I have also worked with other platforms like Datadog, so I came to the conclusion that its stability, reliability, simplicity, and scalability features set it apart from the competition. It's a game-changer, and I also adore it because it is suitable both for big and small firms.

Stephanie M

Finance, via Info-tech reviews

What I like most about ManageEngine is the customization capabilities... I like the way it integrates with other solutions and components.

Steven Soriano

Detroit Wayne Integrated Health Services, United States


  4.7/5
  4.5/5
  4.4/5
  9.1/10
  4.7/5
  4.6/5

Shift to a better, more reliable network monitoring experience

Disclaimer:

This page highlights ManageEngine OpManager as an alternative to Nagios XI. This page is compiled from the information available on Nagios XI's website. We have made every attempt to ensure the accuracy and reliability of the information provided. However, the information is provided "as is" without warranty of any kind. ManageEngine is not liable for any inaccuracies in the page due to changes made on Nagios XI's website or any development made to Nagios XI's product subsequent to the date of publication of this page. Please refer Nagios XI's website for more information.

 
 Pricing  Get Quote