Slow Applications Despite Frequent Bandwidth Upgrades?
In most IT departments, there rarely is a sole individual in-charge of application performance; Network managers, database managers, server managers, and even application programmers are collectively held responsible for poor end-user experience. As a Network Manager, are you just monitoring traffic and throwing additional bandwidth at every application performance problem? In the application blame game, do you get the feeling of being most picked - be it for poor application response or for increased IT expenditure? It is time you combined network and bandwidth monitoring to effectively & judiciously confront performance bottlenecks.
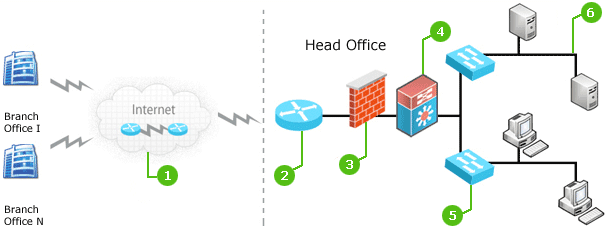
Here we take a look at six frequent networks problems not visualized in commonly available bandwidth monitoring tools. We use OpManager to visualize the problem causes/symptoms.
Six Things Your Bandwidth Tool Won't Tell You
|
|
Unexplained inter-network delays - Zero Visibility over WAN Links

Since you have neither control nor visibility over your WAN links subscribed from ISPs, you can never guarantee always-optimal network speeds. It is important to have visibility over every WAN link that has your traffic flowing through, so as to pin down performance bottlenecks. OpManager, by leveraging Cisco's powerful IP SLA technology, helps visualize WAN links providing hop-charts and reports on WAN link availability and latency at each traffic hop. You can spot outages & huge latency and then, in collaboration with your ISPs, quickly avoid costly degradation/downtime.
Poor Router Performance - Configuration changes, bug in IOS

As simple an incident as a flawed configuration change or a minor bug in the router's IOS can result in drastic increase in memory, causing slow routing of traffic across your links. OpManager constantly monitors CPU utilization and memory status thus ensuring any such incidents are brought to light before causing bothersome network slowness. Monitoring router performance also helps in identifying over-stressed devices and facilitates management decisions on upgrades and capacity planning. OpManager’s network configuration management module – the NCM Add-on, also makes easy the administrator’s network device management tasks. You can check against recent configuration changes and revert to last known working settings if necessary.
Poor Firewall Performance - flawed /sub-optimal firewall rules

To regulate traffic and to protect against security threats, administrators enforce rules on edge devices like firewalls. At times, the rules are made complex enough to delay traffic flow and eventually cause excessive resource utilization. OpManager observes utilization trends and allows one to set alerts for abnormal firewall health. OpManager also supports out-of-the-box monitoring of active VPN session counts thus allowing identification of burdened firewalls. To make decisions even more conclusive, OpManager integrates with ManageEngine Firewall Analyzer, enabling notifications on used vs unused rules to help qualify established firewall rules.
LAN Traffic Loss, Slowness - Duplex mismatches, Excessive Errors and Discards

Interface errors and discards are commonly monitored parameters that provide insight into many end-user network complaints such as traffic loss. Apart from customizable threshold settings, OpManager has pre-configured thresholds for more than 200 supported interface types. Duplex mismatches are quickly detected before these can affect end-user applications, by setting up notification profiles for link errors and discards. OpManager’s network traffic analysis module – the NetFlow Add-on, also allows you to drill down on traffic type so as to get in–depth visibility into bandwidth consumption.
Poor Switch Performance - Excessive Backplane Utilization

A switch's backplane utilization lets you know how much of its maximum throughput is put to full use. Excessive backplane utilization on your switches can result in ports receiving too much of network traffic, further leading to slow applications and high packet loss and discards. It is important to monitor this parameter so as to determine how your switching infrastructure will scale to suit future needs. Using OpManager you can set a baseline value for backplane utilization and get alerted before your switch gets overloaded.
An Integrated Approach to Network, Systems & Applications Management
The above are just some of the ways of how sub-optimal networks and slow application access could arise. OpManager with the NetFlow and NCM addon help you to monitor and manage your WAN, LAN, servers, workstations, wireless endpoints, applications and more. OpManager provides complete visualization, availability & latency details of all your WAN links using Cisco's IP SLA technology and also monitors important health parameters such as CPU, memory utilization, temperature etc of your routers, switches, servers etc. With OpManager you can have a central console for your entire network, applications, servers & systems monitoring needs.
You know what they say about not investing in new network technology until you have squeezed the most of your existing network investment. ManageEngine brings that benefit to you with the integration of products in the ManageEngine suite. OpManager's integrated approach to monitoring the network, system and applications has benefited many customers ranging from Small to Big enterprises like Northrop Grumman Corporation, Liebert Corporation, ABN AMRO etc.