AppLogs Configuration
The AppLogs Configuration page in Applications Manager provides centralized control over how logs are collected, classified, and processed for analysis. From this page, you can configure log profiles, define log types, and manage global AppLogs settings.
Note: From v182400 onwards, Applications Manager offers the AppLogs Explorer, saved searches, and alerting on saved searches through the AppLog Query Monitor.
To access this page, navigate to the AppLogs tab, click Actions, and then click Configurations.
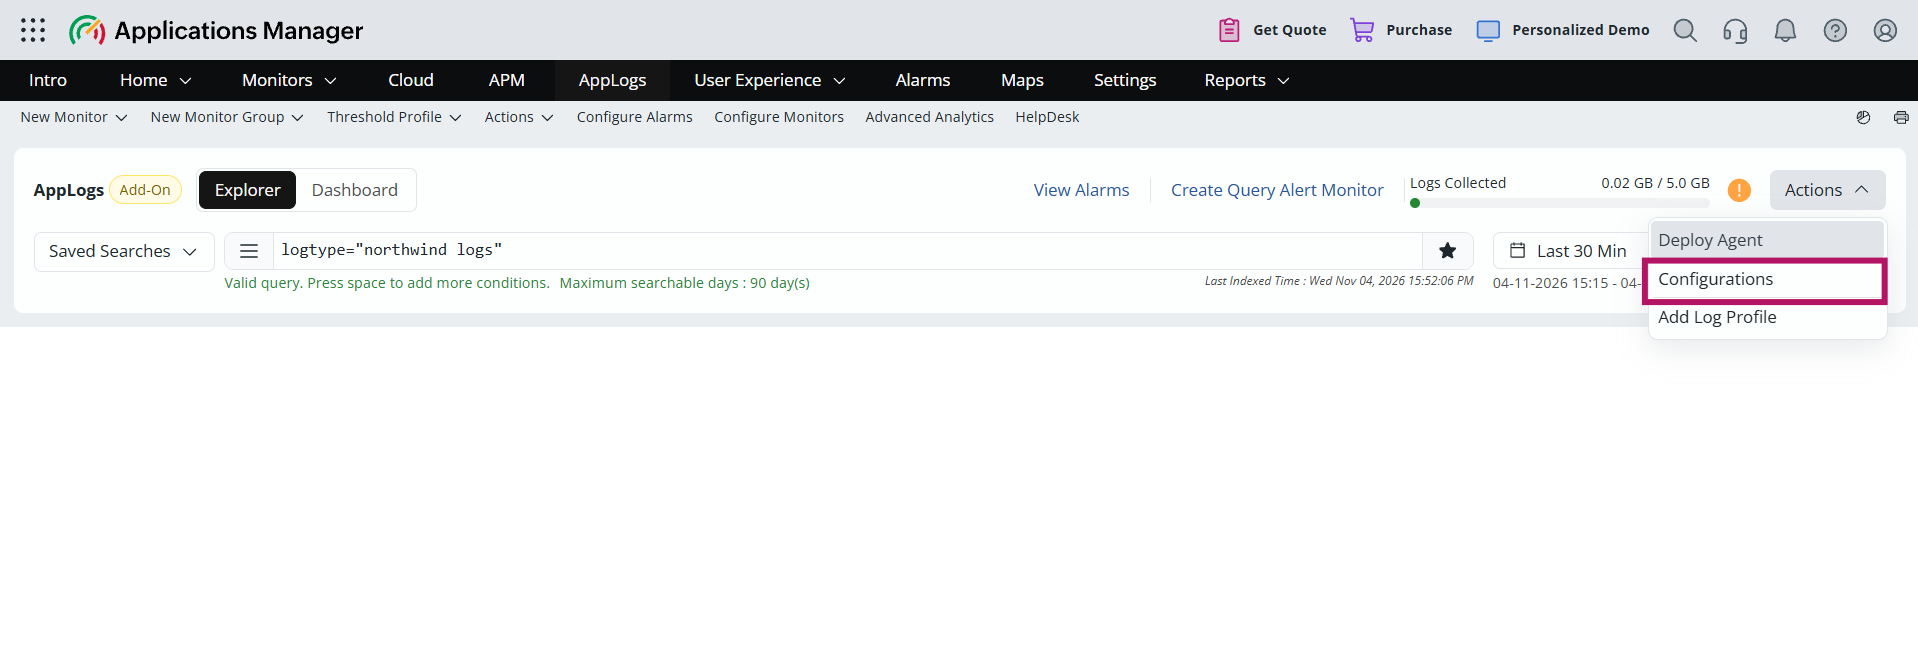
The AppLogs Configurations page is divided into 3 tabs: Log Profiles, Log Types, and Settings.
Log Profiles
Log profiles define what logs are collected and from where. A log profile associates a specific log type with one or more log file paths and servers onboarded via the FSO Agent.

Each log profile helps Applications Manager determine:
- The log type used to parse the log entries
- The file paths or directories from which logs should be collected
- The servers (onboarded via the FSO Agent) to which the log profile applies
From the Log Profiles tab, you can:
- Create new log profiles
- Edit existing log profiles to update file paths or server associations
- Delete log profiles that are no longer required
Log profiles help ensure consistent and controlled log collection across multiple servers and applications.
Log Types
The Log Types tab displays all predefined and custom log types available in AppLogs. A log type defines the structure and format of log entries generated by an application or service.

From this section, you can:
- View predefined log types supported by AppLogs
- Create custom log types for applications with unique log formats
- Update or manage existing custom log type definitions
- Delete custom log types that are no longer required
Configuring the correct log type ensures that log entries are parsed accurately and are searchable using fields and filters.
Settings
The Settings tab allows you to configure global AppLogs behavior. These settings control how logs are read, retained, and optimized for storage and performance.

From this section, you can configure the following options:
- Global Retention Days: Specifies the number of days log data is retained and available for search across all log types.
- Zip indexed data every: Defines how frequently indexed log data is compressed to optimize disk usage. By default, indexed data is zipped every 7 days.
- Read AppLogs data every: Specifies how frequently Applications Manager processes log data from the AppLogs agent to control log ingestion frequency. Recommended interval: 2 minutes (Min: 1 minute | Max: 5 minutes)
- Warning threshold: Specifies the percentage limit at which a warning alert is triggered for a log type. The default value is 80%.
- Enable Logtype Usage via Mail Notification: Allows you to send email notifications whenever LogType usage reaches warning or critical levels. Notifications are triggered only when there is a change in severity (Warning, Critical, or Clear). Once enabled, select the appropriate email action from the dropdown or create a new email action, if required.
These settings help you balance log visibility, storage utilization, and system performance.
Saved Searches
After configuring AppLogs, you can analyze collected logs, correlate them with metrics and alerts, and investigate issues and security events using the AppLogs Explorer. If you run the same queries again and again, save them. A saved search, also called a saved query, lets you run a query without typing it again, keeps the queries you rely on in one place, and can be turned into a dashboard widget or an alert.
Saved searches help you:
- Save time: Run frequently used queries, such as the number of audit failures or the entries per server, with a click.
- Stay consistent: Run the same query every time you check a metric, so that the results are comparable over time.
- Visualize results: Choose a chart type (bar, line, or area) when you save a query, and see it as a widget on the AppLogs Dashboard or on your custom dashboards.
- Get alerted: Use a saved search as the basis for alerting.
You create a saved search in the AppLogs Explorer. Enter a query, click the star icon, enter a name, choose a chart type, and click Save. For the complete steps, refer to Saved searches and Recent searches in the AppLogs Explorer help.
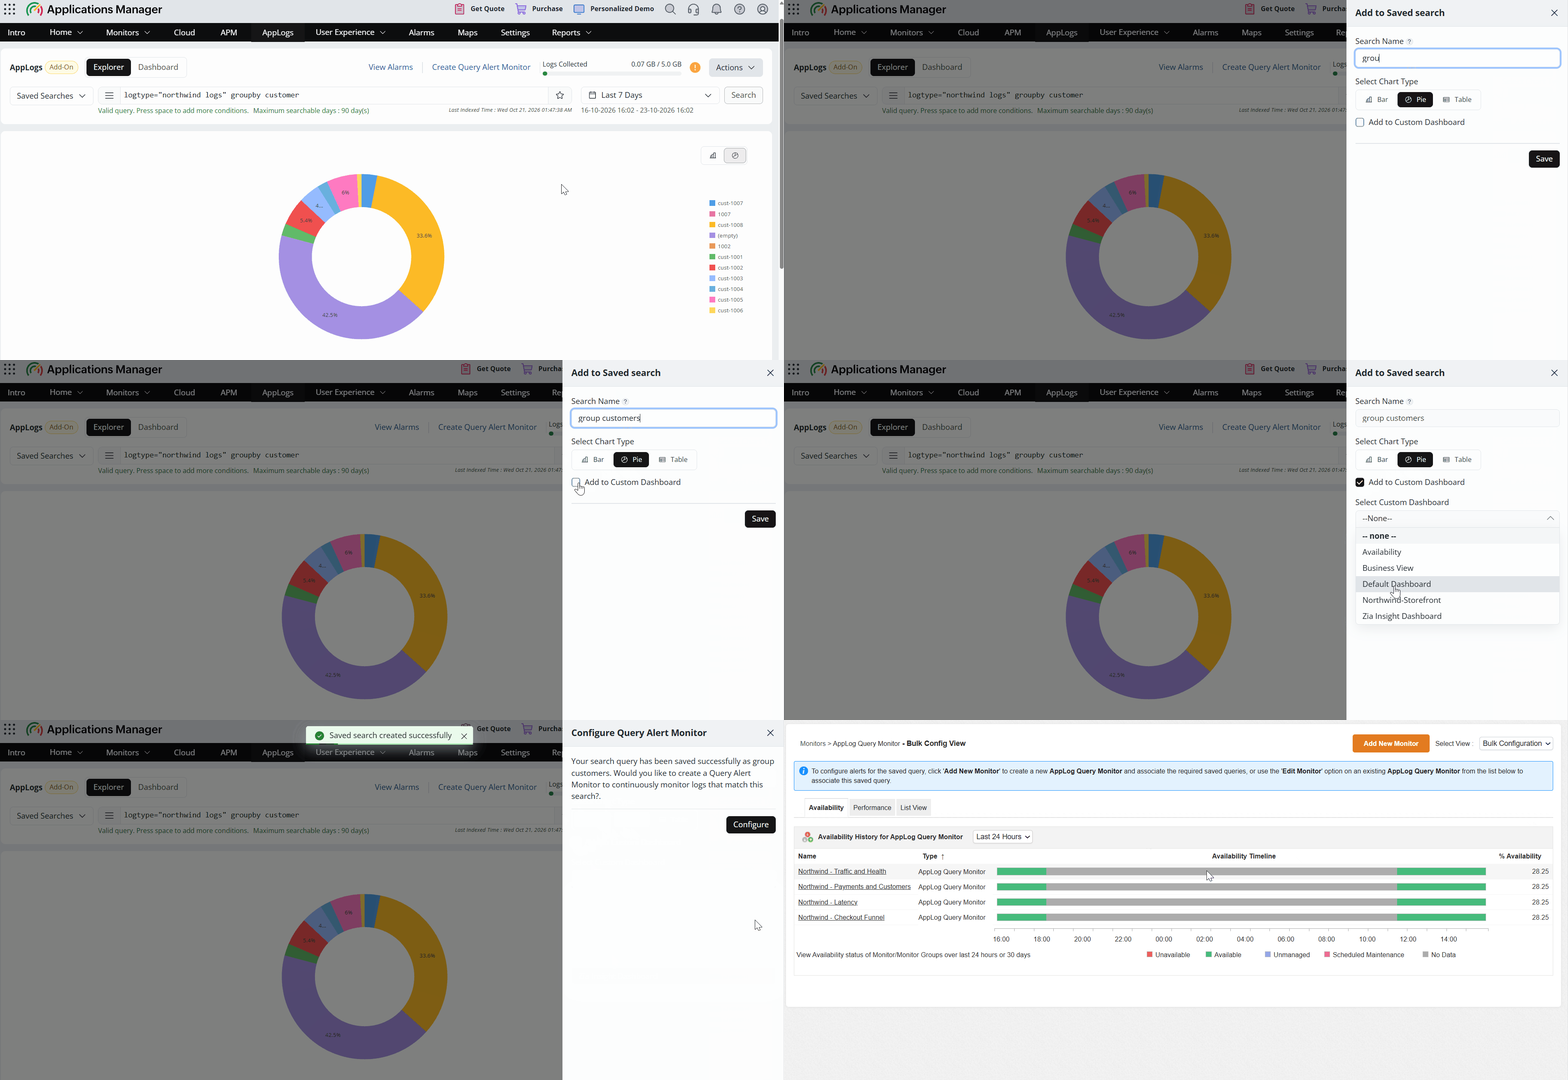
You can see all your saved searches in the following places:
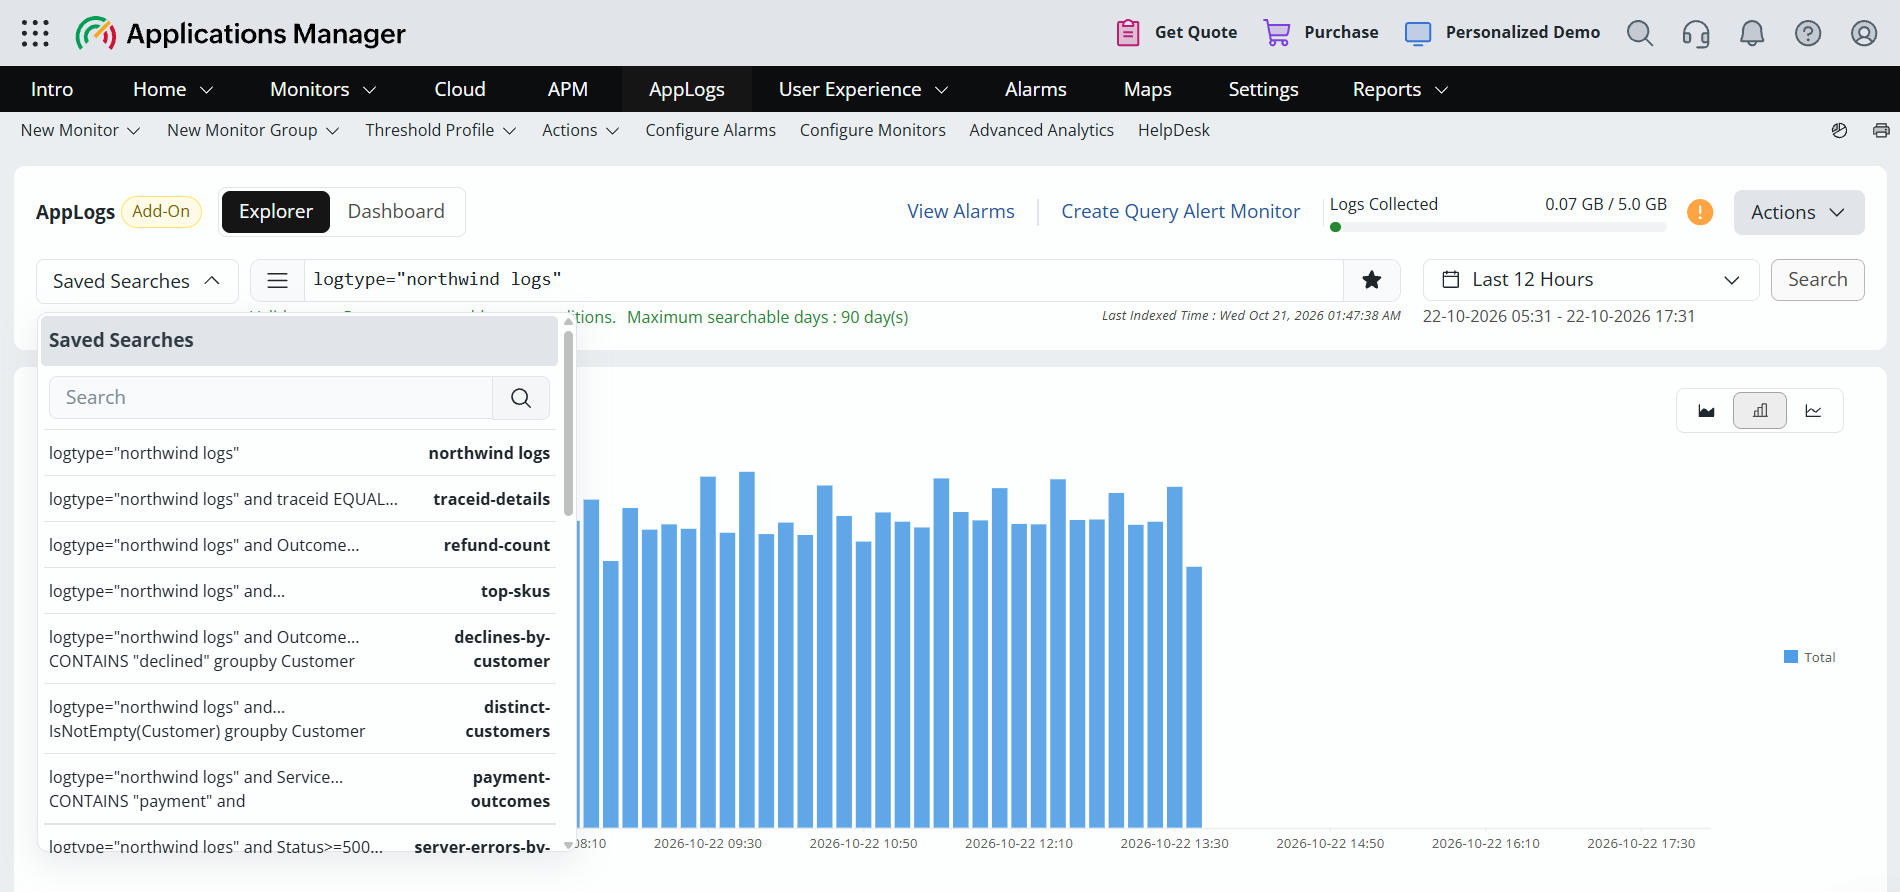
- AppLogs tab: In the Explorer view, select the Saved Searches drop-down at the left of the search bar to list and run your saved searches. The Dashboard view shows them as widgets.
- Settings tab: Navigate to Settings > Discovery & Data Collection > AppLogs Configuration, which is this page, and open the Saved Searches tab.
Note: A saved search that is associated with an AppLog Query Monitor cannot be deleted. This ensures that queries in use by a monitor are not modified or removed unintentionally.
Alert on saved searches
Turn a saved search into an alert with the AppLog Query Monitor. The monitor runs your saved queries at the polling interval you set, exposes the results as monitor attributes, and raises an alarm when the thresholds you configure are violated.
- Monitor up to five saved queries from a single monitor, each alerted on independently.
- For group-by queries, each group is monitored as its own row, so you can see exactly which group needs attention.
- Run the queries only against specific servers or monitor groups.
- View the generated alarms from View Alarms in the AppLogs tab, or from the Alarms tab.
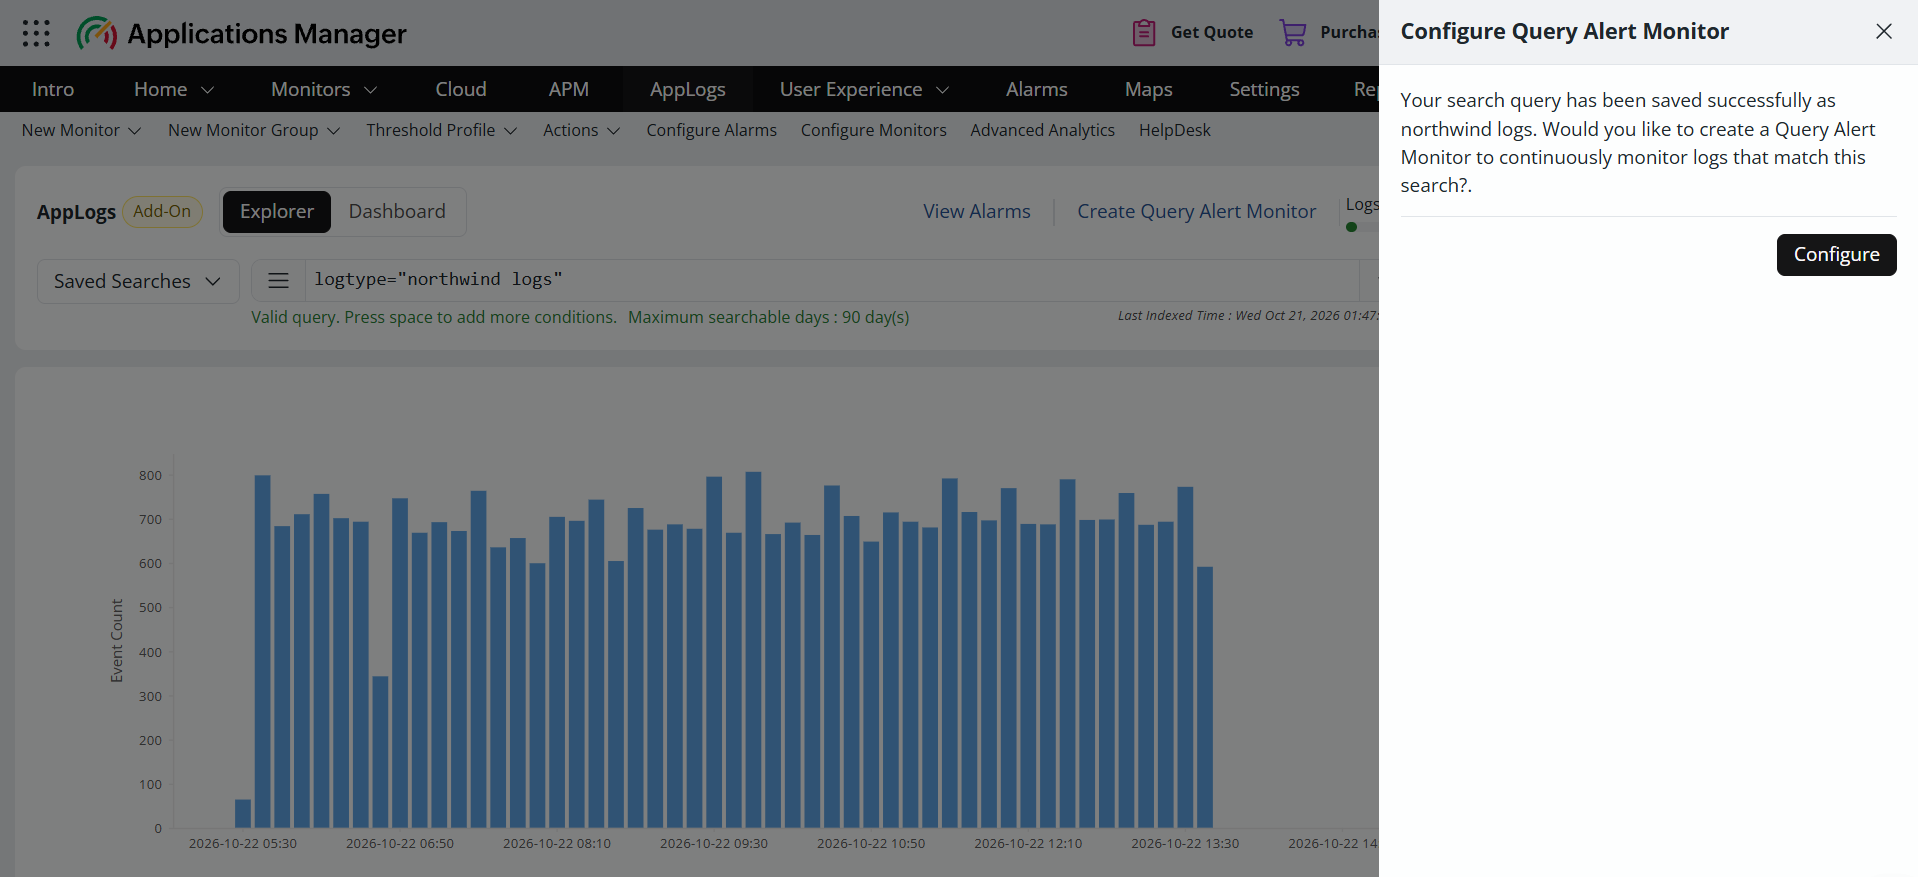
To get started, save a query and click Configure in the Configure Query Alert Monitor panel that appears, or click Create Query Alert Monitor in the AppLogs tab. This opens the AppLog Query Monitor bulk configuration page, where you can create a monitor or add the query to an existing one.
For more information, refer to:
- AppLog Query Monitor for the steps to create a monitor, configure alarms, and view alarms
- Alerting on saved log searches in the AppLogs Explorer help