Heartbeat Monitor
- Overview
- Creating a new Heartbeat Monitor
- Bulk Creation of Heartbeat Monitors
- Setup Options
- Monitored Parameters
- Licensing
Overview
The Heartbeat Monitor helps ensure that background processes like scripts, agents, workers, and daemons are running as expected without interruptions. For each Heartbeat Monitor, a unique ping URL is generated. The monitored service must regularly send a ping to this URL to indicate it is active.
If the service stops pinging the URL within a specified time window, the monitor will automatically flag it as down or unhealthy, helping you detect failures quickly and take corrective action.
Note: Until the first ping is received, the monitor remains in the discovery state. Its status will be updated as soon as the ping URL is accessed.
Creating a new Heartbeat Monitor
Using REST API to add a new Heartbeat monitor:Click here
To create a Heartbeat Monitor, follow the steps below:
- Click on New Monitor. Choose Heartbeat Monitoring under the 'Services' category.
- Enter the Display Name for the monitor.
- Specify a unique Name used in Ping URL. (This cannot be changed later.)
- Set Affect availability if no ping received in: Duration (in minutes) after which the monitor's availability is marked as critical if no ping is received.
- Set Affect health if no ping received in: Duration (in minutes) after which the monitor's health is marked as critical if no ping is received.
- Optionally, set Affect health if ping received within: Duration (in minutes) to flag the monitor's health if a ping is unexpectedly received.
- Select a Monitor Group to associate this monitor with.
- Click Add Monitor(s) to save and start monitoring.
Ping URL Details:
- The ping URL follows the format: https://<apm_host>:<apm_port>/heartbeat?pingName=<ping_name> and the authentication key sent in the POST body.
- <apm_port> uses the Server Agent port. If disabled, the default HTTPS port is used.
- A maximum of two pings per minute is allowed. Any further requests will be blocked.
- You can regenerate the auth key via Monitor Actions → Regenerate Key.
Bulk Creation of Heartbeat Monitors
Instead of adding Heartbeat Monitors one at a time through the Applications Manager web console, you can create multiple monitors at once using the Heartbeat Monitor API or ping URL directly from your monitored device, system, or scripts.
To enable bulk monitor creation:
- Navigate to Performance Polling → Optimize Data Collection → Heartbeat Monitor.
- Disable the Restrict Heartbeat Authentication to Monitor-Specific API Keys option.
- Obtain the Heartbeat Monitor API key from Settings → REST API → Heartbeat Monitor.
How it works
Each monitor is created when Applications Manager receives a heartbeat ping with a unique ping name (for example, Device01, Device02, etc.). The request should be sent to:
https://<apm_host>:<apm_port>/heartbeat?pingName=<unique_ping_name>
Include the Heartbeat Monitor API key in the POST body for authentication.
Example: Using curl to make the Heartbeat Monitor API request
curl -k -X POST -d "apikey=xM4pxencla5pED229RxwQwu9yES7HlFY" 'https://apm-host:8334/heartbeat?pingName=Device01'
curl -k -X POST -d "apikey=xM4pxencla5pED229RxwQwu9yES7HlFY" 'https://apm-host:8334/heartbeat?pingName=Device02'
If the API key is valid and the ping name is new, Applications Manager will automatically add the monitor. This method is especially useful when setting up a large number of monitors quickly, such as after deploying a new batch of servers.
Setup Options
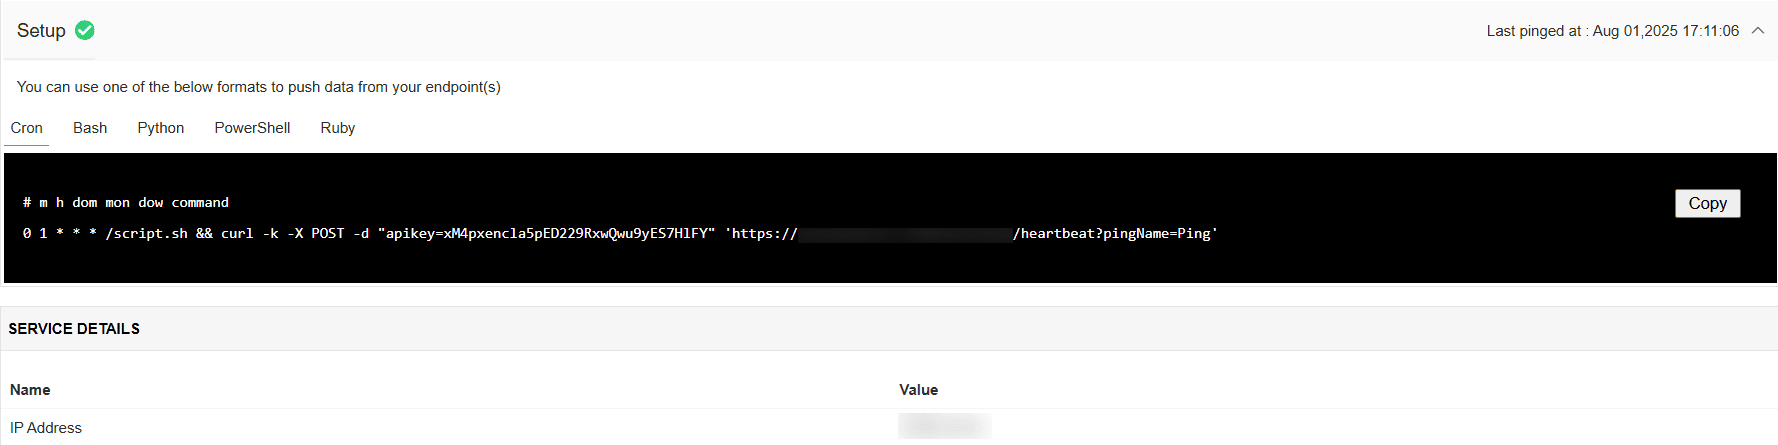
Once the monitor is created, a unique ping URL and authentication key will be generated. You can use any of the following formats to trigger the heartbeat from your service:
- Cron
- Bash
- Python
- PowerShell
- Ruby
Monitored Parameters
Go to the Monitors Category View by clicking the Monitors tab. Click on Heartbeat under the Services table. Displayed is the Heartbeat monitor's bulk configuration view distributed into three tabs:
- Availability tab gives the Availability history for the past 24 hours or 30 days.
- Performance tab gives the Health Status and events for the past 24 hours or 30 days.
- List view tab enables you to perform bulk admin configurations.
Below are the list of metrics that are monitored in Applications Manager's Heartbeat monitor:
| Parameter | Description |
|---|---|
| IP Address | IP address from where the heartbeat ping was triggered. |
Note: No attributes from Heartbeat Monitor are currently supported in Reports, Thresholds, or Widgets.
Licensing
For licensing purposes, every 1 to 25 Heartbeat Monitors is collectively counted as one Basic Monitor.
