Monitor sample NetFlow data for any IP range right in the evaluation phase and refine bandwidth management strategies with Simulate NetFlow.
Learn More Take a demo

NetFlow Analyzer's Standard Edition has been launched for basic traffic analysis and bandwidth monitoring requirements.
Learn More Take a demo

Integrate webhooks with NetFlow Analyzer to send information to specified webhook URLs of integrated third-party applications.
Learn More Take a demo

NetFlow Analyzer now offers support for AWS VPC Flow logs to help monitor and manage AWS resources and virtual private clouds in your network with ease.
Learn More Take a demo

Introducing HighPerf, our highly scalable raw storage database that facilitates smarter analytics, faster troubleshooting, and better bandwidth management.
Learn More Take a demo

NetFlow Analyzer integrates with Jira Service Desk, Slack, ManageEngine ServiceDesk Plus, ServiceNow, and ServiceDesk Plus Cloud to help create and manage notification templates.
Learn More Take a demo

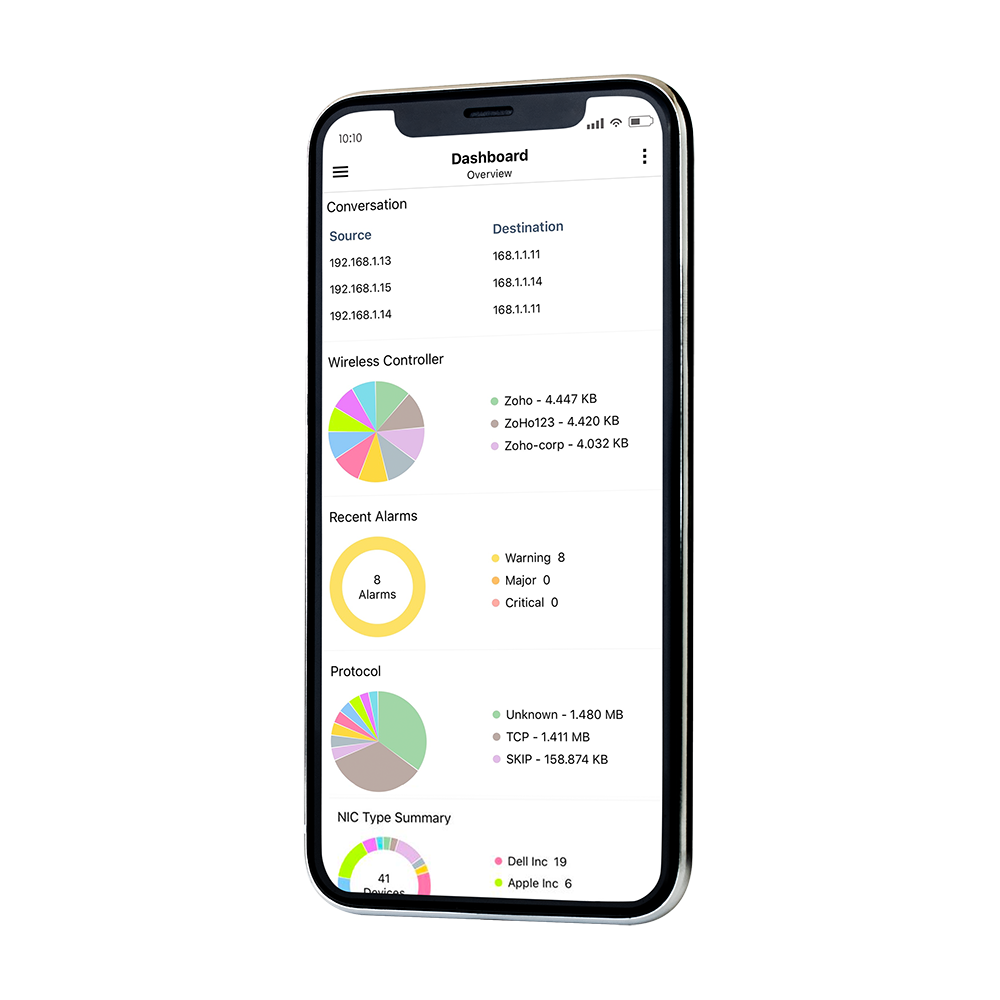
The iOS app version 2.1.1 provides a multitude of new features and enhancements to help you easily manage your devices and alerts anytime, anywhere.
Learn More Take a demo
NetFlow Analyzer now enables you to configure failover with a virtual IP address.
Learn More Take a demo

Foresee bandwidth requirements, traffic patterns, and application usage and proactively prevent bottlenecks and traffic spikes with NetFlow Analyzer's Forecast report.
Learn More Take a demo

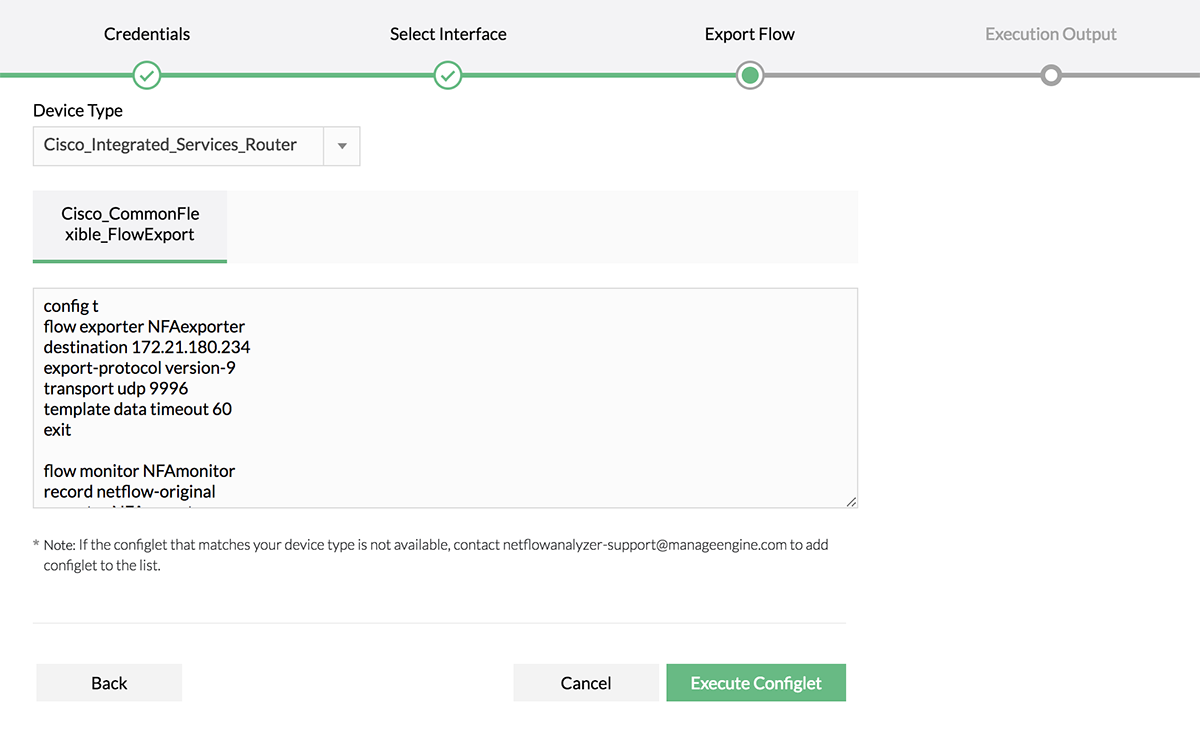
The Export Flow feature is enhanced to make manual and automated flow export easier! Users can now configure flows from the UI using the Predefined and Custom Flow Export options on a single click.
Learn More Take a demo
Upgrade from Essential to Enterprise Edition on a single click with the Distributed Monitoring Feature.
Learn More Take a demo

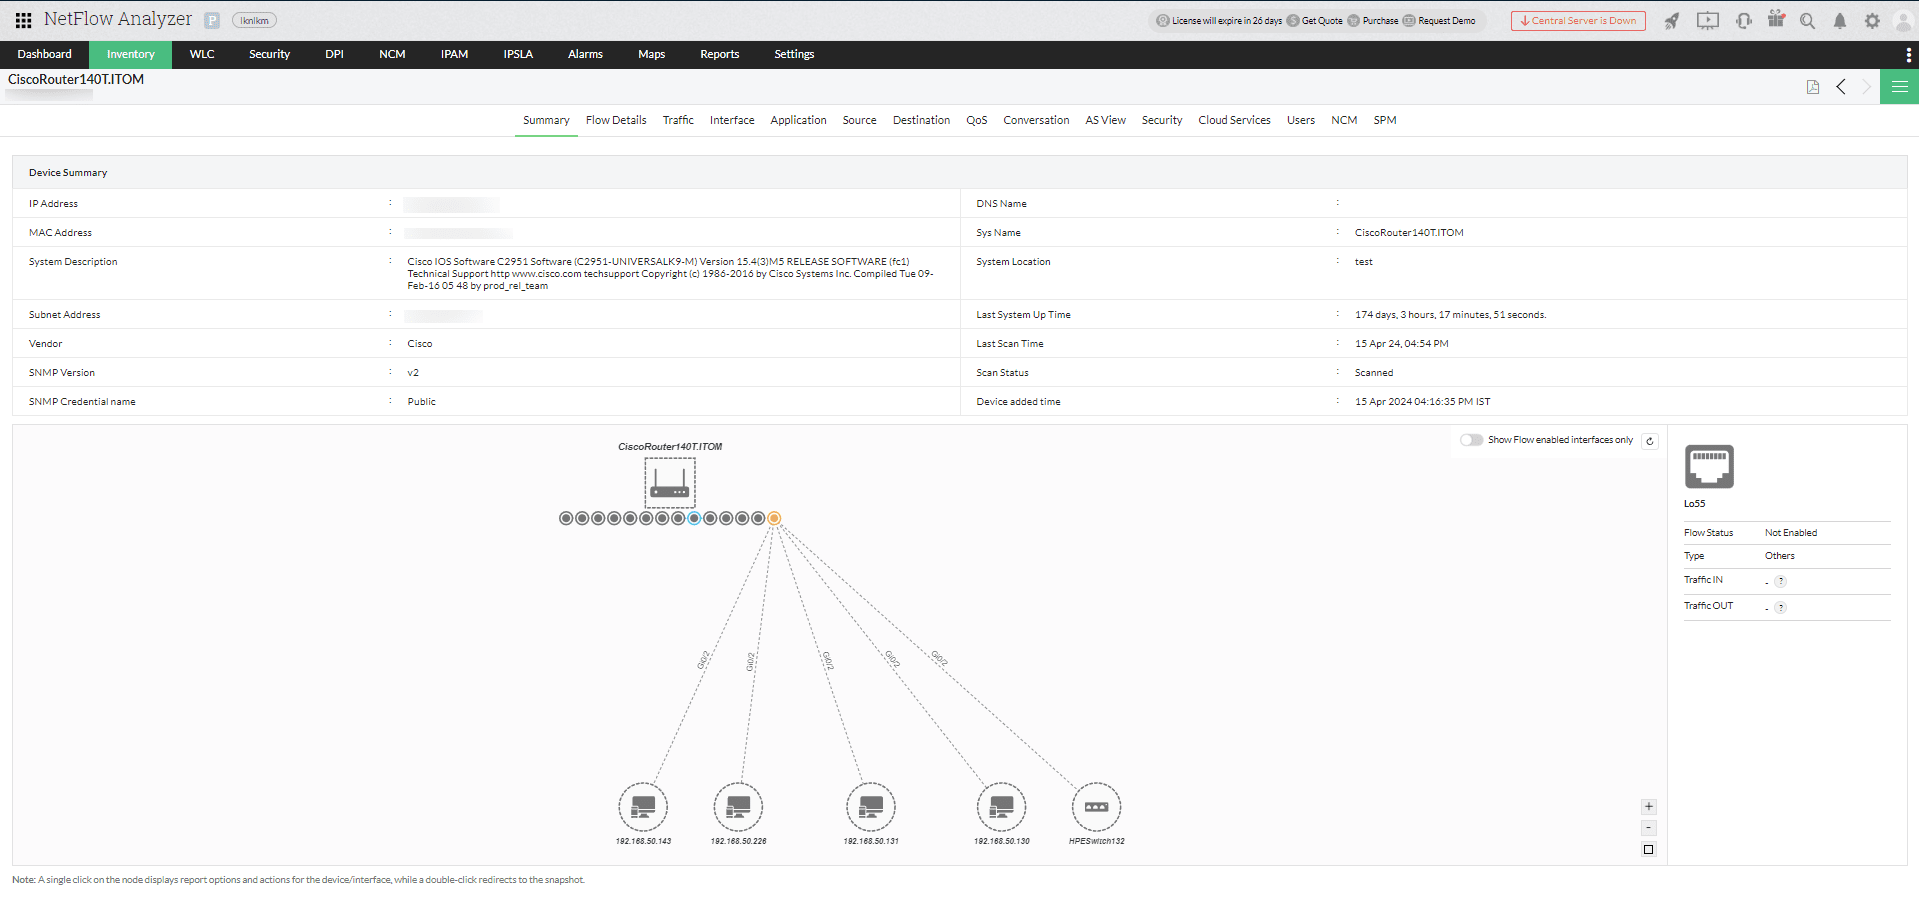
Create tasks to fetch device details at any scheduled time with Inventory Updater.
Learn More Take a demo

Visualize logical maps of your organization's IT infrastructure right from your network traffic management console.
Learn moreAutomate and simplify network anomaly detection, configuring threshold values for critical performance monitors, and traffic management with NetFlow Analyzer's ML and AI based Pattern Analysis.
Learn more Take a demo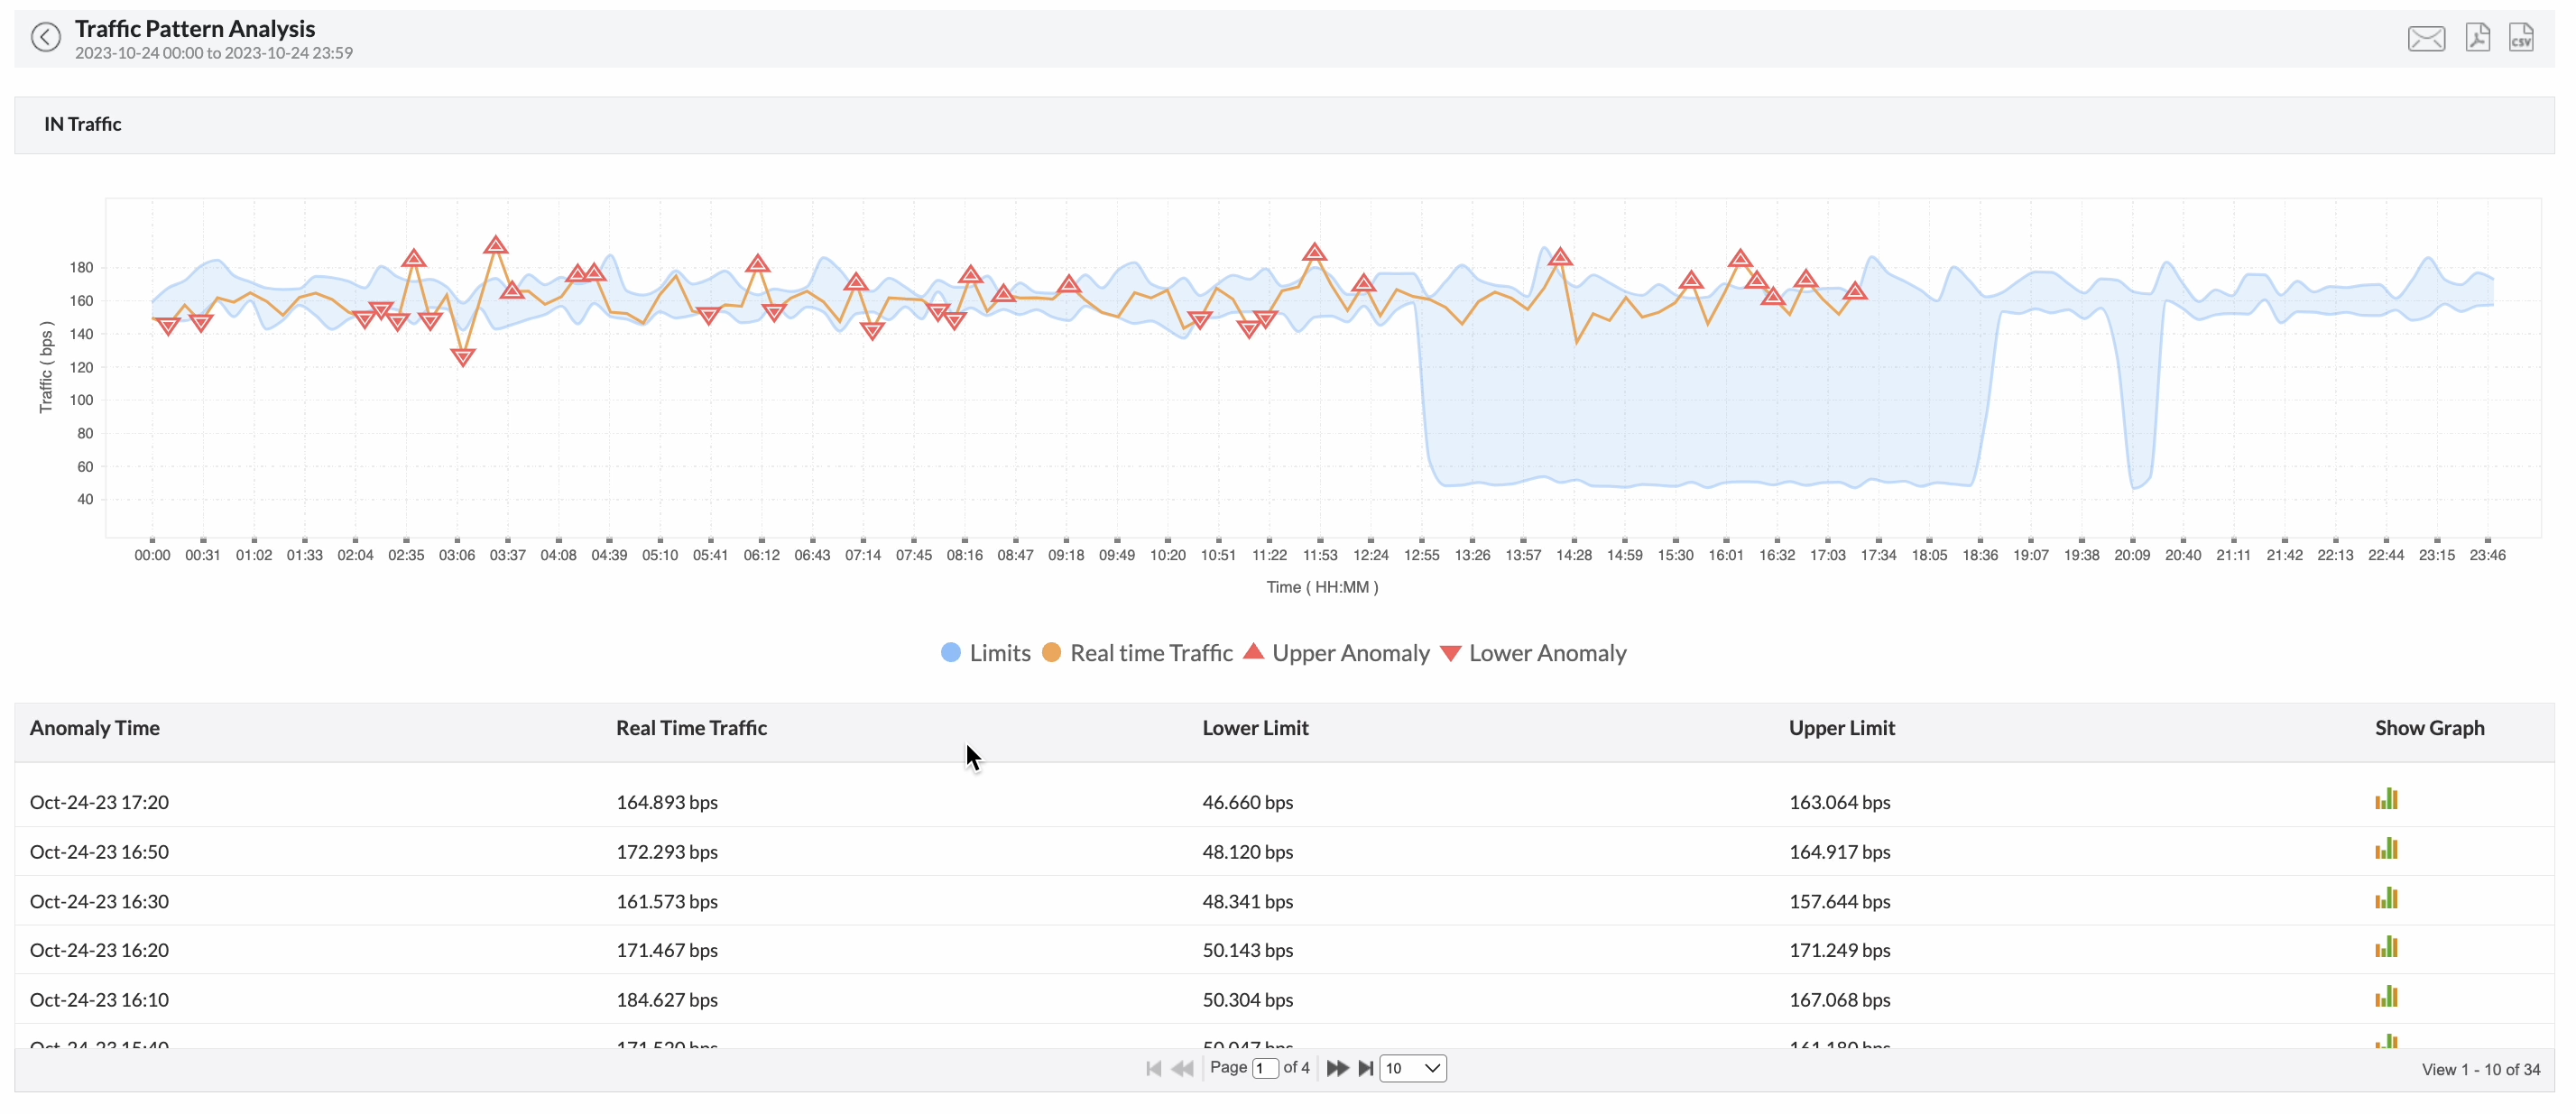
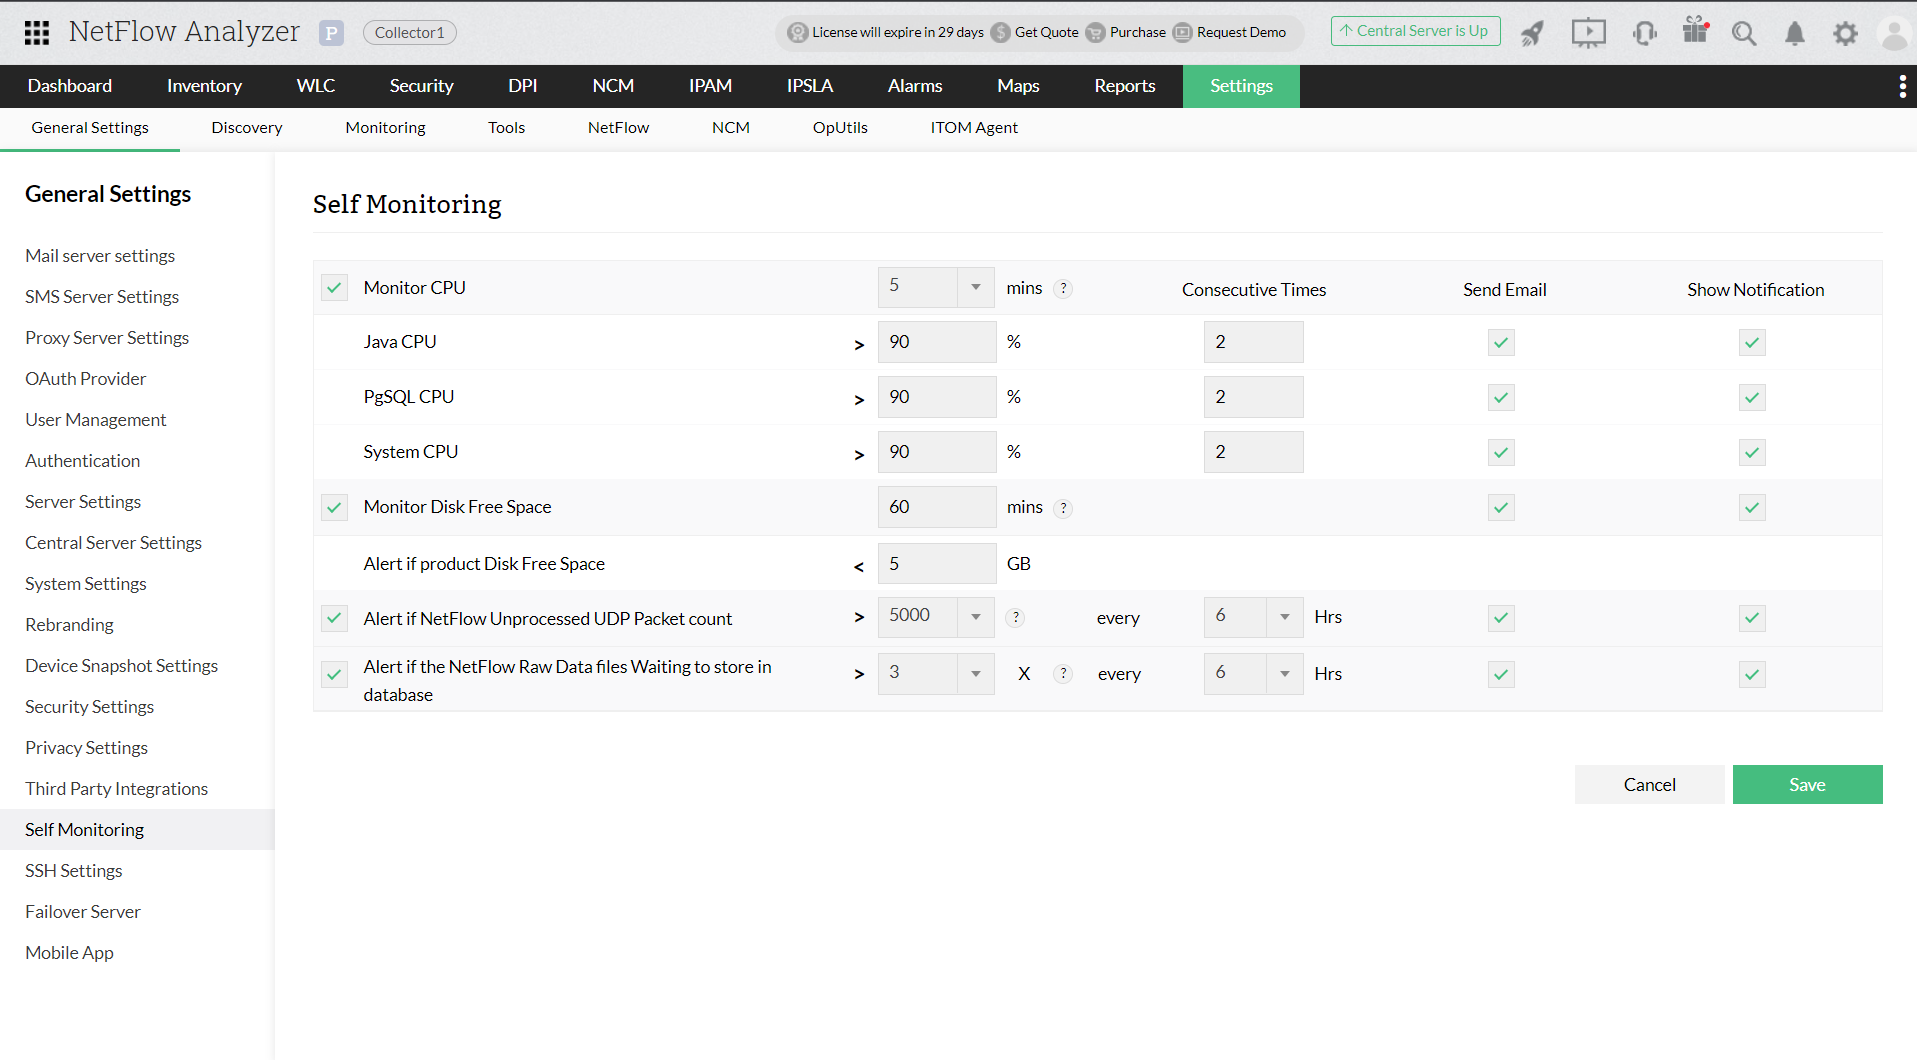
Raise a self-monitoring alarm when unprocessed NetFlow UDP packets go beyond the threshold value.
Learn moreIPv6 support is now provided for the NetFlow Generator and deep packet inspection.
Learn more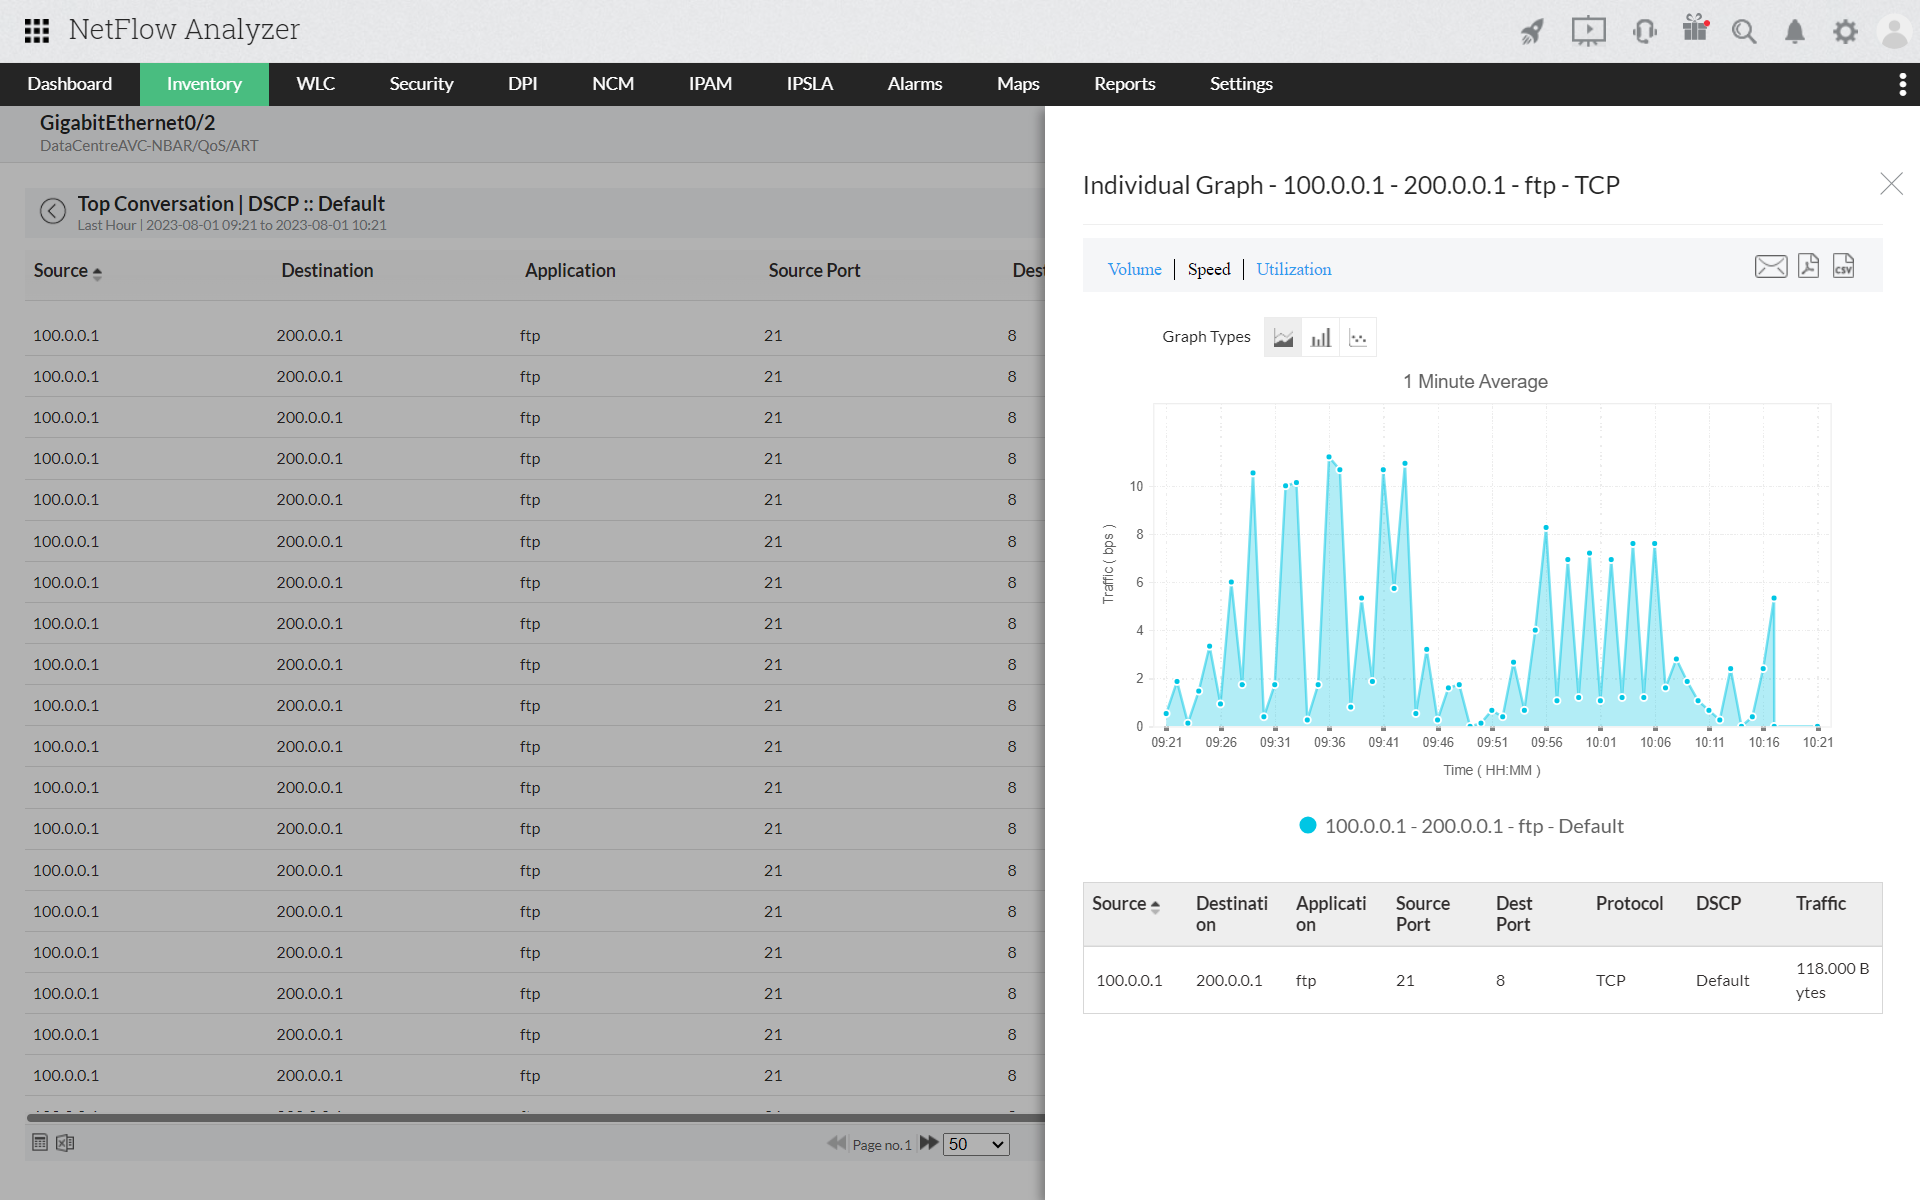
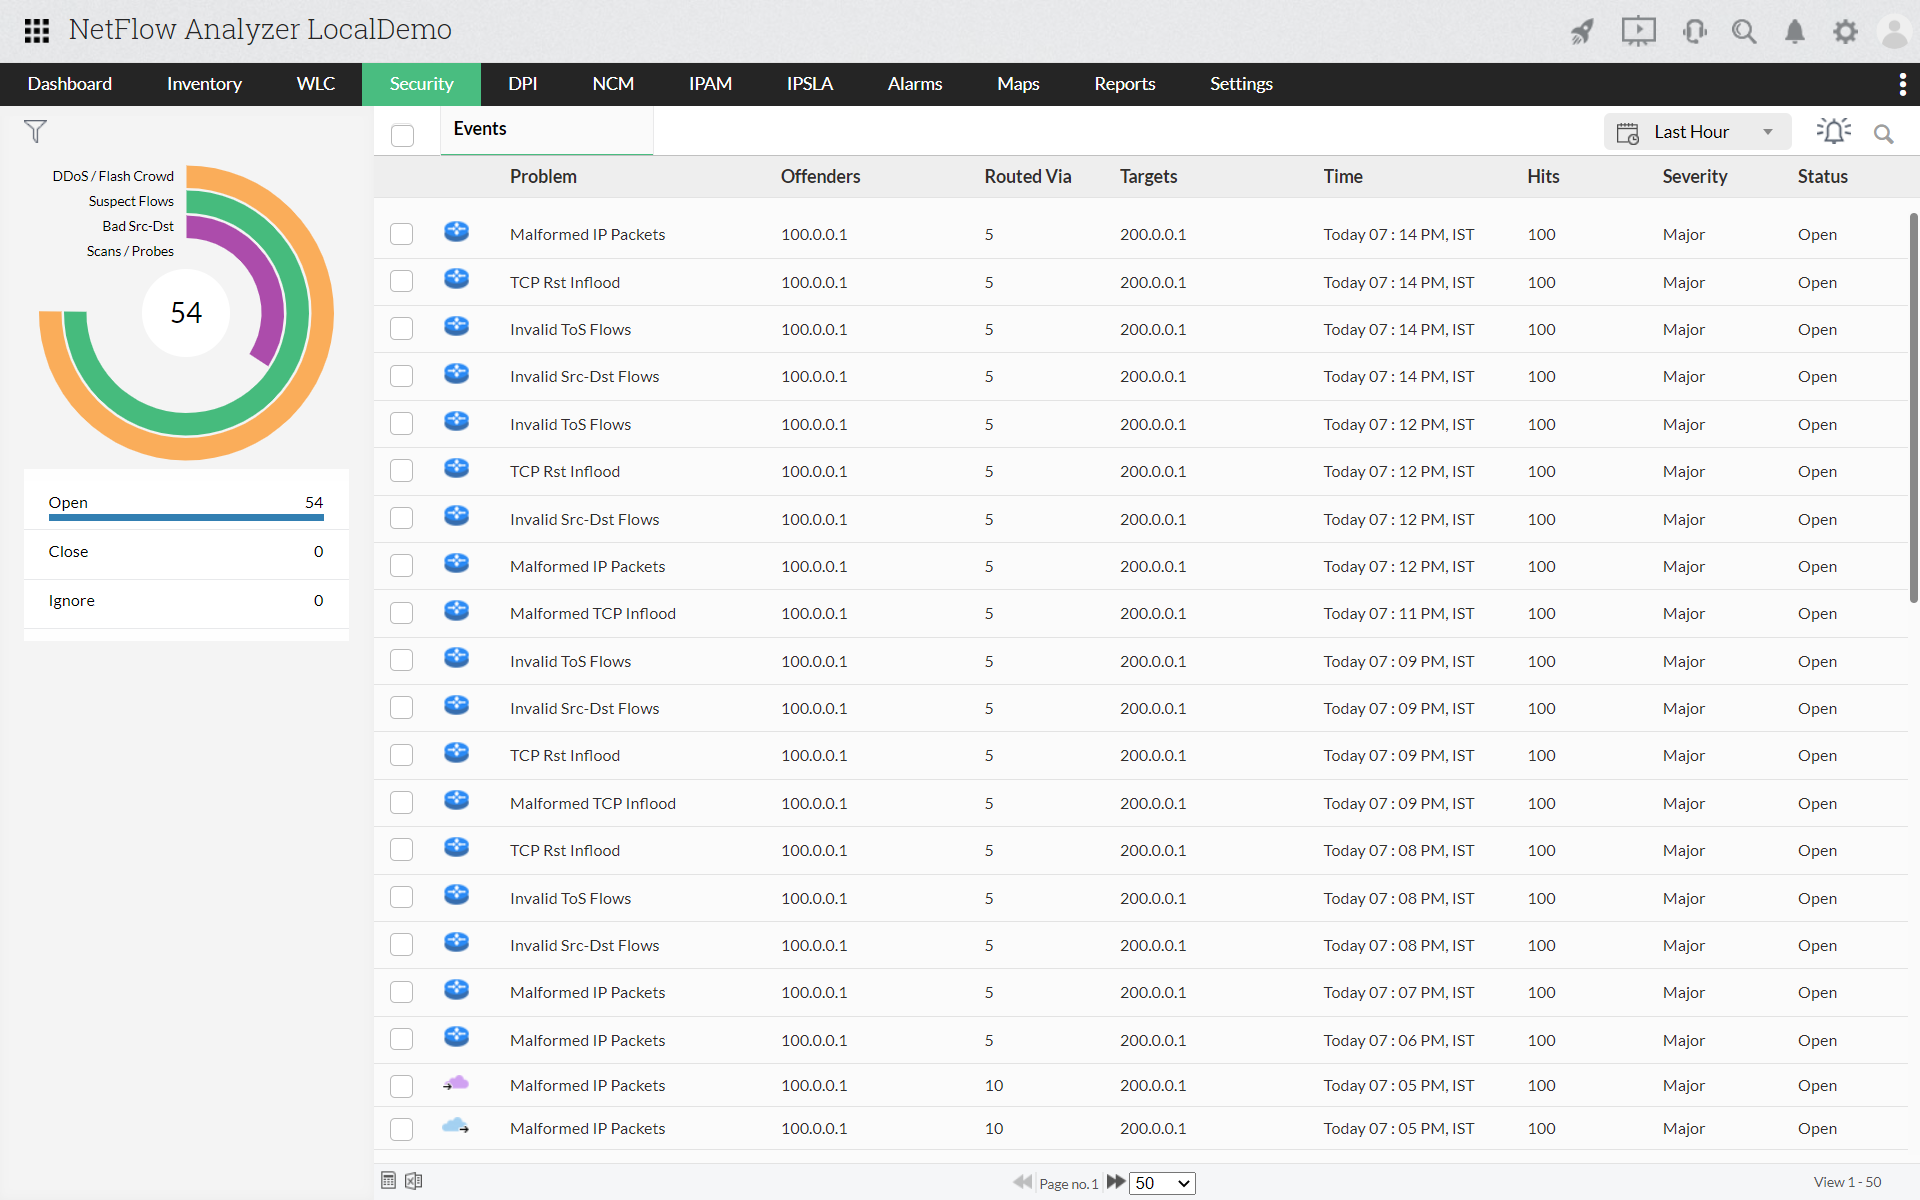
The ASAM module has been revamped and renamed to Security.
Learn morePrevent network strain and track historical internet service performance with the NetSpeed Tracker.
Learn more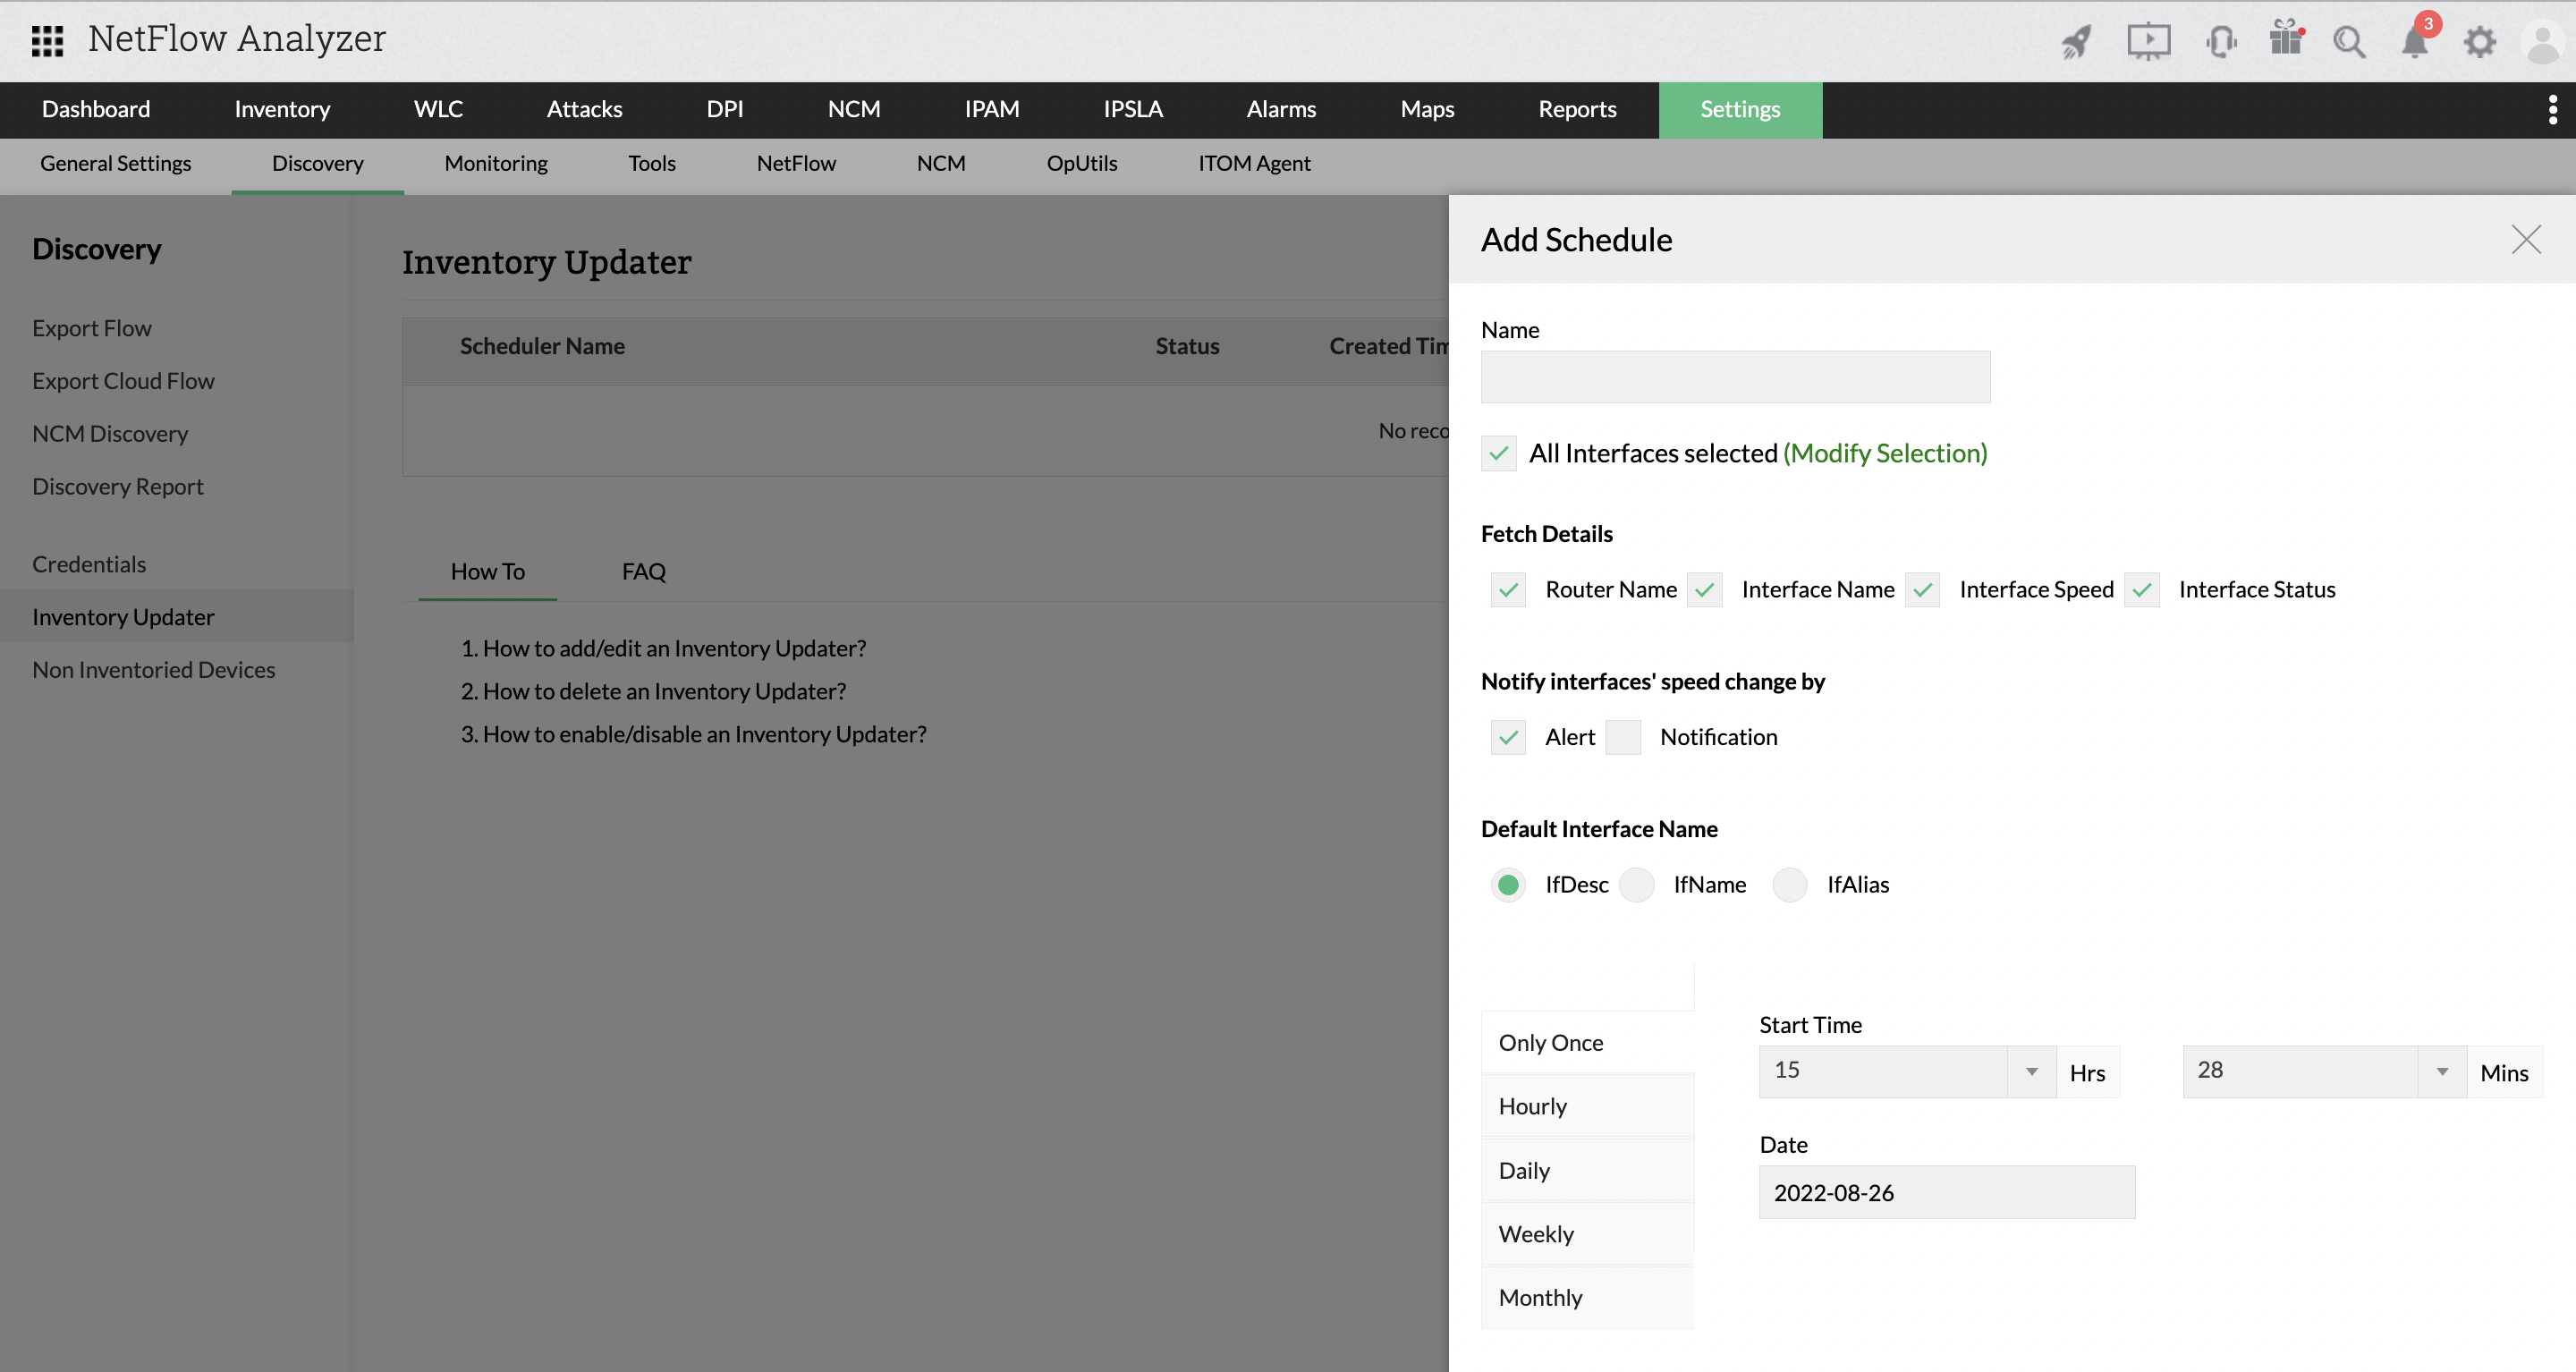
You can now track interface speed change and get notified via SNMP Scheduler.
Learn moreCapacity Planning, Alert Profiles, and Forensics reports have been revamped and enhanced to offer better user experience and visibility.
Learn more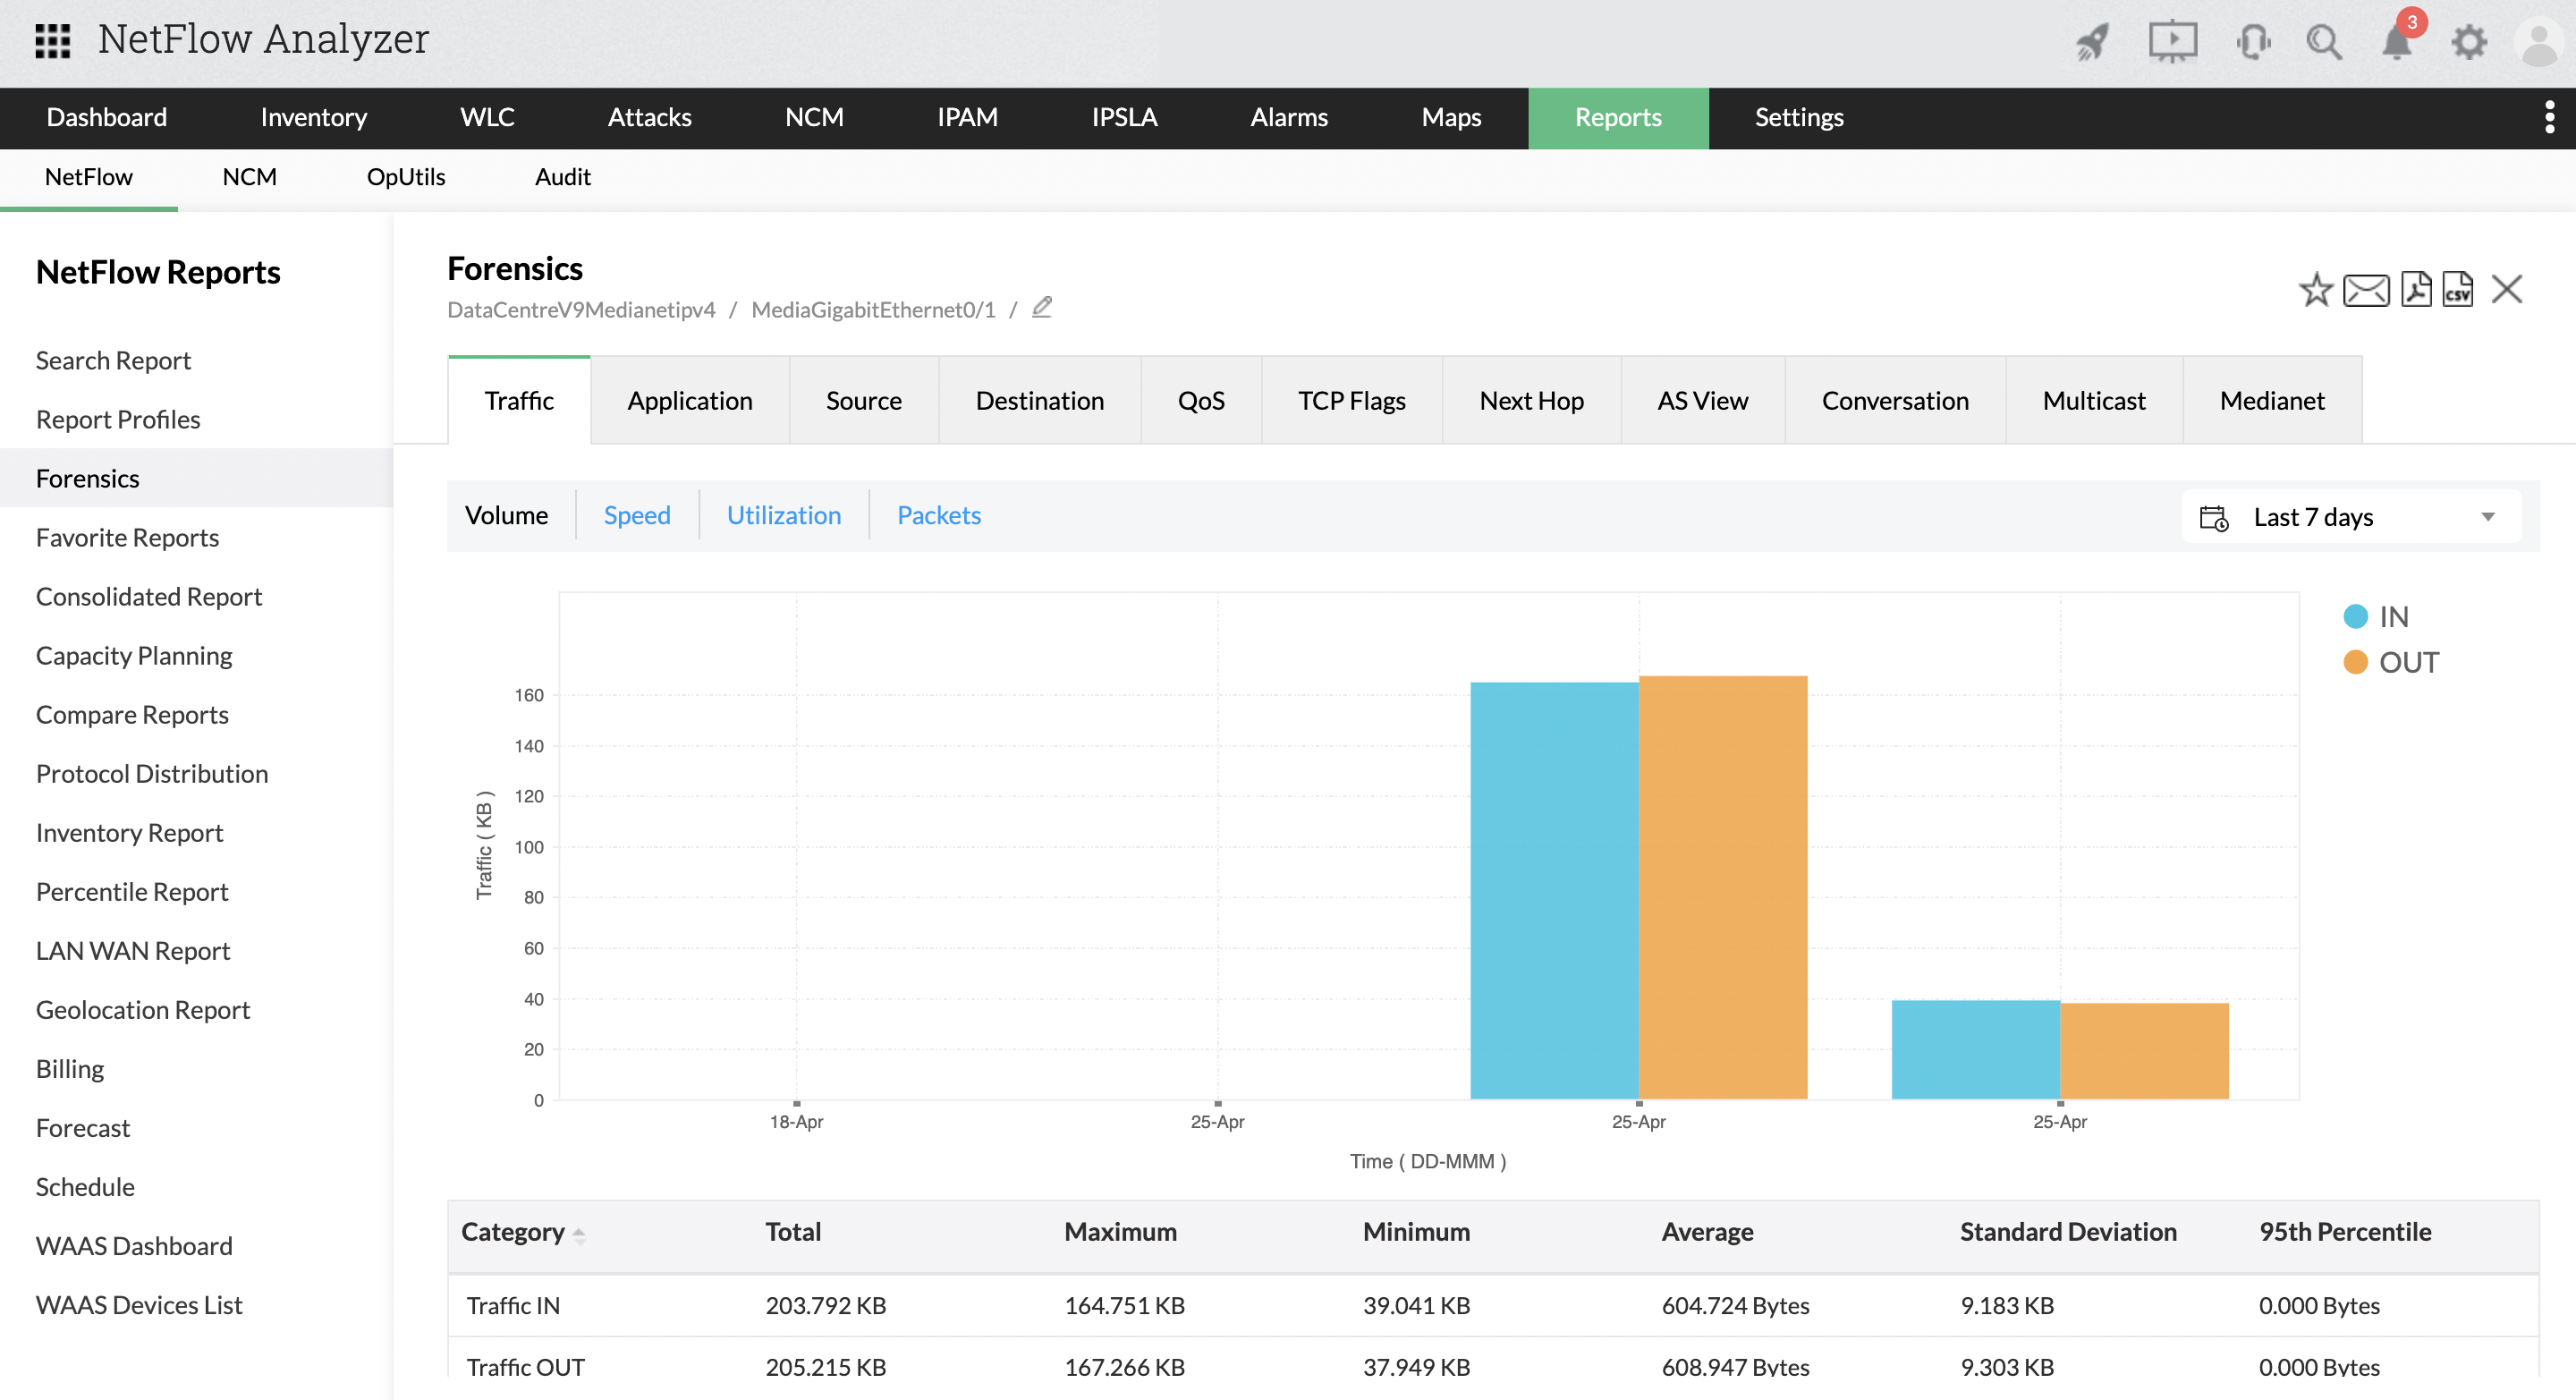
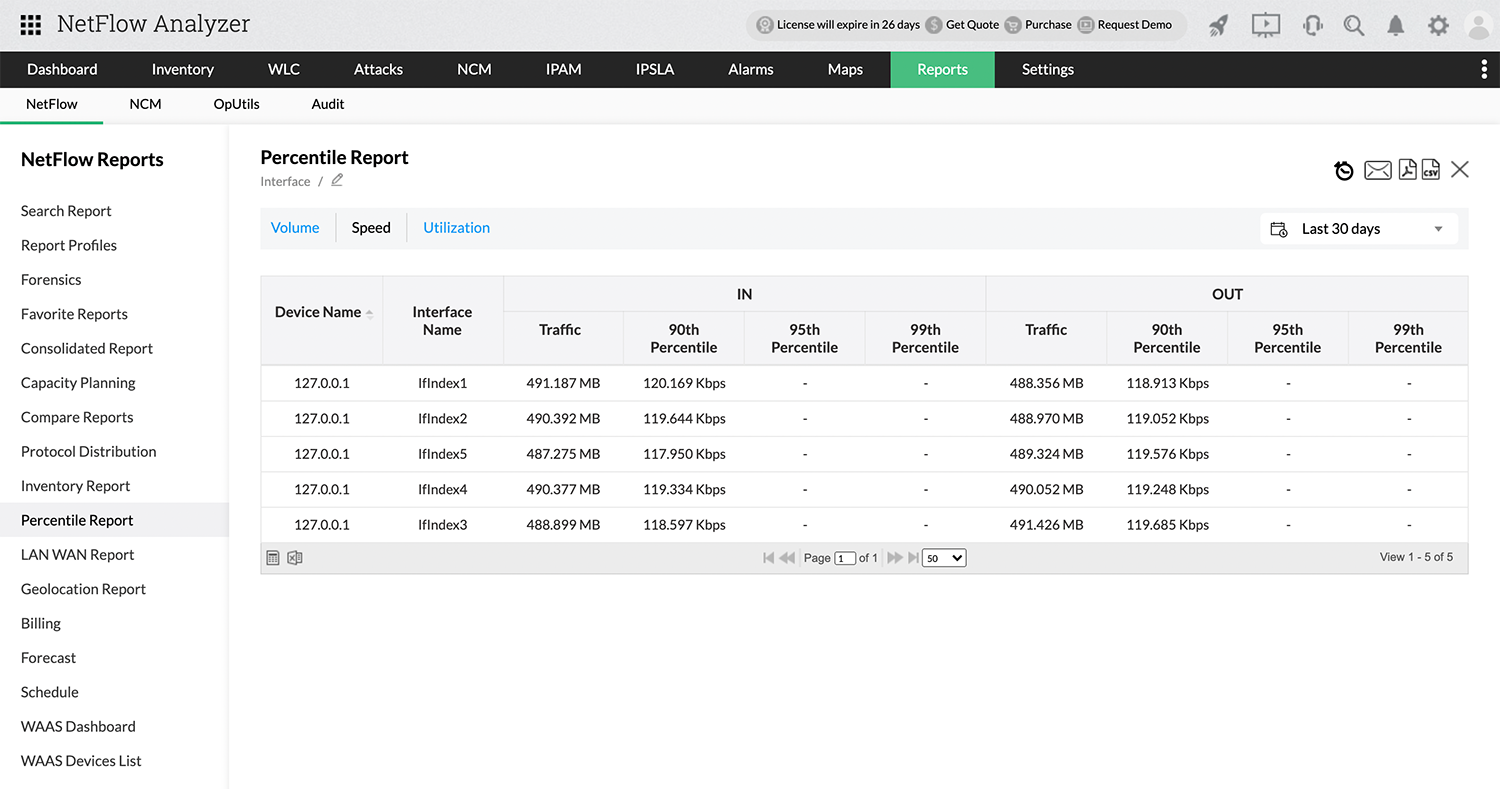
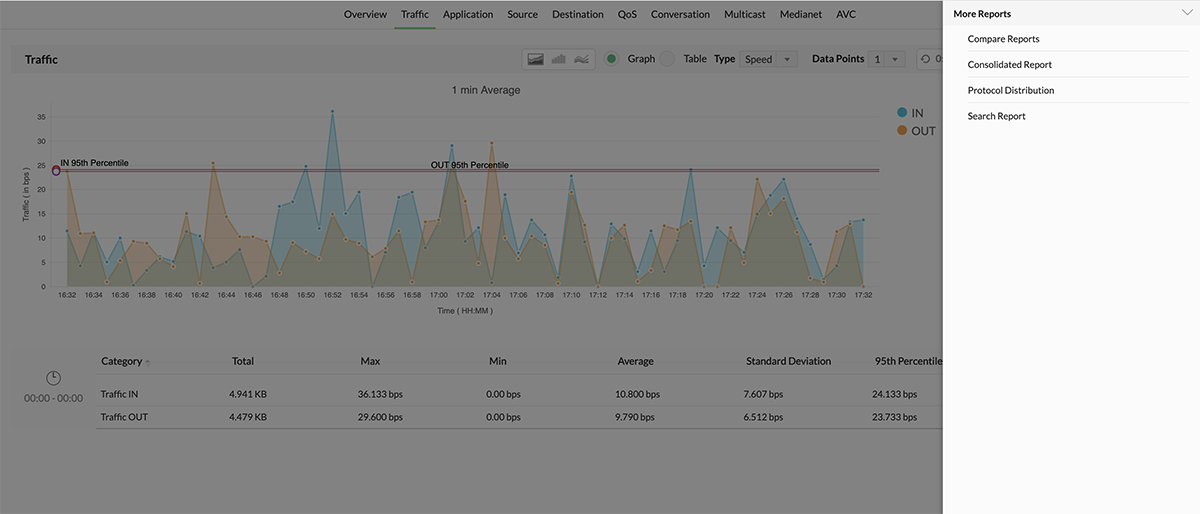
NetFlow Analyzer now allows users to generate custom Percentile Reports.
Learn moreWith NetFlow Analyzer's free tool, capture and convert network packets into NetFlow packets to monitor devices that don't support flow.
Learn more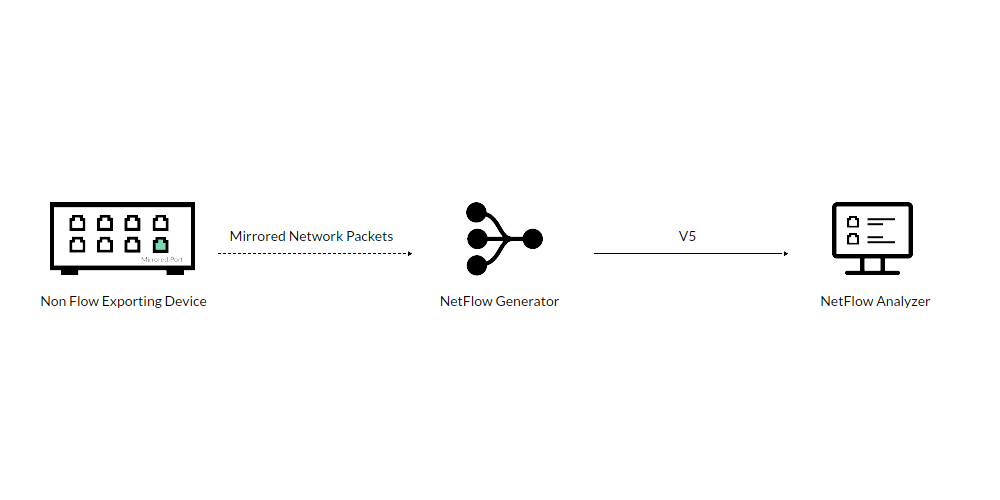
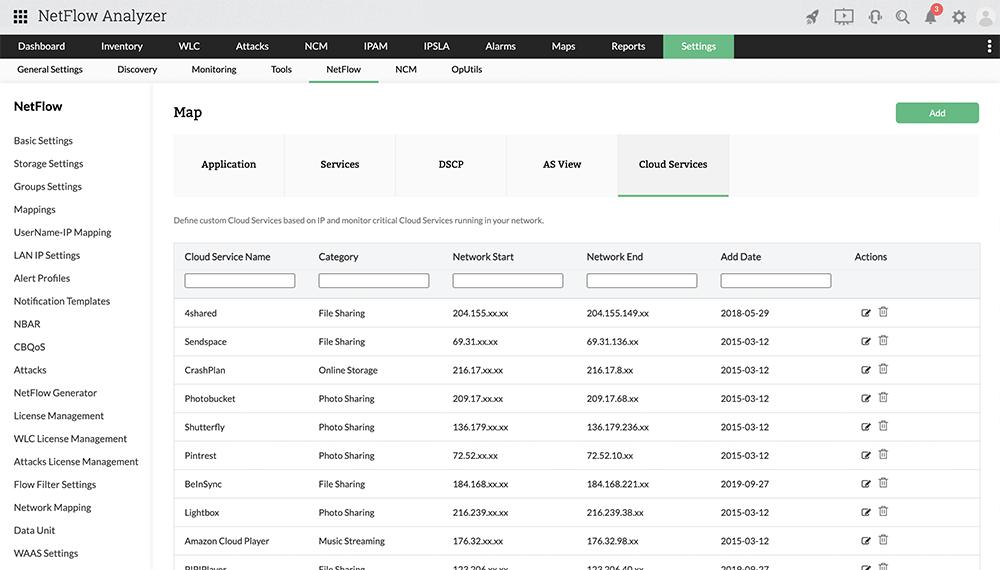
With the newly added Cloud Services feature, you can define and monitor critical cloud services running in your network.
Learn moreKeep track of your entire local network with the LAN-WAN reports we've introduced for interfaces and devices.
Learn more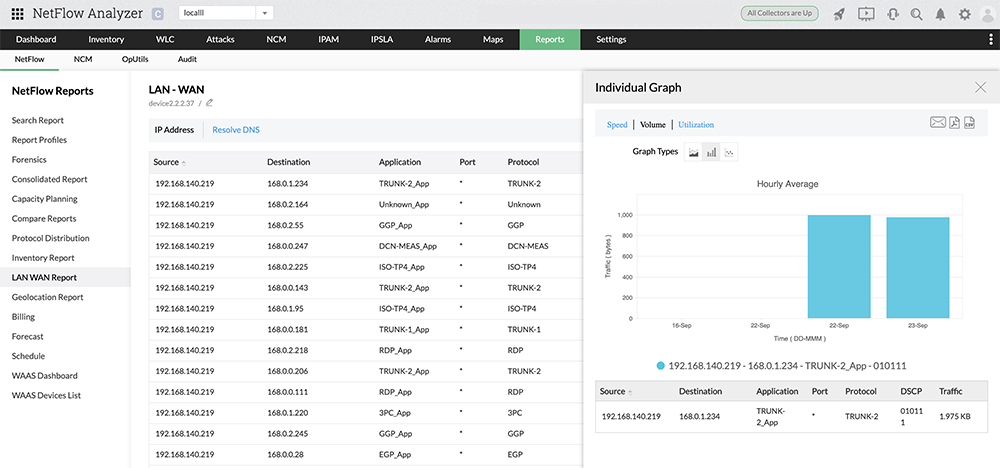
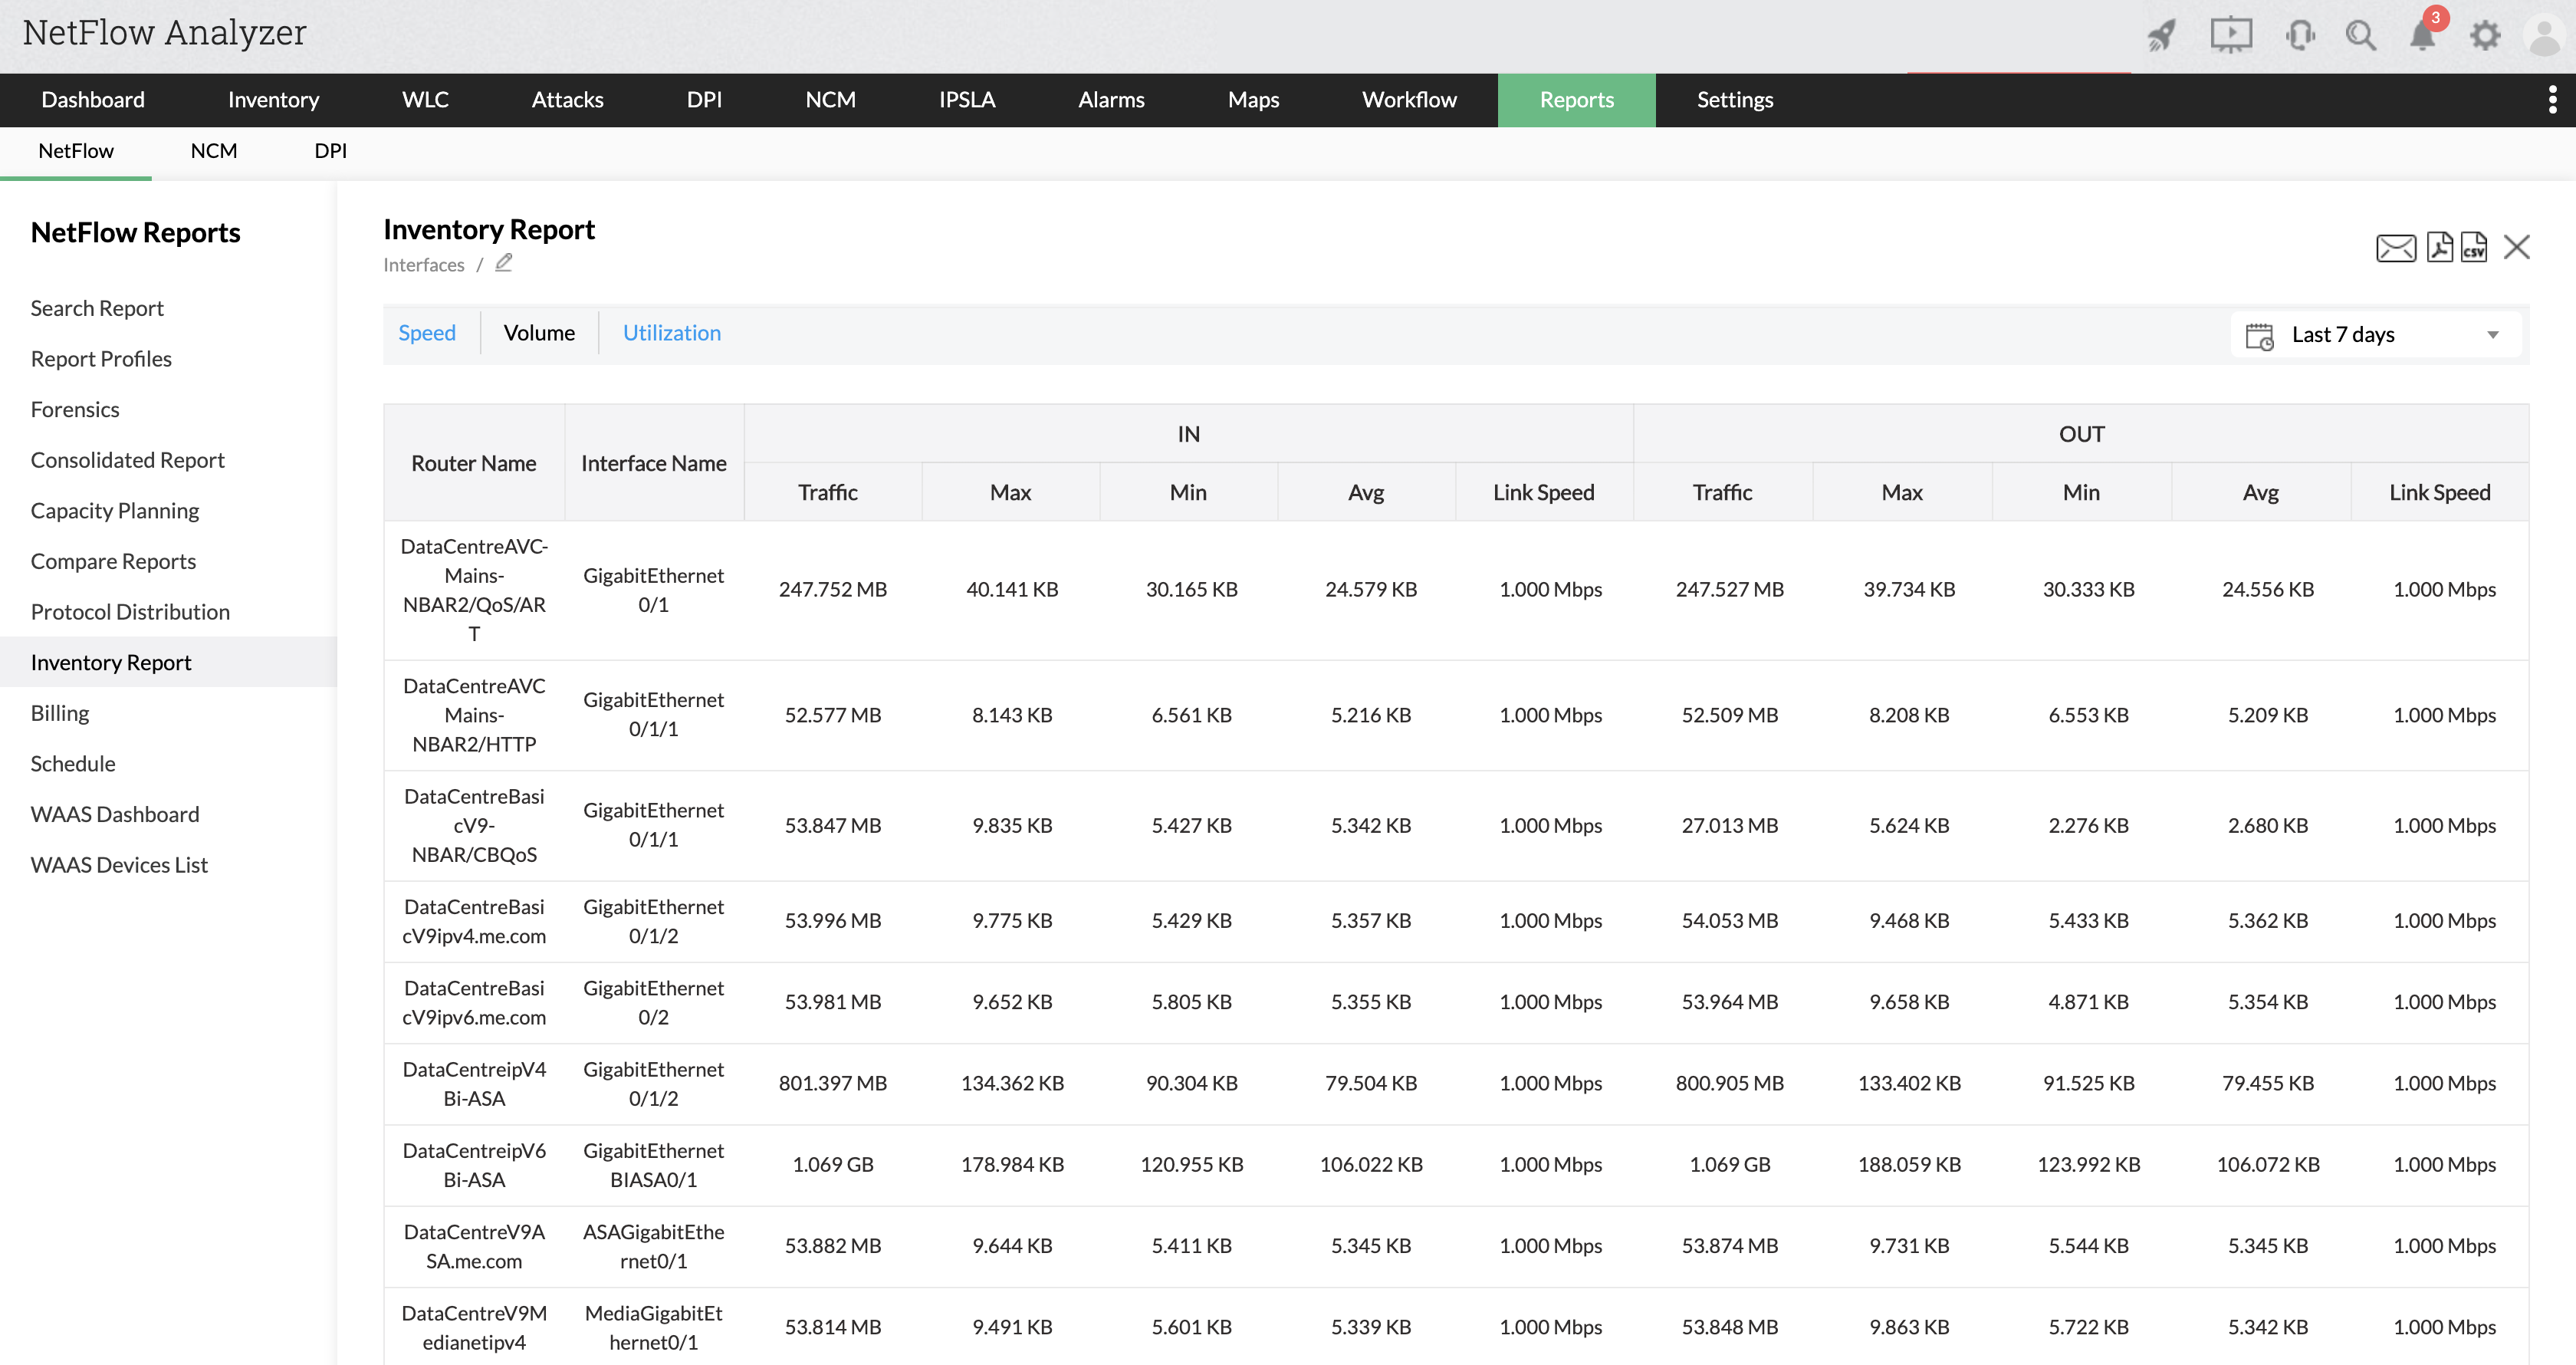
Users can now schedule and monitor in-depth interface details on the go with the new Inventory report! Get deeper visibility into your network interfaces and track down anomalies faster.
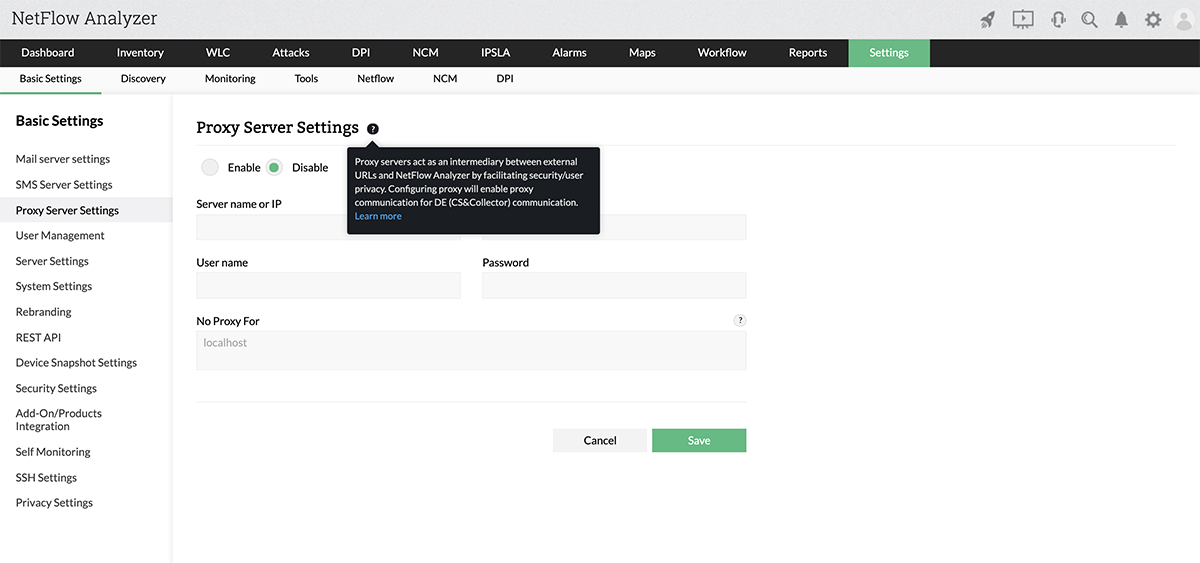
NetFlow Analyzer UI gets a new look with the horizontal tab view and we've added help tips for every Settings page, making our user-friendly UI even more user-friendly.
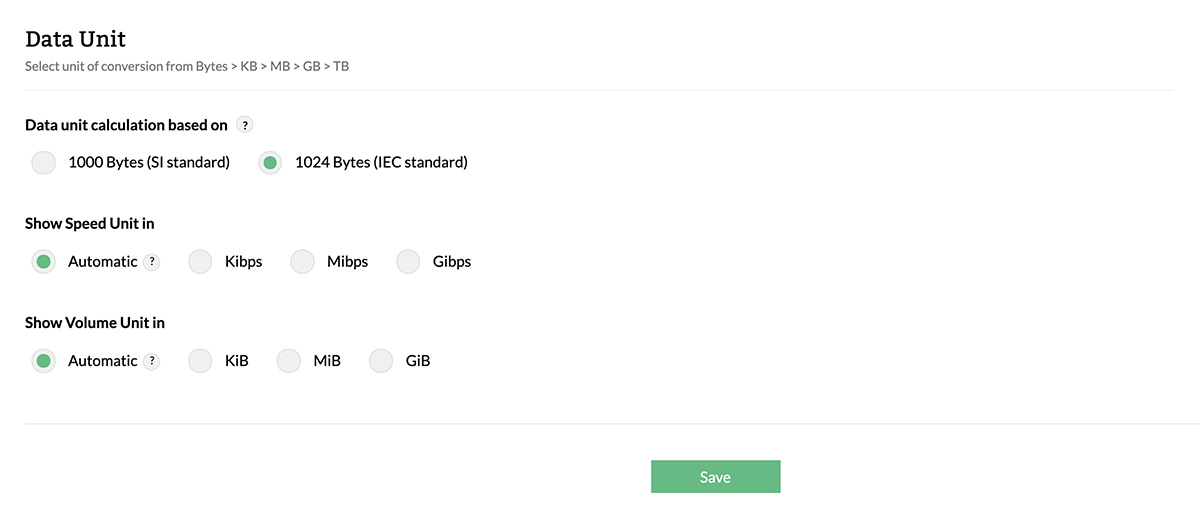
NetFlow Analyzer now supports user-defined data units based on industry standards for speed/volume-based graphs.
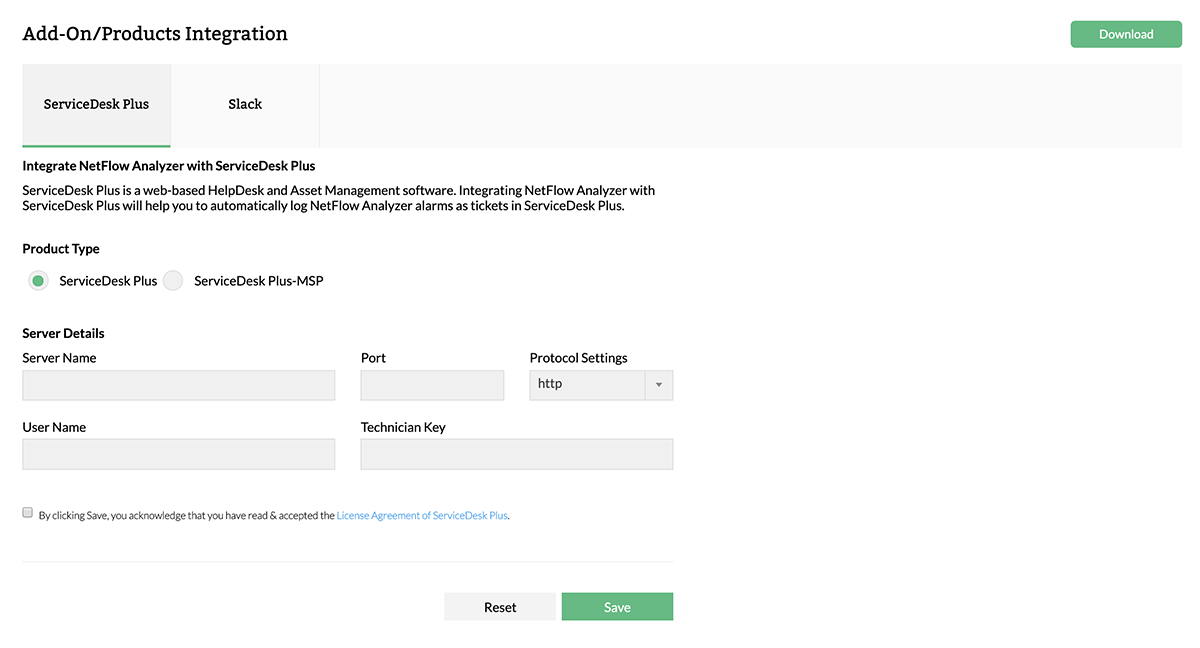
You can now log ServiceDesk Plus and ServiceDesk Plus MSP tickets for alerts which can be auto-assigned to any technician, making troubleshooting easier.
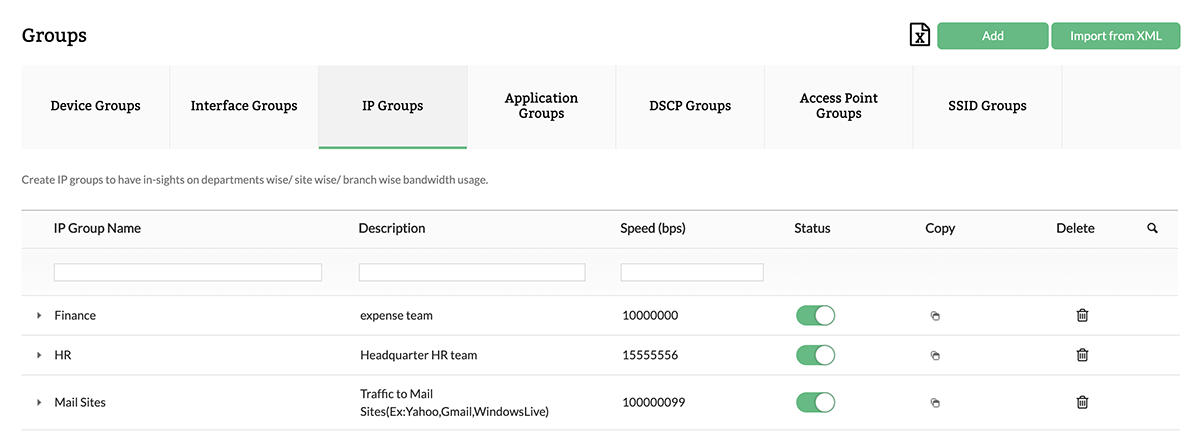
You can now generate criteria-based search reports for interface and IP groups.
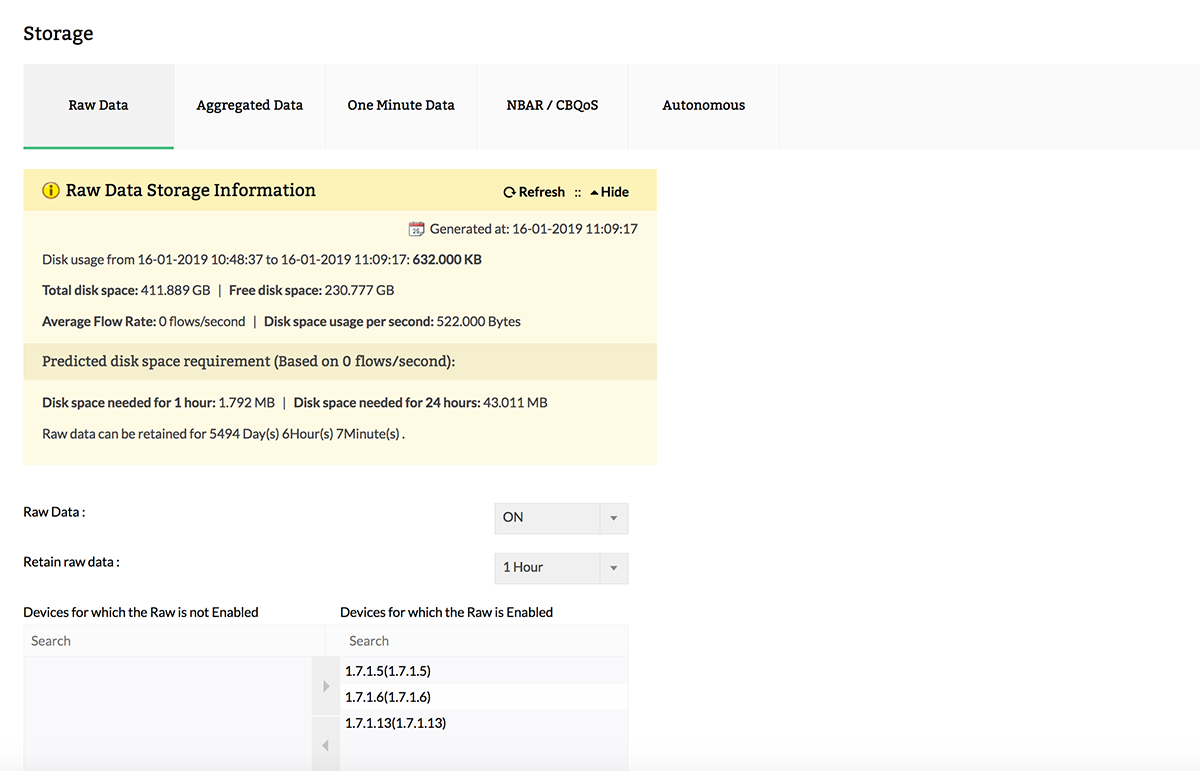
You can now calculate the estimated raw data retention period based on your free disk space.
Over 40 new devices have been added to the configuration database, making direct flow export quick and effortless.
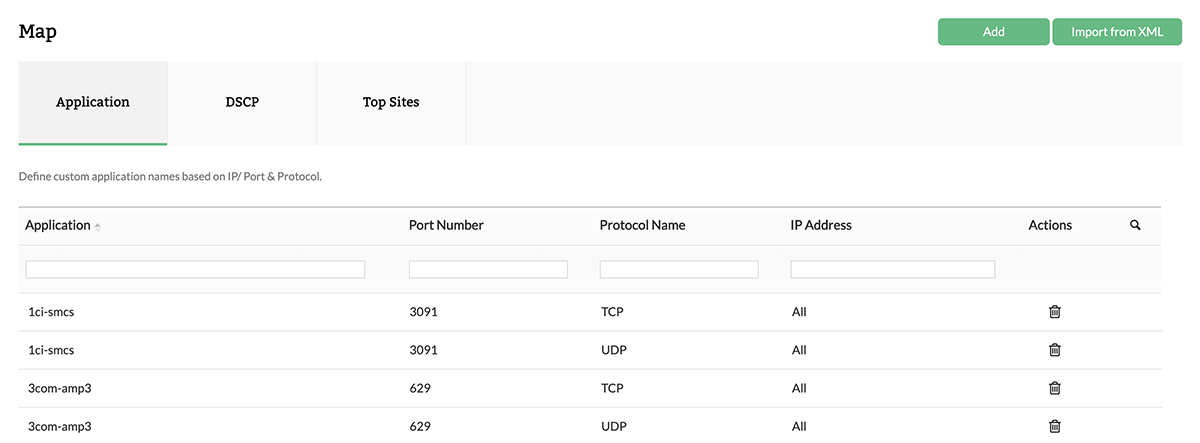
Bulk load option to upload multiple unmapped applications and IPs is introduced in Application Mapping and IP groups.
Schedule traffic reports on a single-click with the one-click schedule option