How OpManager Enterprise Edition operates
The Enterprise Edition is suitable for large organizations that have its networks spread globally. It follows the Central-Probe architecture and presents the monitored information of an entire distributed network in a Centralized console.
The Central server facilitates centralized network adminstration. It gives an overall picture of the entire network's performance in a single console by collecting data from the Probes. The Probes are installed in the geographically distributed individual networks (that are a part of the enterprise network) and monitors them. They relay the monitored data to the Central.
To ensure seamless connection the status of a Probe is updated to the Central for every 60 seconds and this duration is known as the heart beat interval between the Central and a Probe.
Central
The Central server has the consolidated information of the entire network that is spread across different locations and managed individually by the Probes. The total number of Probes depends on the number of locations and the size of the individual networks.

The Central collects the data from all the Probes and allows the user to have a holistic view of the entire organization's network.
The following set of information is updated in the Central by a Probe:
- Devices discovered
- Details about alarms and events.
- Status updates
Configuration changes done on the Probes will get reflected on the Central; for example when a new monitor/trap processor is added in a Probe the change will be updated in the Central. And this change in the Central is in turn applied to all other Probes.
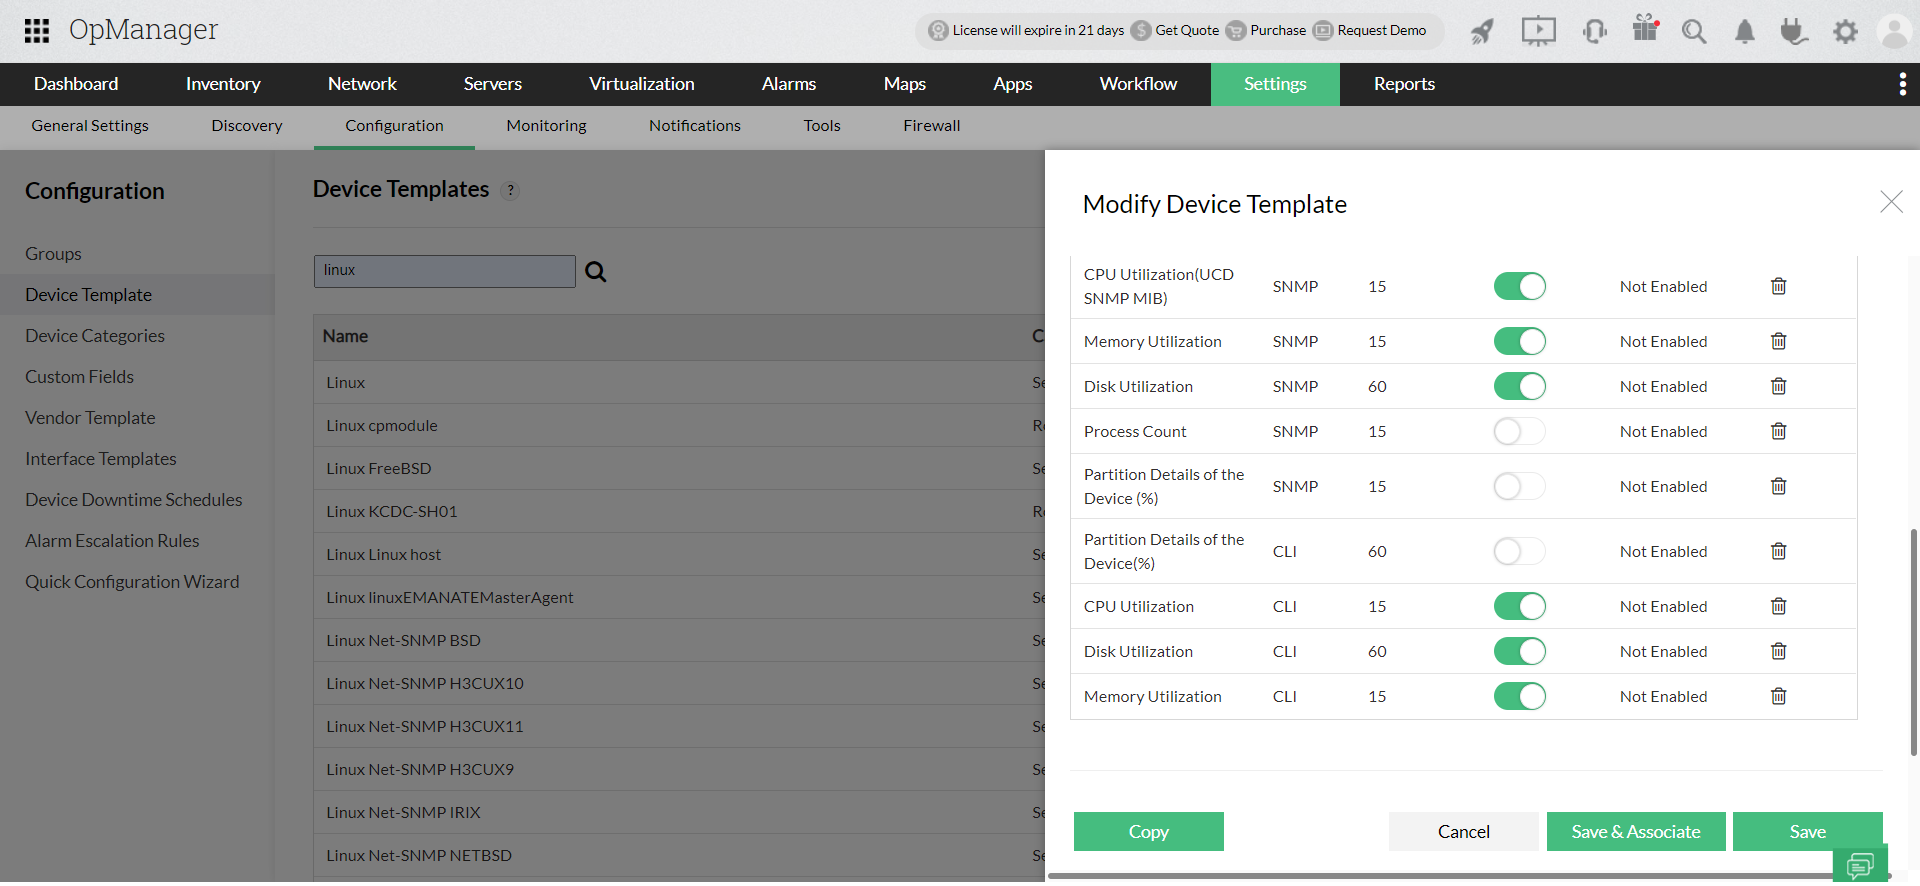
Also certain high level configuration changes like device template modification, done in the Central will be updated in all the connected Probes.
Probe
A Probe is the monitoring server for a particular network location. It discovers and monitors the devices only on that particular network for performance and availability. Devices and interfaces in the network are automatically discovered, moreover, users can add devices as well.
The Probes automatically associate monitors to a device based on the in-built device templates (each device model has a unique device template), and begins monitoring the device for performance.
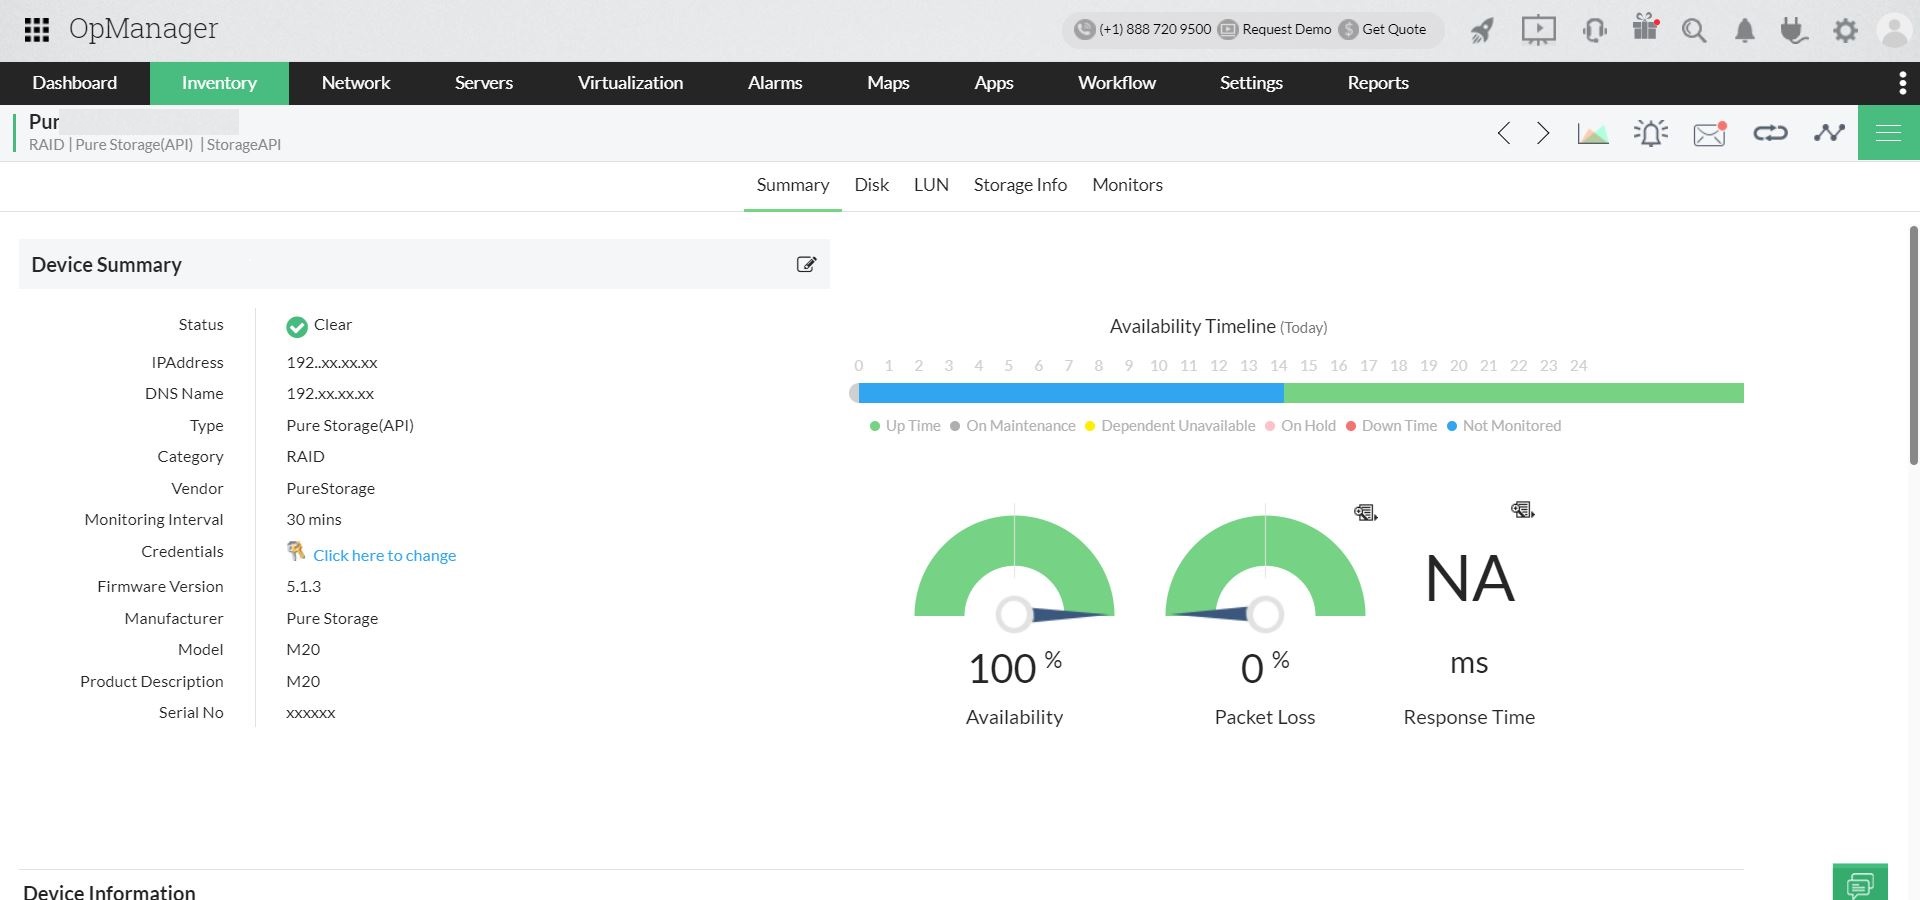
The monitored information of a device/interface can be accessed on the snapshot page. To access the device snapshot page, navigate to Inventory → Devices and click on the required device to access that device's snapshot page. It lists information on device availability, response time, monitors associated and all needful information.
The monitored data on network performance and availability from all the Probes is collectively available in the Central and can be accessed under Reports. There are over 100 in-built reports that offer insights into the historical data. Analyzing them enables users to identify KPIs and prevent impending faults.
A Probe also has network fault resolution capabilities. When a device violates the specified threshold value for an associated monitor, it raises an alarm to indicate the IT admin; the workflow feature allows users to perform some routine corrective actions performed after a fault.
(All the information given above applies only to the network monitored by a Probe.)
Key features of OpManager Enterprise Edition
- Monitors geographically separated networks
- The Central-Probe architecture in the Enterprise Edition enables users to monitor remote networks that are available in multiple sites.
- Seamless data synchronization between the Probes and the Central
- High Availability
- The failover support, offered in the OpManager Enterprise Edition ensures maximum availability, giving no leeway for network downtime.
- Real time Alerting from multiple sites
- Details of alerts raised in the Probes for network bottlenecks can be seen in real time on the Central server.
- Intuitive and consolidated reports
- Monitored data stored as reports gives insights on network performance and fault causing trends to fix network issues proactively.
- Central offers a consolidated view of all reports available in Probes.
- Privilege-based user management
- User management in the Enterprise Edition allows you to define user rights (administrator/operator) to members of the IT administration team ensuring enhanced security. Learn more.
- Scalable
- Easily scalable and enables customers to add devices without facing a decline in the monitoring capabilities.
- Perf Group
- The Perf Group option enables you to group common performance monitors. In the Enterprise Edition, the groups you create in the Central server will be pushed to the Probes as well.
Enterprise Edition licensing
The OpManager Enterprise Edition licensing is based on the the number of devices. A significant aspect of this license is that:
- The license purchased for monitoring devices through the Central applies to all the Probes as well.
- Learn about minimum system requirements and installation process of OpManager Enterprise Edition.
- You can also change the Probe name from the Central's UI. (This applies to versions with Build number: 125329 and above.)
Not an OpManager user, but interested? Get a quote here!