Monitoring CPU, Memory, Disk Using SNMP
OpManager helps you monitor the performance metrics of any device that supports SNMP. The monitors for CPU, Memory, and Disk Utilization are automatically associated for the SNMP devices based on the device template definitions.
For example, consider you've associated SNMP-based monitors to the default template for a server type (say Linux) in OpManager. So from then on, all Linux servers discovered into OpManager will have those SNMP-based resource monitors associated by default. This doesn't apply only for just one device category, but these definitions can be used to associate related monitors to any SNMP-enabled device.
If you do not see these monitors associated to the devices, it could be due to any or all of the following reasons:
- Monitor absence: These monitors may not be present in the device template.
- SNMP Disabled: SNMP may not be enabled on the device. In such case, enable SNMP and add the monitors to the device once again.
- Incorrect Credentials: Incorrect SNMP credentials might be associated. Check the credential details like the SNMP version, community string etc.
Steps to add the monitors to the device once again
Monitors can be re-associated to the devices in the following ways.
1. From Performance monitor settings page
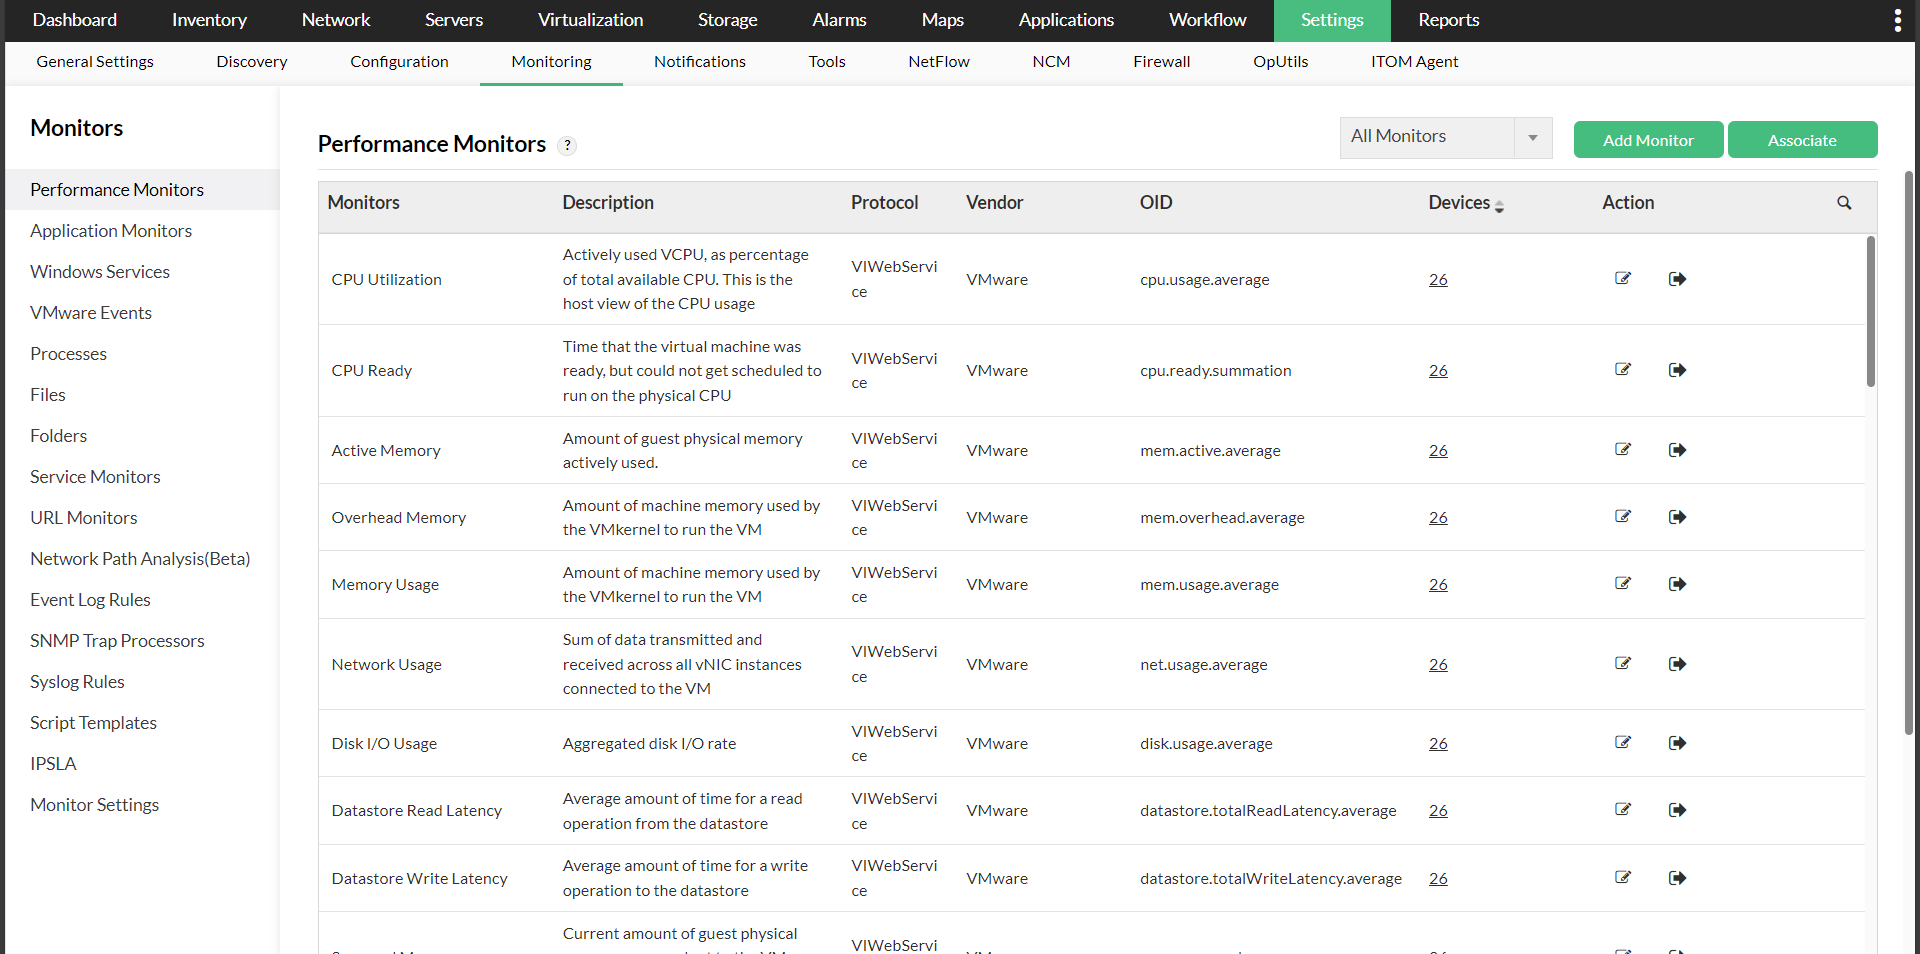
- Navigate to Settings -> Monitoring -> Performance Monitors.
- You can find all the SNMP monitors listed down.
- To associate a monitor to device(s), go to the respective monitor and click on the associate button that is found under the actions column. You can also click on the "Associate" option on the top right corner and then select the monitors and devices in subsequent steps to associate monitors with devices.
- Now, select the devices from the "Available Devices" column and then move them to the "Selected Devices" column.
- Click on "Apply" or "Apply & Overwrite" based on your preference. The monitor will now be successfully associated with the respective device(s).
To know more about associating monitors with devices, refer here.
2. From Device Snapshot page
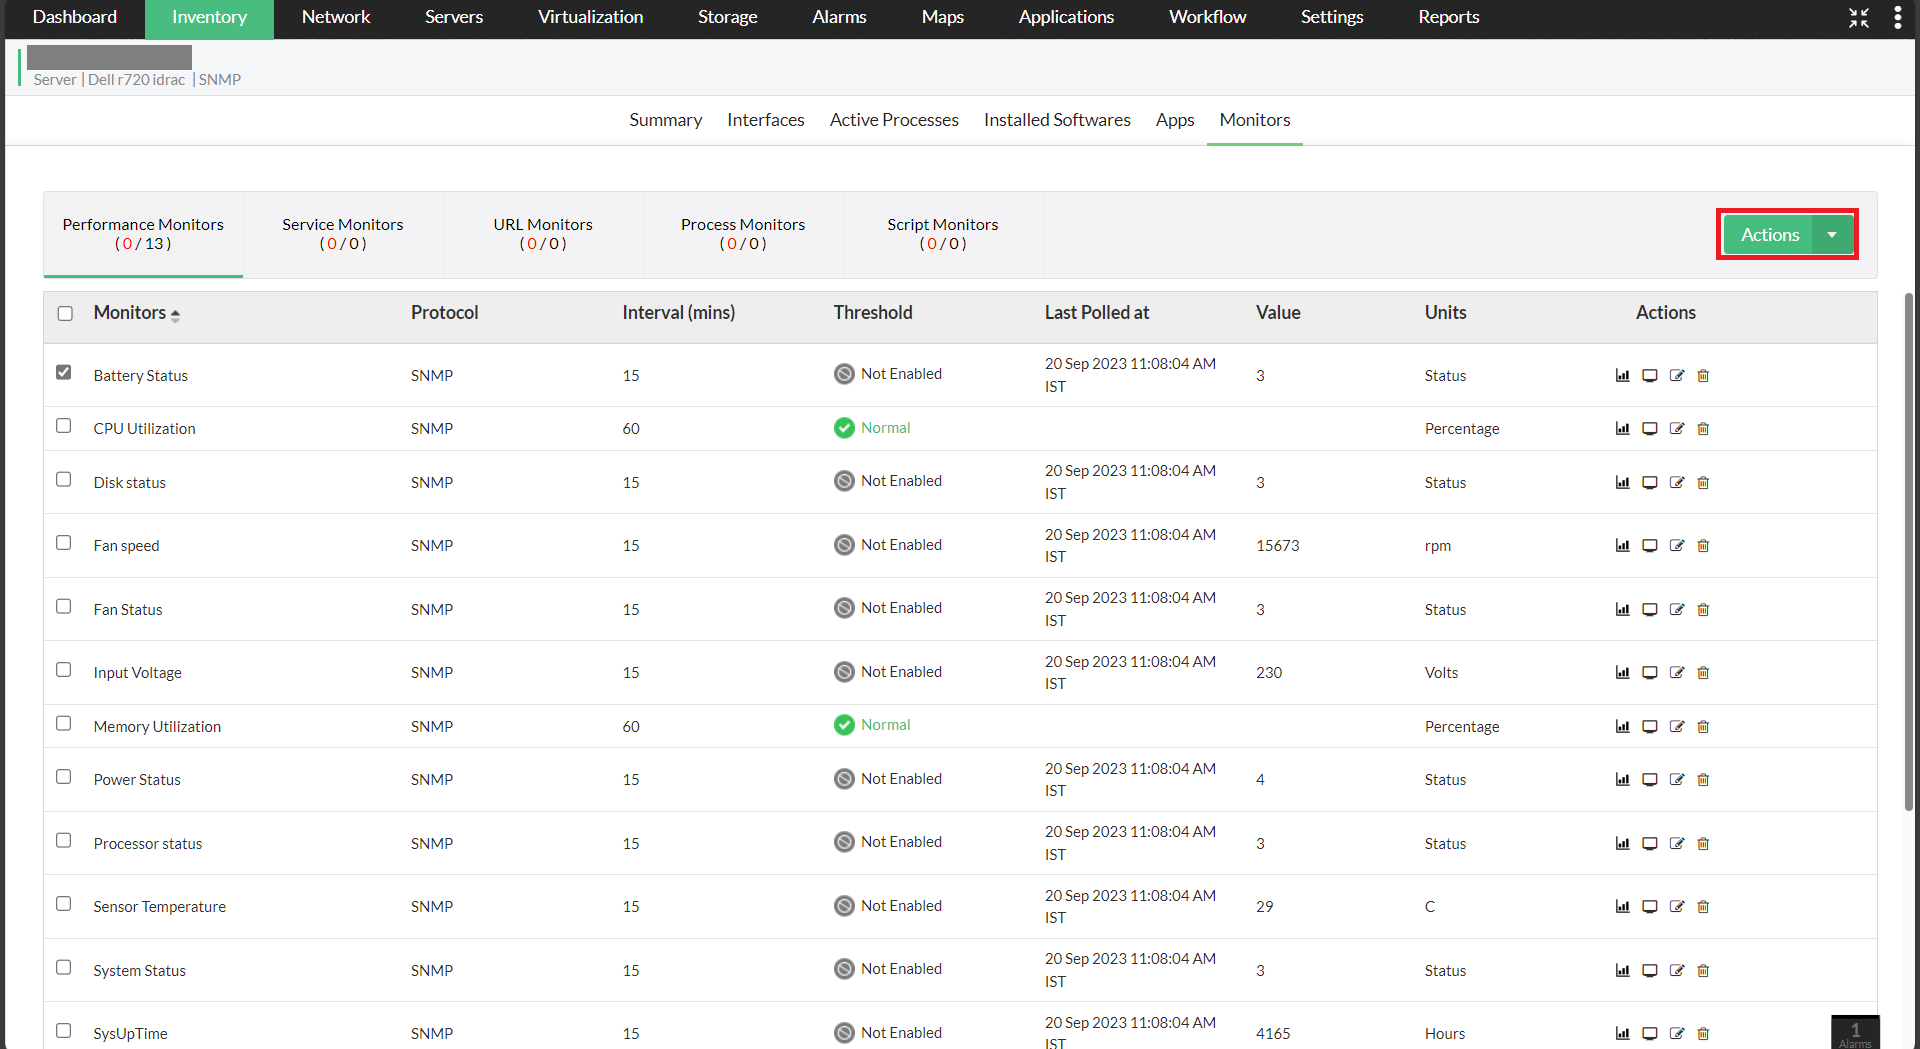
- Navigate to Inventory -> Devices and then click on a device to open its Snapshot page .
- Open the Monitors tab. Under the Performance monitors section, click on the "Actions" button at the top right corner of the page.
- Now, select the SNMP monitors for Disk, CPU and memory from the list of monitors displayed under the HOST-RESOURCES category.
- Click on "Add" to apply the changes.
3. From Device Templates
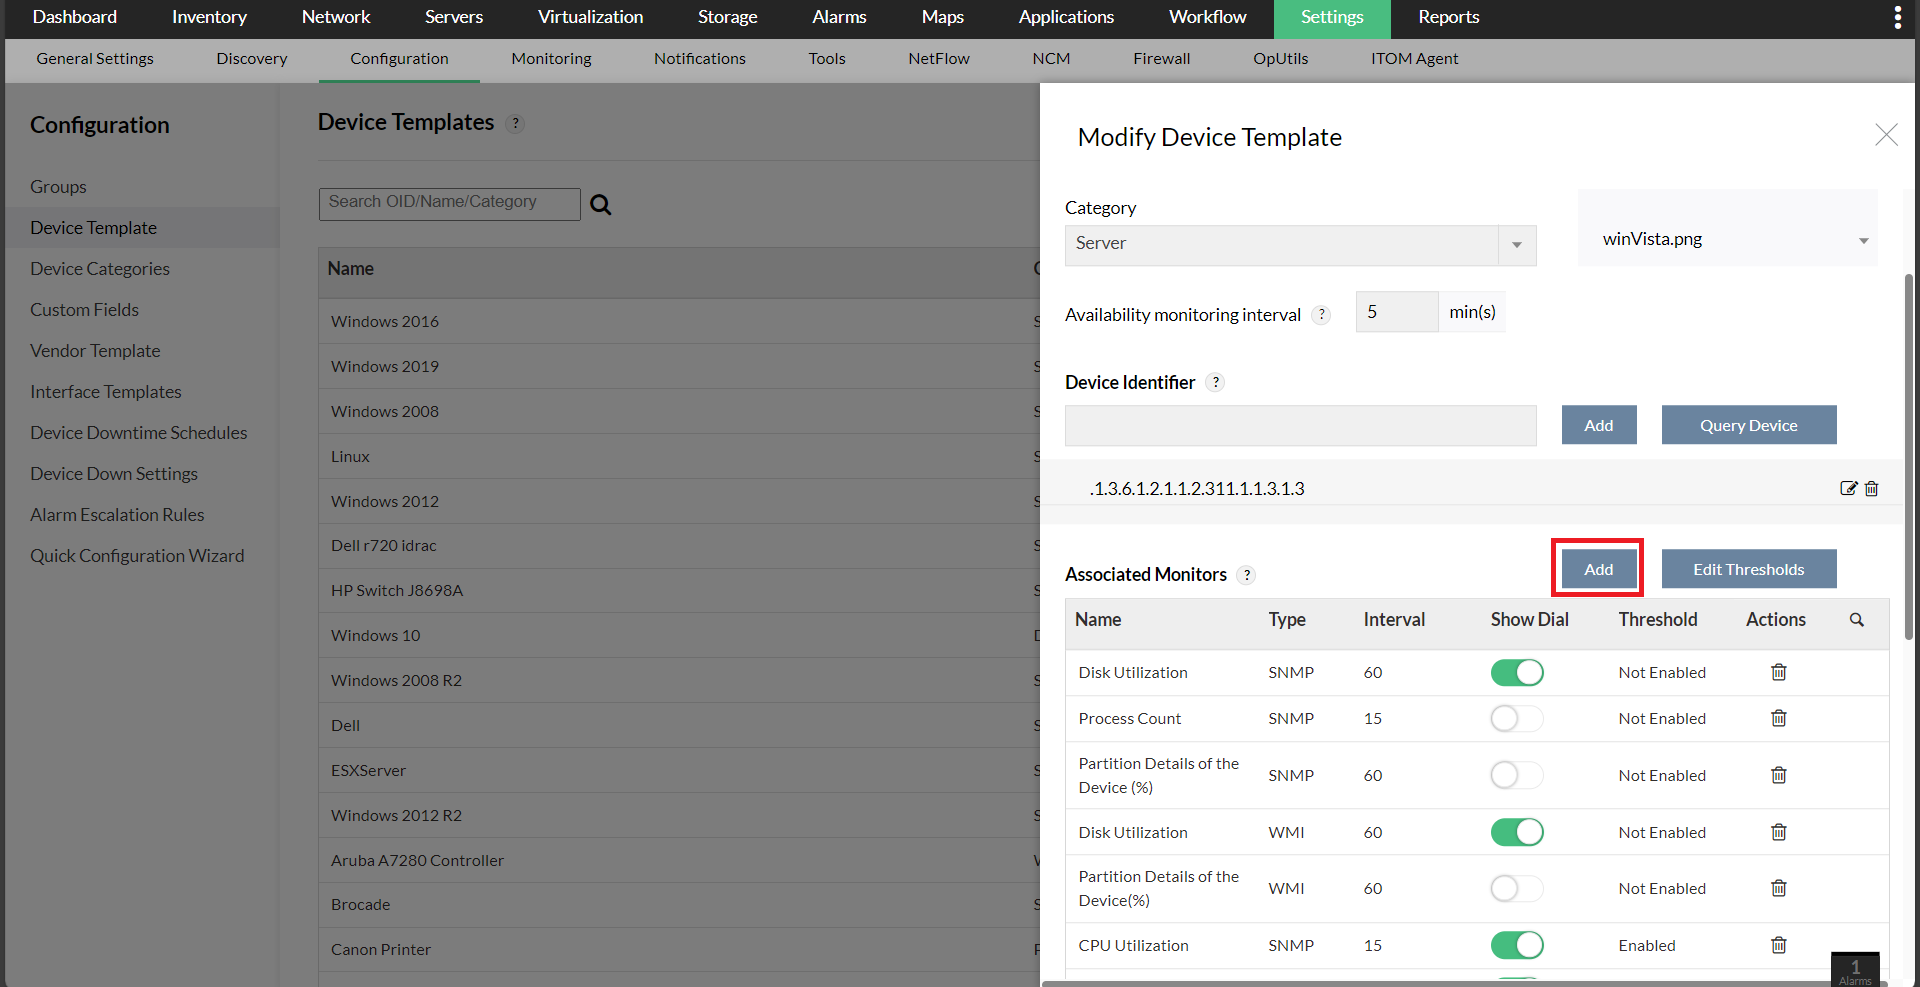
- Navigate to Settings -> Configuration -> Device Template.
- Open a template and click on the "Add" button that is found at the right of the "Associated Monitors" section.
- Now, select the monitors you want to add and then click on "Save" or "Save & Associate" based on your preference. The monitors will now be associated with the device template . Any new device about to be associated with the template in the future, will automatically be associated with these monitors.
Click here to know more about adding monitors.
To check if the SNMP agent in the device returns response, try the following:
- Click the Test Monitor icon against any of the associated monitor names. It does a dynamic query to the device for the value of the selected resource, and show the data.
- Incase the agent does not respond, you see a message to this effect.
- Refer to the troubleshooting tips to resolve the issue.
It is recommended to use WMI or CLI to monitor Windows or Linux devices respectively. But if both these protocols aren't available or if you want to monitor additional metrics using SNMP, you can also do that in OpManager.
Adding a Custom SNMP Monitor Using OID
If the built-in SNMP monitors do not cover a metric you need, you can add a Custom SNMP Monitor by specifying the OID directly. With GenAI enabled, use the Get OID Details option on the Add Custom SNMP Monitor page to look up the OID without leaving OpManager. Describe the metric in plain language and OpManager returns the OID, MIB name, and a brief description, ready to use in the formula field.
Note: Available from OpManager 12.9.120, the Get OID option requires a GenAI integration under Settings → General Settings → Integrations → GenAI. Also ensure that the Performance Monitor Generation option is enabled under Settings → AI Settings.
Steps to add a Custom SNMP Monitor using Get OID Details
- Click Actions → Add SNMP Monitor and select the target device. The Get OID Details option appears next to the device selection field.
- Click Get OID Details and describe the metric you want to monitor. Include the device type or model if known — OpManager passes this to the AI provider to improve accuracy. The description should clearly name the metric; vague or unrelated input will not return an OID.
Example:Interface input error rate on a Cisco Catalyst 9300 - Review the returned OID, MIB name, and AI summary, then click Use this OID to populate the formula field.

- Click the Query Device icon to verify the OID returns a valid response from the target device, then save the monitor.

If no OID is returned
- Read the reason displayed and adjust your prompt accordingly.
- Be more specific — include the device model, vendor, or exact metric name.
- Click Fetch Again to submit the revised prompt.

If no OID can be found after refining the prompt, it may be because the vendor's MIB documentation is restricted or the SNMP object cannot be identified with confidence. Refer to the vendor's MIB documentation directly or contact Support.