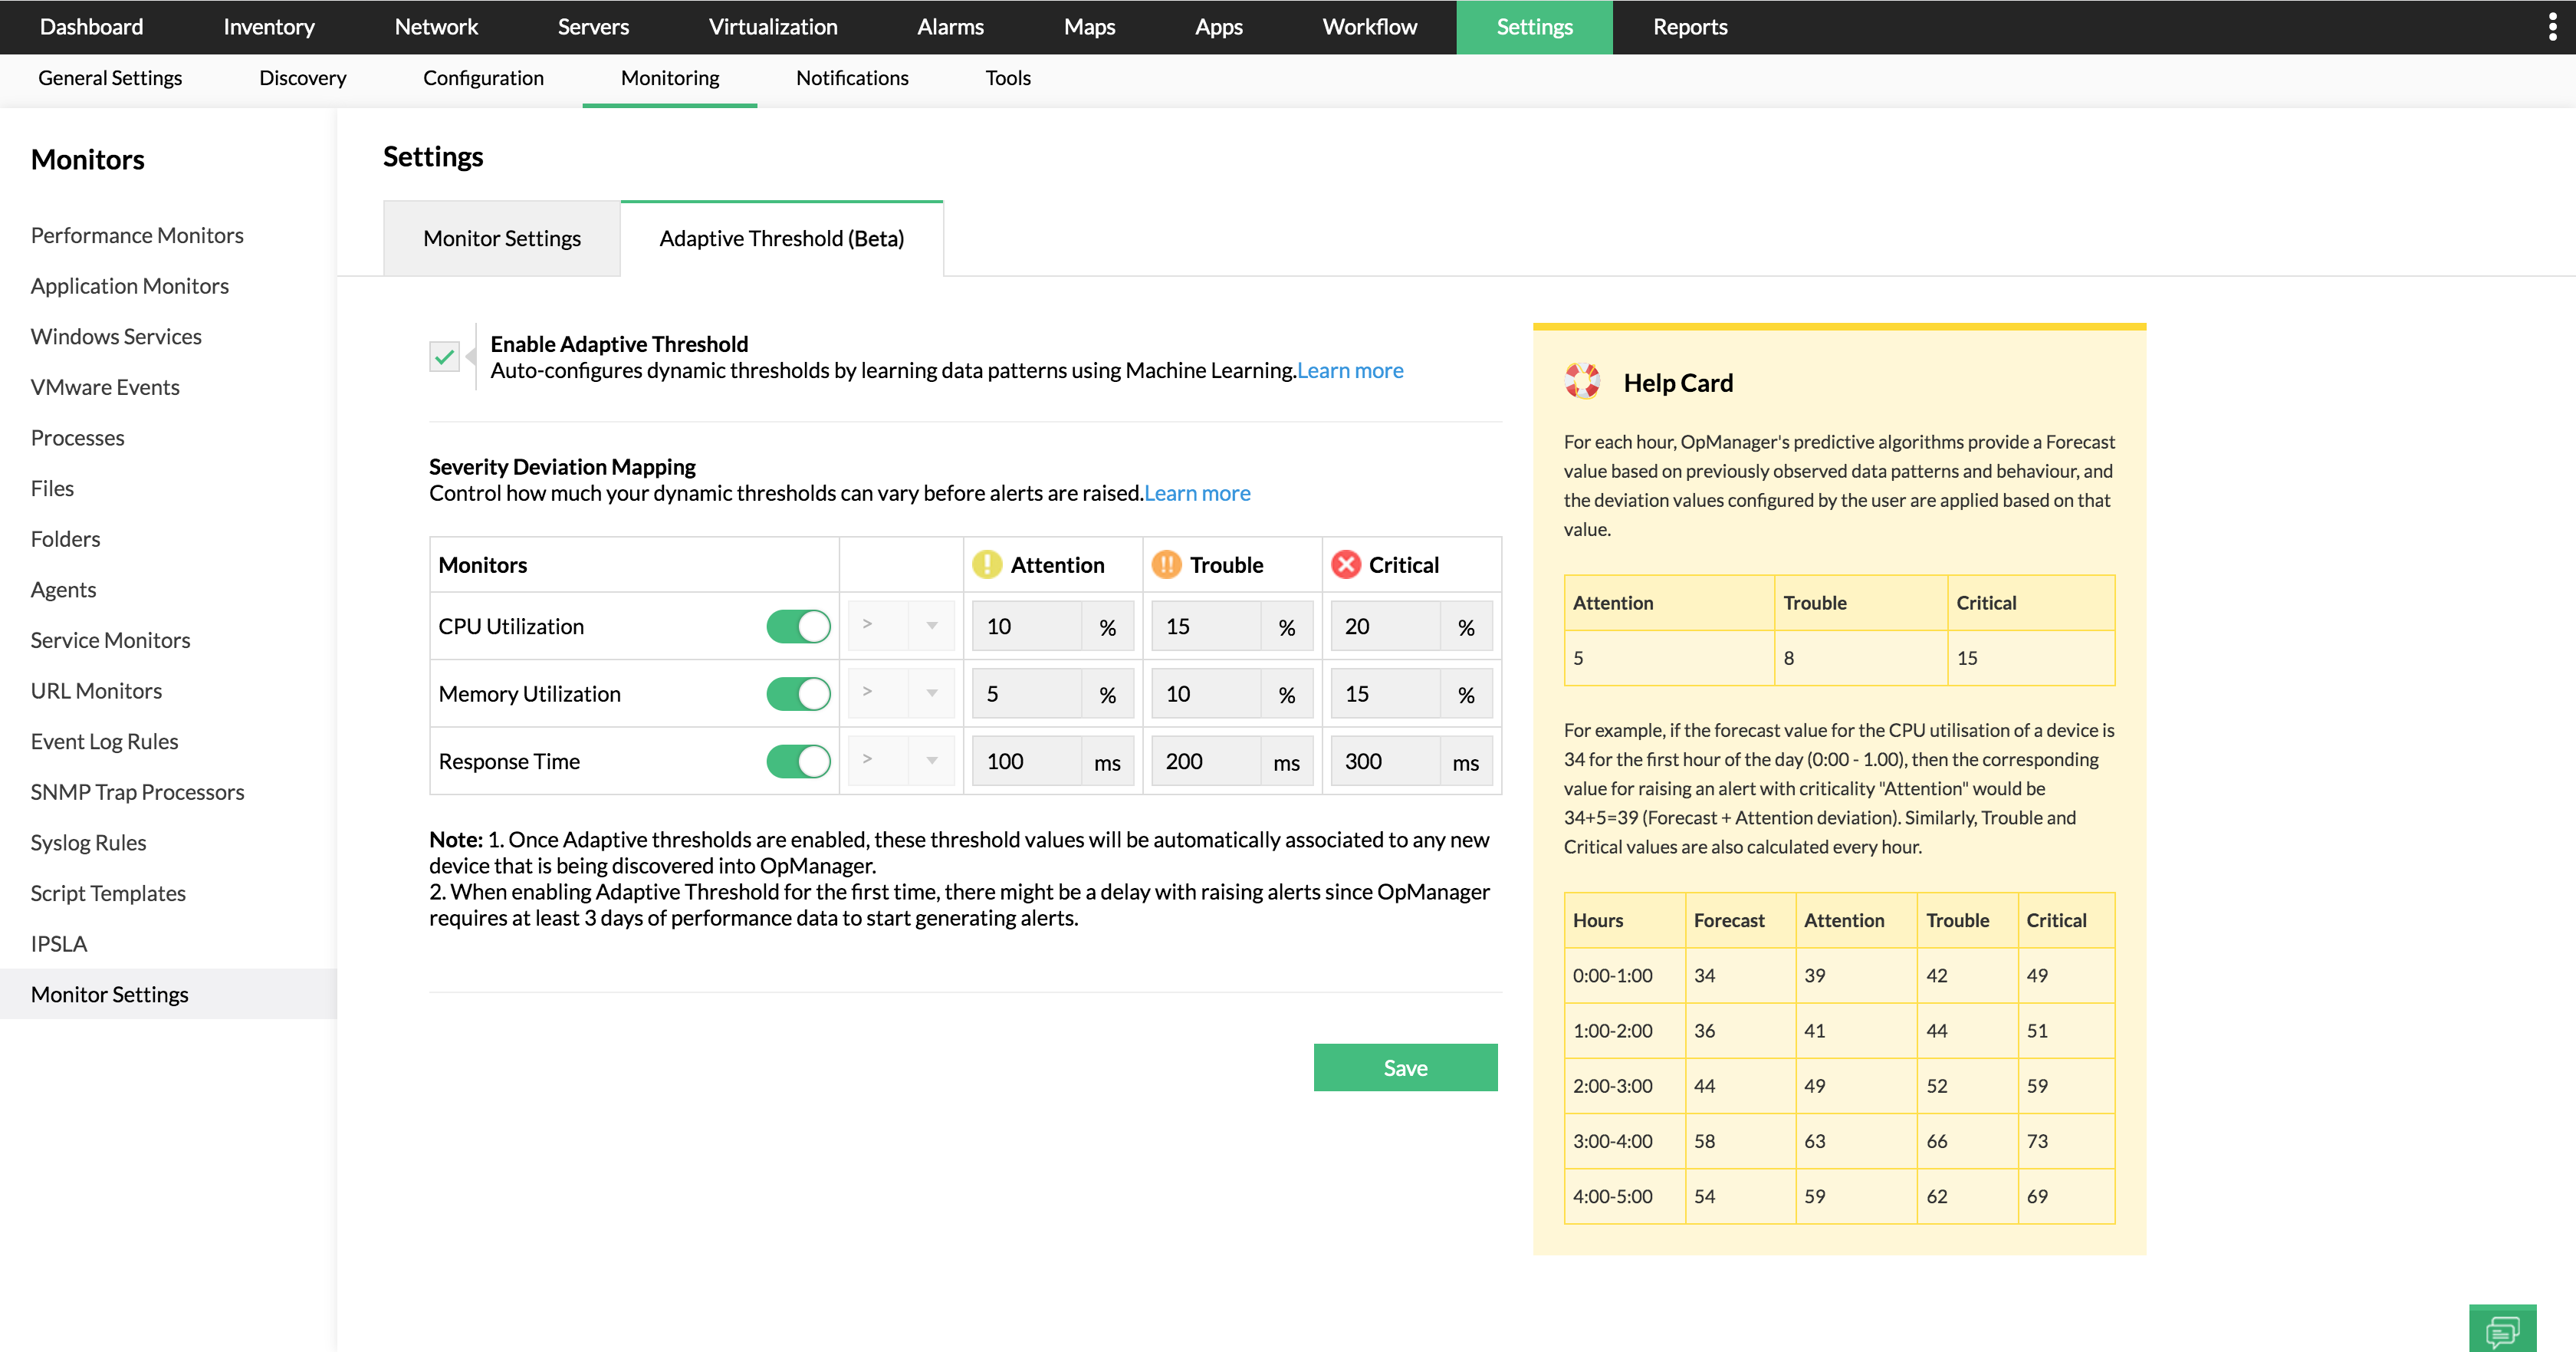
Adaptive thresholds
Forget the woes of manually configuring threshold values for critical performance monitors of CPU utilization, memory utilization and response time, with OpManager's AI and ML-based automations.
Know how
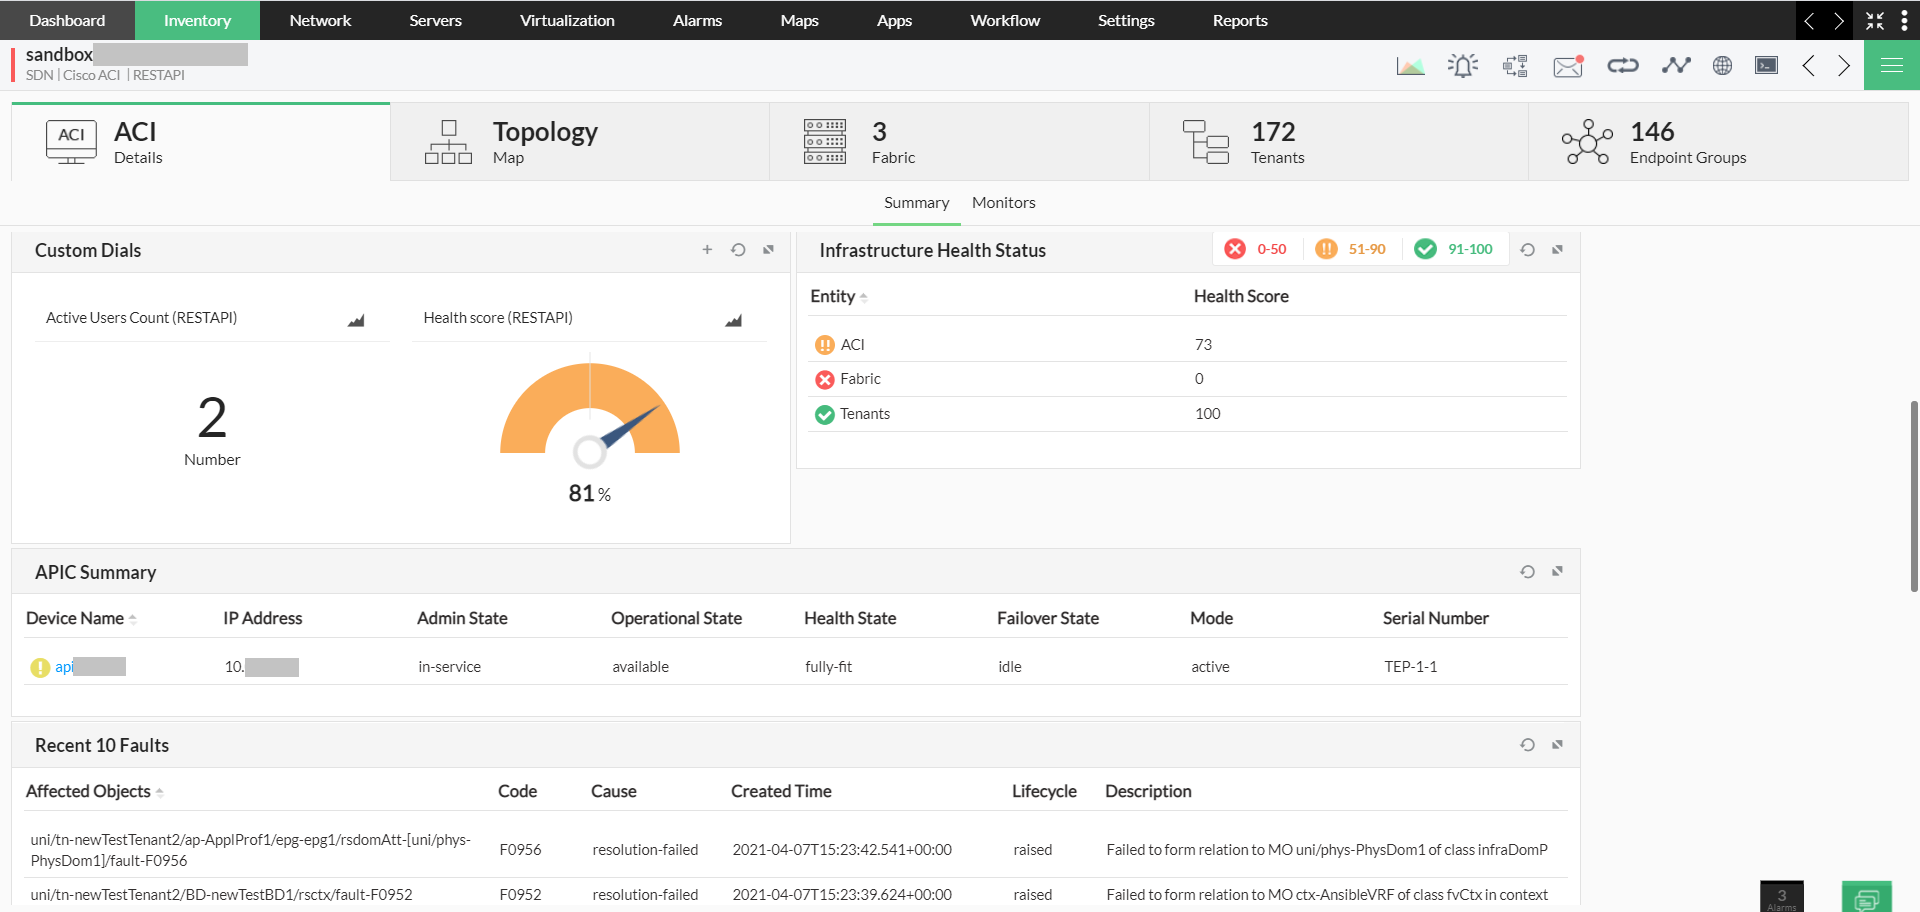
Cisco ACI
From gaining in-depth insights into Cisco ACI device, fabric, tenants, and endpoint groups to quickly glancing through the entire ACI environment with dedicated dashboard and topology mapper, keeping in check the Cisco ACI infrastructure is now that easy with OpManager!
Learn more
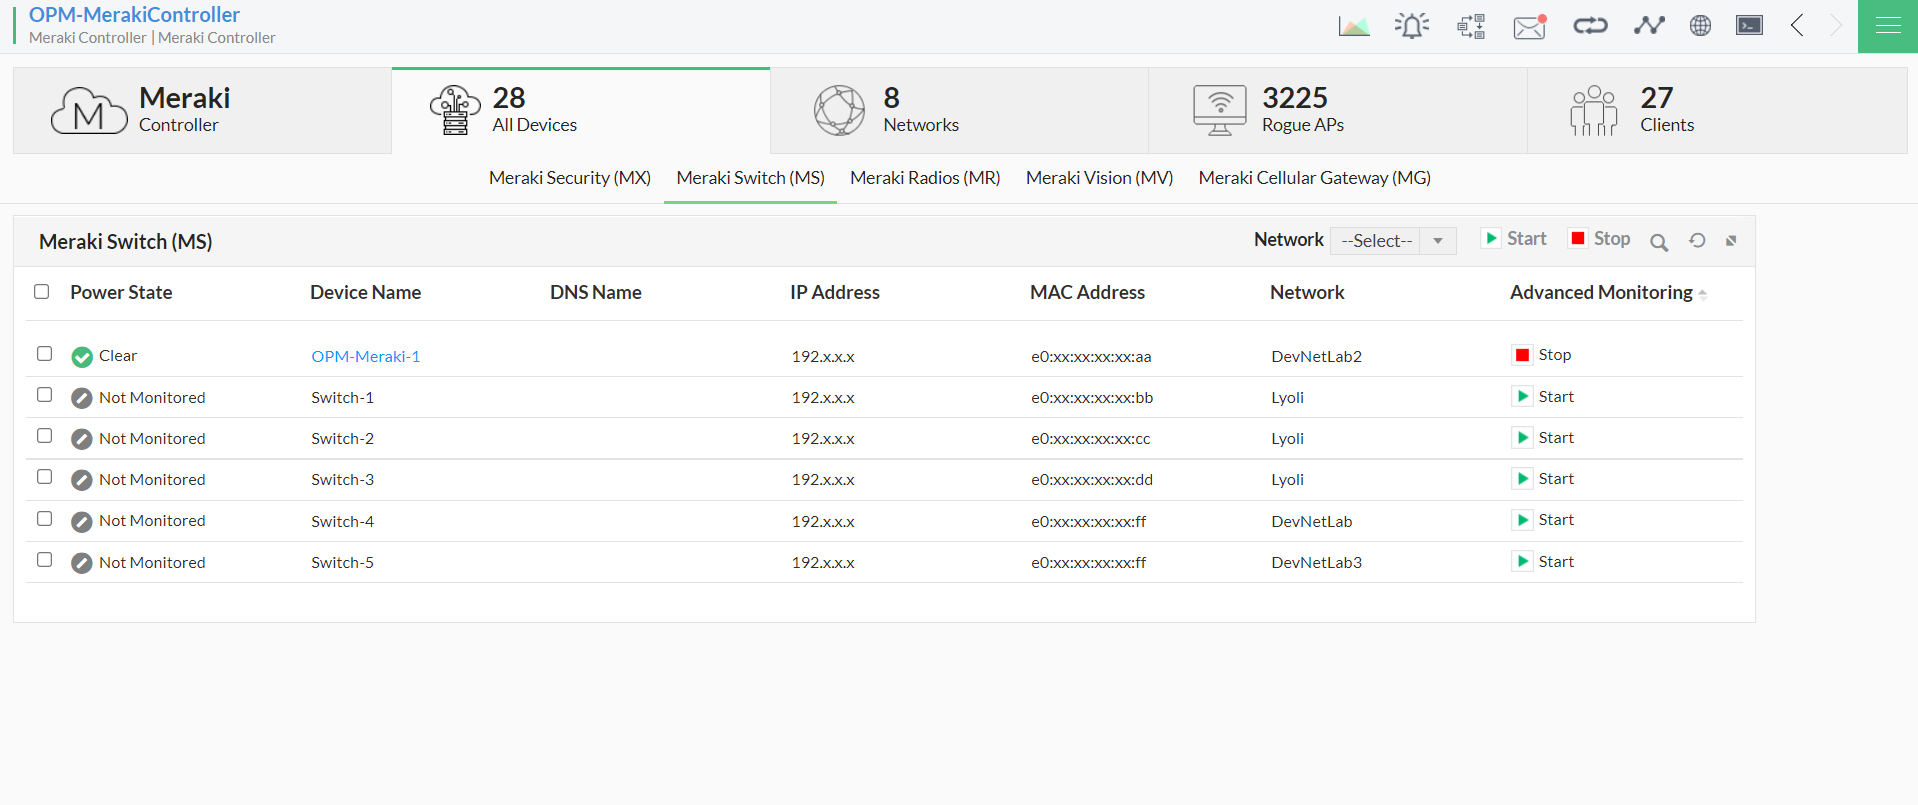
Cisco Meraki
Manage multiple networks, access points, clients, ports, nodes, SSIDs, rogue APs, and end devices such as switches, firewalls, cellular gateways, radios, vision devices, all in a single console, with OpManager's Cisco Meraki monitor.
Explore more
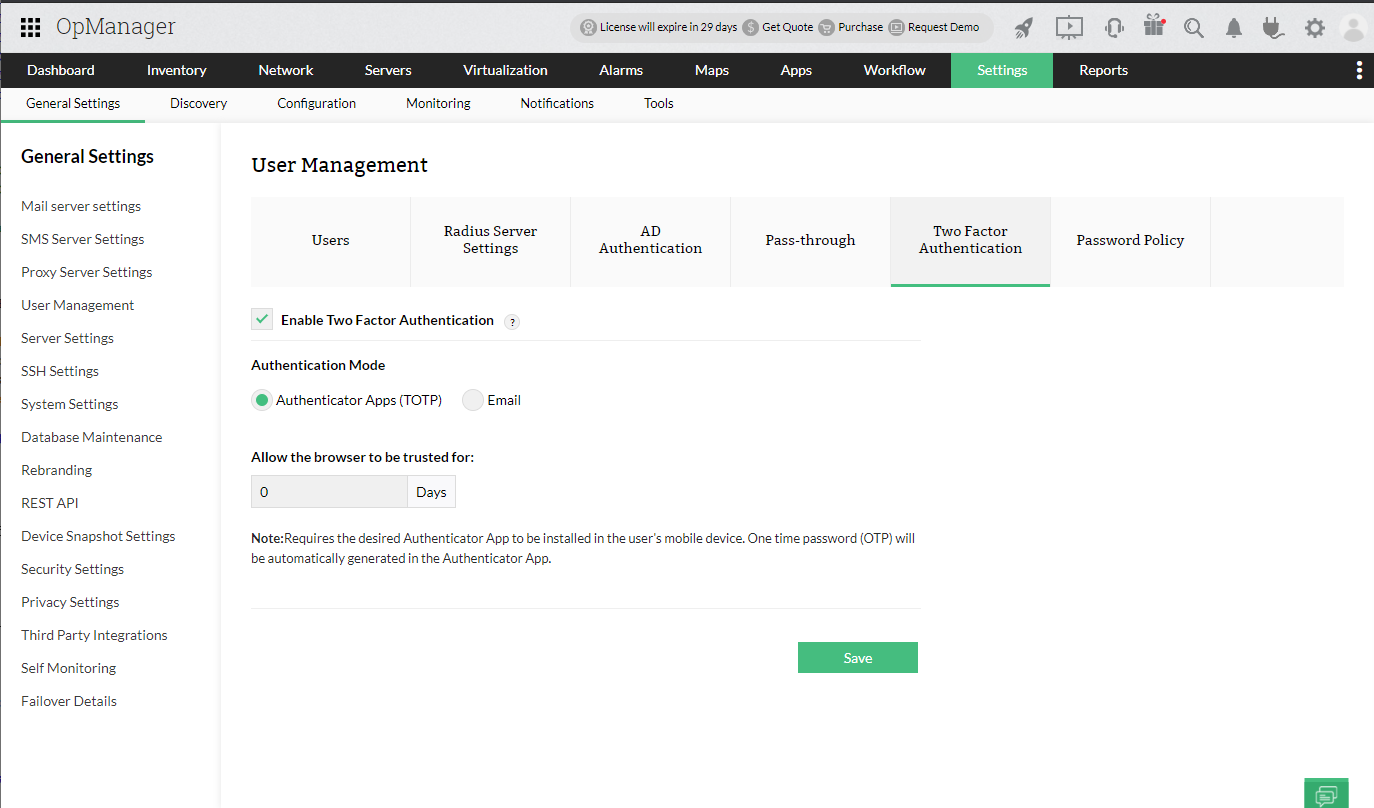
2FA
Head off unauthorized access and double protect your network by requiring the user to login only through the time-based one-time password generated either through app or the configured email. Security is no more a threat with OpManager!
Explore more
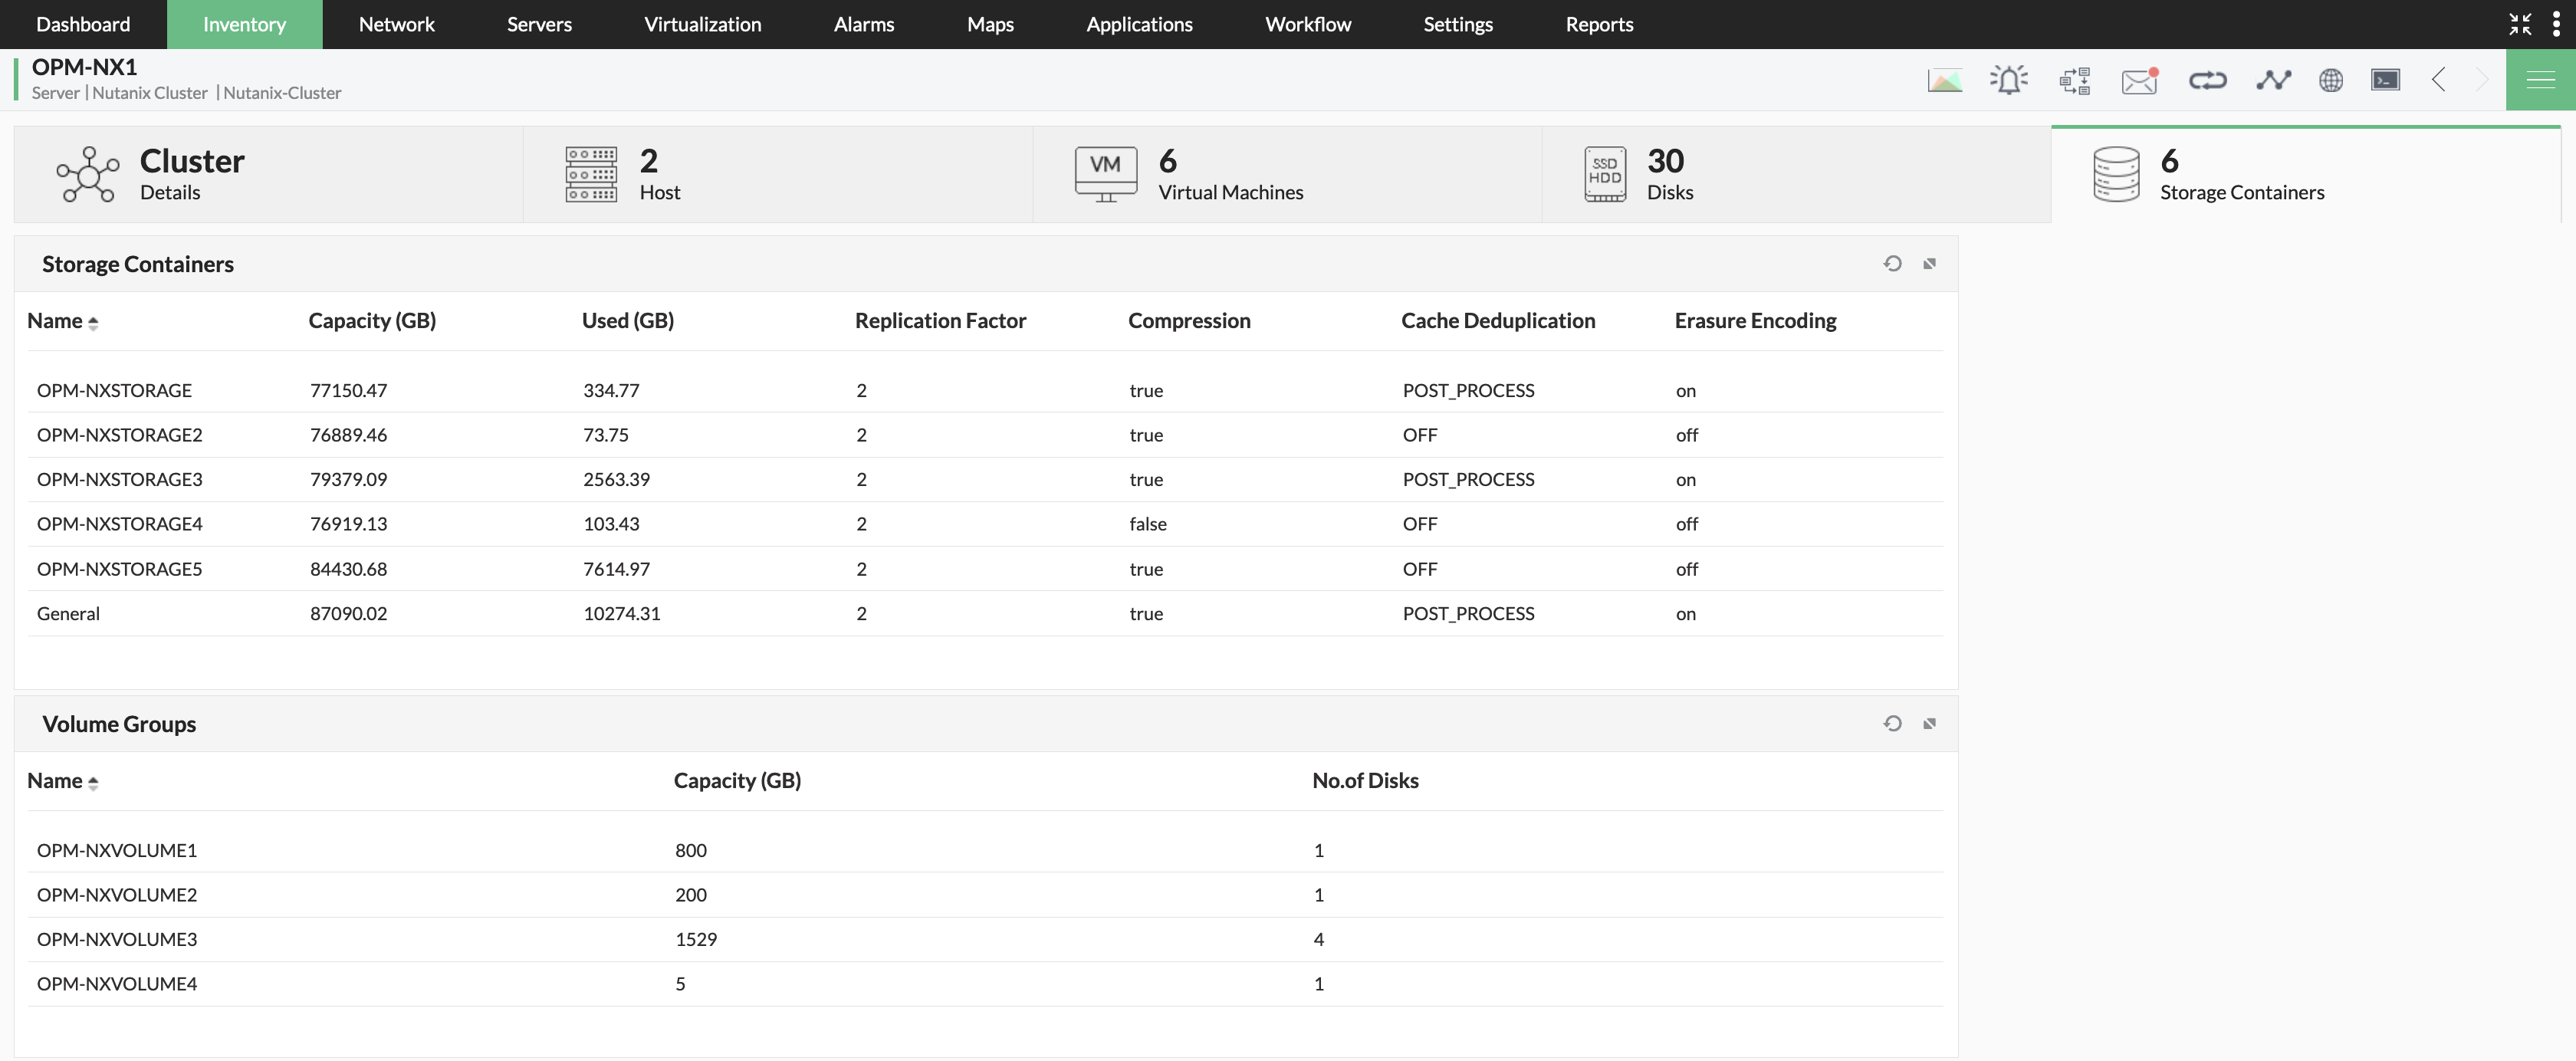
HCI
Monitor critical performance metrics like bandwidth, latency and CPU usage of HCI proactively with OpManager and manage computing and storage resources like a pro.
Discover more
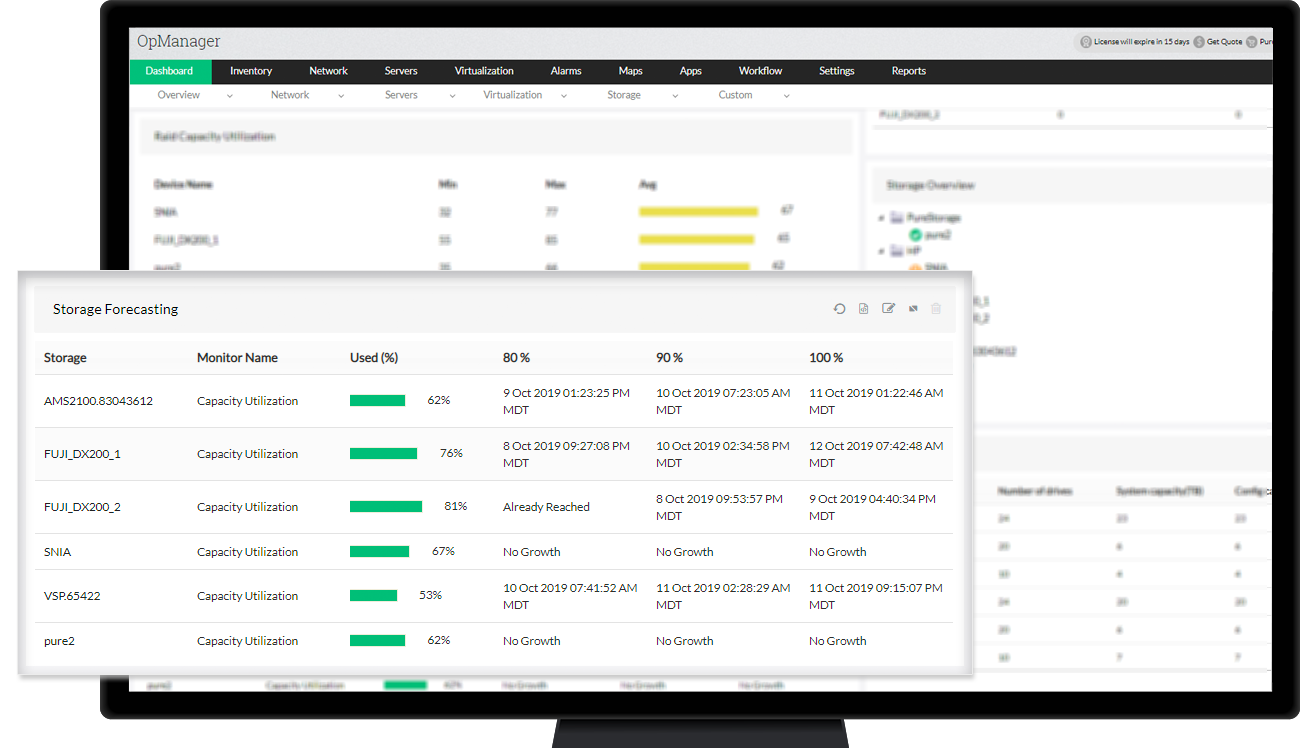
Avoid excessive and unplanned costs on Storage Devices!
OpManager provides a storage forecast report indicating current Capacity Utilization as well as predicting when the storage device would reach 80 %, 90%, and 100% of it's capacity.
Find out how
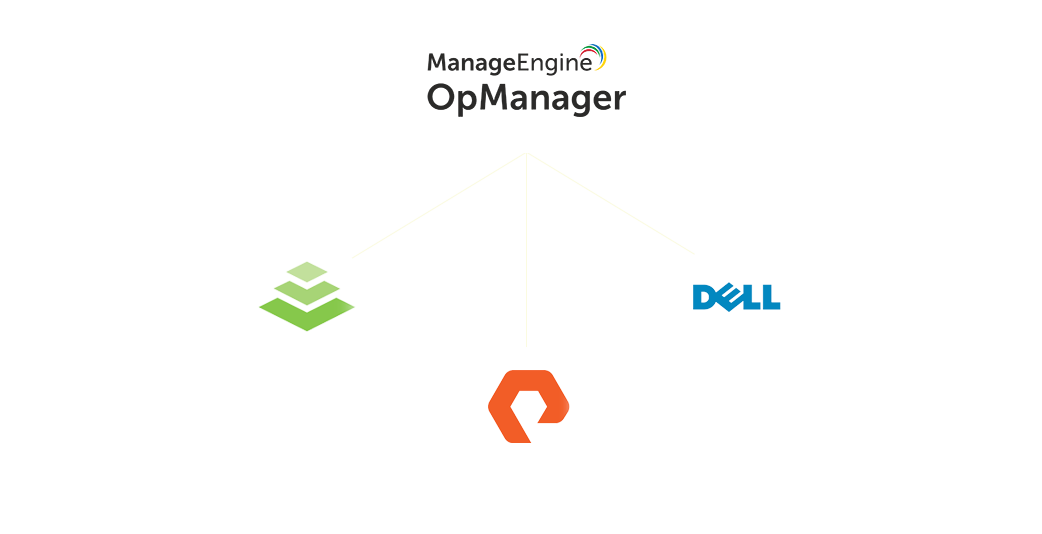
Storage Monitoring
Gain critical insights into your HPE Nimble, Pure Storage, Dell Compellent Storage, get usage forecasts and identify performance bottlenecks even before they appear with OpManager.
Learn More
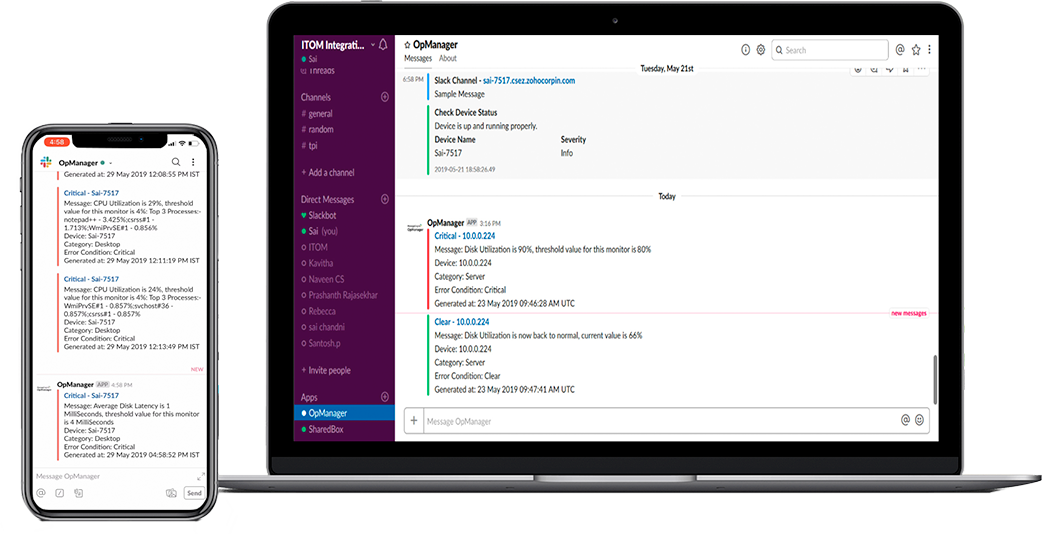
 Slack Integration
Get OpManager alarms automatically posted on Slack channel, discuss with your team and troubleshoot issues on the go with OpManager.
Learn More
ServiceNow Integration
OpManager is now integrated with ServiceNow (provided as a default plugin). This integration allows you to log tickets on ServiceNow from OPM.


User Specific Dashboard
Users will now have their dashboard mapped to their profile. This unique dashboard can be customized based on the user's needs.
Windows and Hyper-V 2019 support
OpManager has now been upgraded to support Windows 2019 and Hyper-V 2019 devices.


Add Custom SNMP Monitor
Custom SNMP monitor creation has been added now. You can create/modify device templates to configure your own monitors for the SNMP-enabled devices in your network.
9500 device templates
The number of device templates supported by OpManager is increased to 9500. They help with the initial configurations to classify the devices into pre-defined categories, and to associate monitors to them. You can modify existing templates or create your own as per your requirements.


Quick links - How-to and FAQ links in product
How-tos and FAQs are added as quick links. These are positioned in-product to assist you in operating OpManager to its fullest..
Horizontal tab GUI
To enhance your user experience, we have added a horizontal view. This user-focused design is specifically introduced to minimize navigation woes and enhance user experience.


AlarmsOne Integration
AlarmsOne is now integrated with OpManager. AlarmsOne can be used to manage all your alarms in one console. It makes alert management simple with features like criteria-based alerting, noise reduction, on-call scheduling, escalations, etc.