Network traffic patterns have witnessed numerous changes due to the increasing popularity of cloud-based applications. In a traditional network, accommodating complex network patterns and adapting to constant changes has always been a tedious task. Most organizations are now switching to software-defined networking (SDN) infrastructures, a dramatic departure from the way standard networks are designed. SDN centralizes control of your network, improving the network's flexibility and efficiency.
Application Centric Infrastructure (ACI) is Cisco's SDN architecture for data centers. Cisco ACIs take a simpler approach to manage your network, providing fully integrated physical and virtual infrastructure. ACI helps you cope with the rapid application changes in your network and manage it with software flexibility and hardware scalability.
OpManager: The comprehensive Cisco ACI monitoring tool
OpManager can handle all your network monitoring needs with Cisco network monitoring, including now Cisco ACI monitoring. Discover your whole Cisco ACI infrastructure and get a comprehensive view of your controller along with all the other components, such as the fabric, tenants, and endpoint groups. Network administrators now have a unified tool to track the health and efficiency of the entire ACI environment and its associated components. Click here for the prerequisites to add a Cisco ACI infrastructure in OpManager.
With OpManager's Cisco ACI monitoring, you can:
- Monitor associated components.
- Get a comprehensive view of your network topology.
- Monitor the spine and leaf switches.
- Keep an eye on your tenants.
- Monitor the key metrics of your ACI environment.
- Know about your endpoints and application profiles.
- Access critical data in the form of dashboards and custom widgets.
- Always be aware with the help of instant notifications and personalized, automated reports.
Cisco ACI monitoring: Monitor all associated components
OpManager uses Cisco's own API access credentials to communicate with your SDN environment and monitor the Cisco ACI device with all its associated components. This includes:
- The APIC controller: Overall controller of your ACI environment.
- Fabric switches (spine, super spine, leaf): Network and software components of your ACI environment.
- Tenants: Logical controllers that hold a set of profiles.
- Endpoint groups: End devices grouped by an application profile.
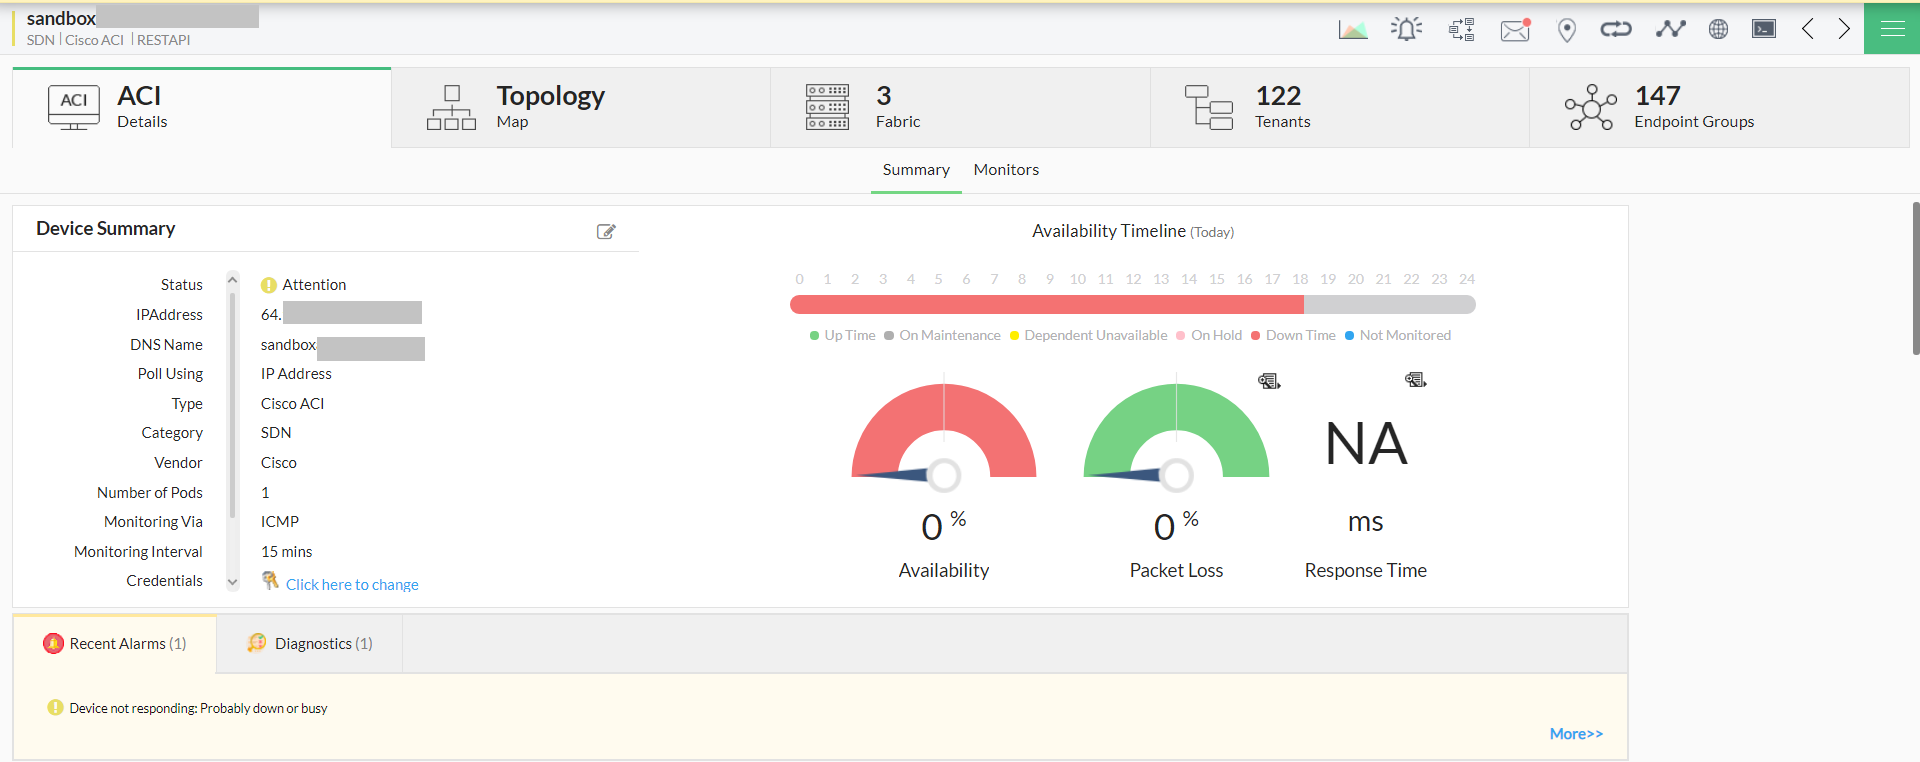
The Cisco ACI summary page gives you all the necessary information on the discovered ACI model, along with other details including:
- The availability timeline of the controller.
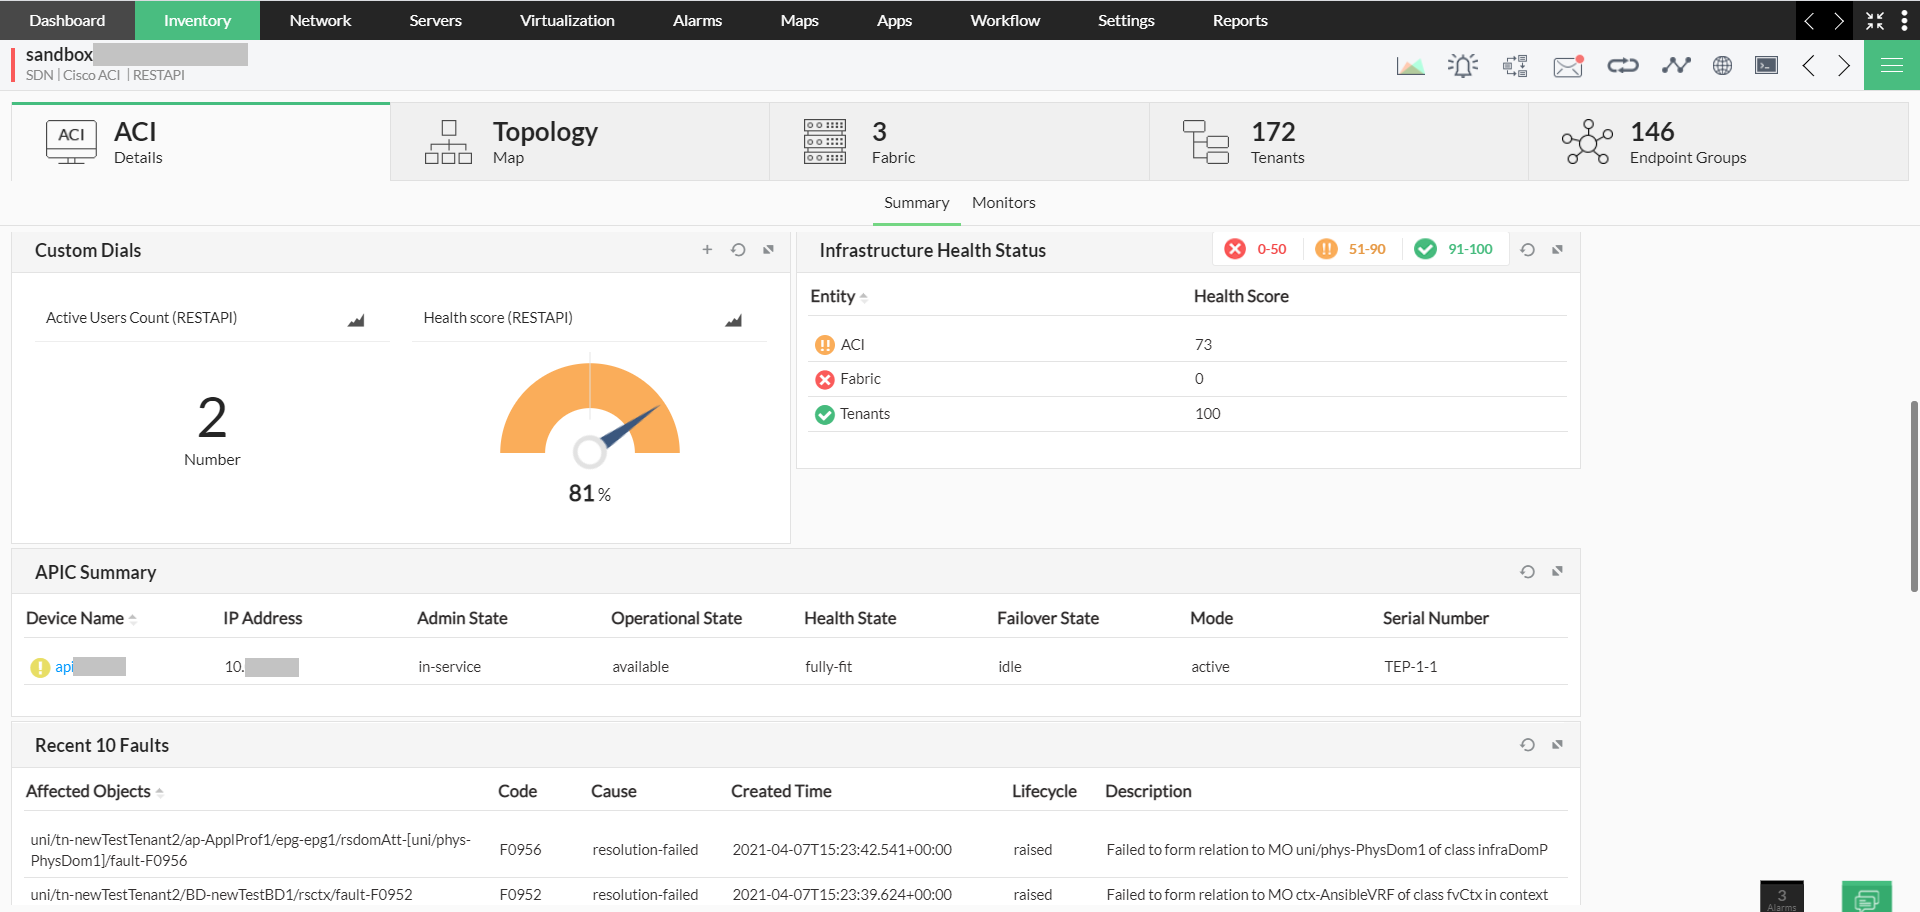
- The APIC summary table that gives you the availability and health score.
- A list of the recent faults that have occurred in the Cisco ACI environment.
Cisco ACI monitoring: Get a comprehensive view of your network topology
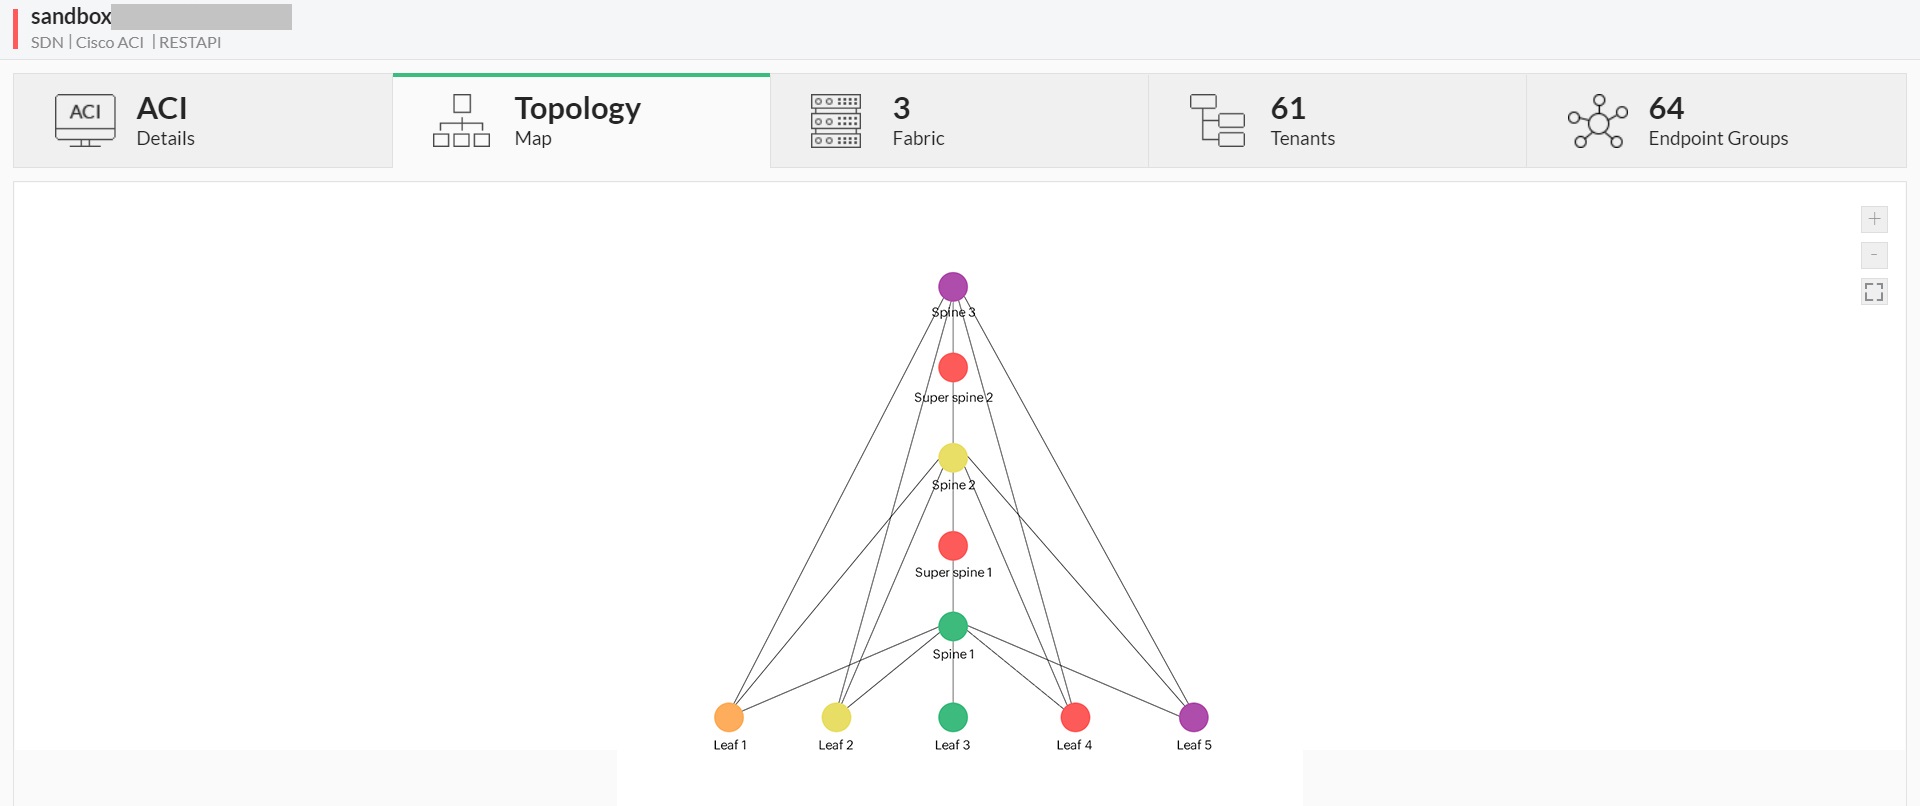
OpManager's Cisco ACI monitor automatically plots the topology map of your ACI environment for better visualization. This gives you a comprehensive look at the APIC controller, the spines, and the leaves available in your network and how they are interconnected. Click on a device and you’ll see its availability status too. The Topology tab is pretty much a network map with live status updates.
Cisco ACI monitoring: Monitor the spine and leaf switches
The Fabric tab gives you a complete layout of the network and software components of your Cisco ACI environment in a three-tier architecture. Once network device discovery is initiated, components in your environment, such as the super spines, spines, and leaves, will be automatically added into OpManager. The list also includes necessary information such as the health score, pod ID, and node ID of all discovered ACI components.
Cisco ACI monitoring: Keep an eye on your tenants
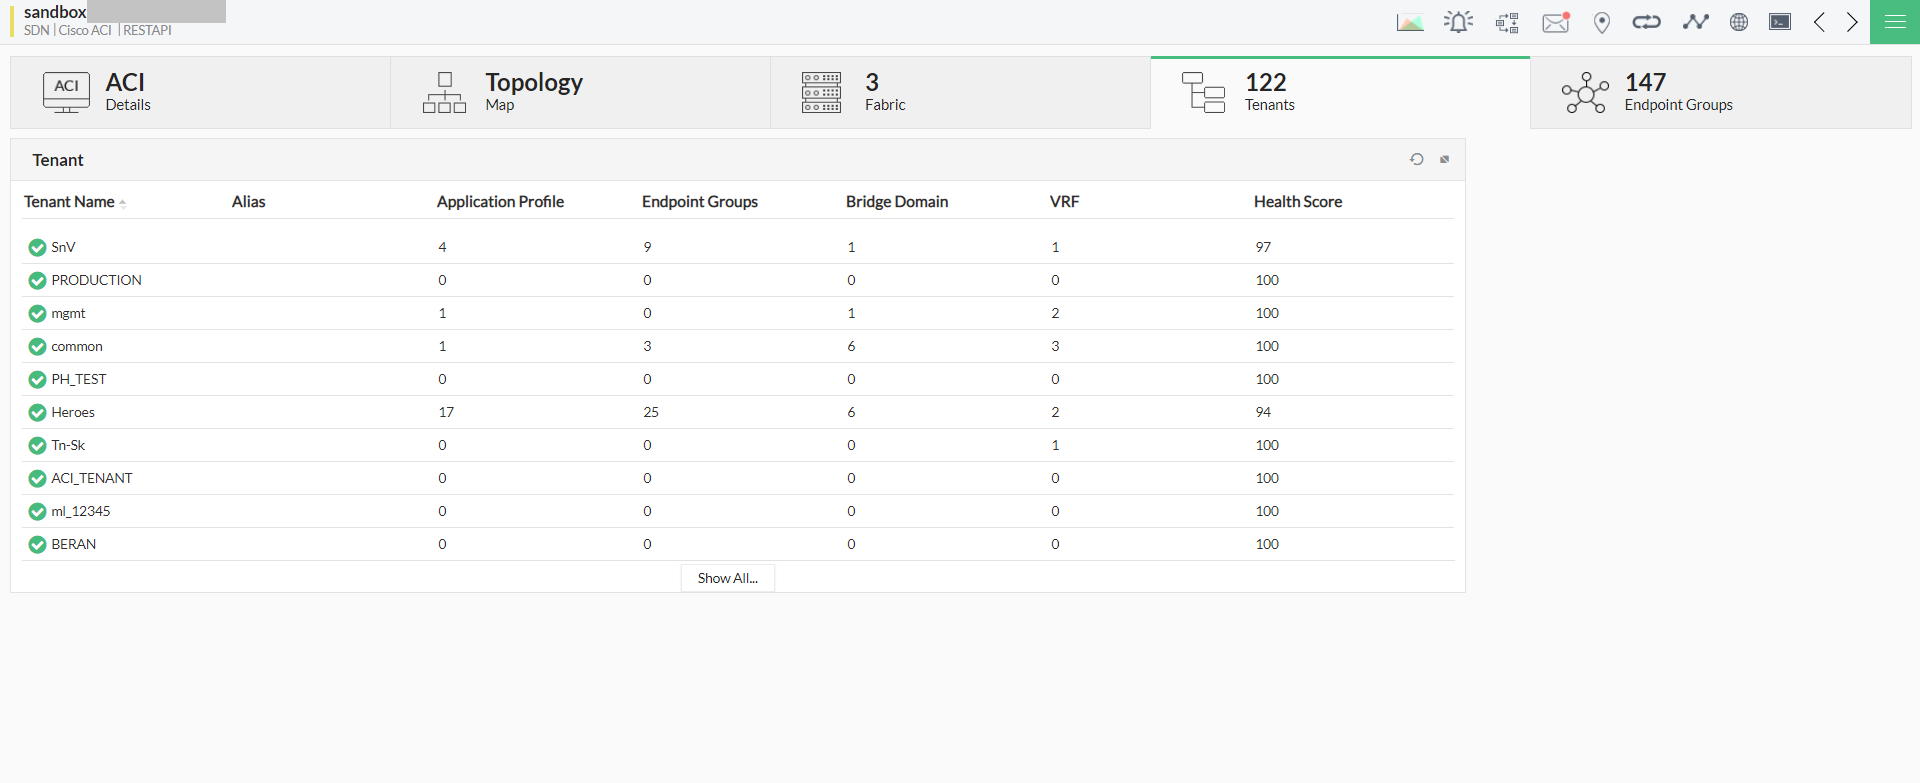
Tenants are logical containers that denote each customer or mapped service in a Cisco ACI network. With OpManager's Cisco ACI monitoring tool, you can further drill down into a tenant and access its summary page, which has information on all connected endpoint groups, application profiles, bridge domains, and VRFs, as well as the tenant's overall health score.
Cisco ACI monitoring: Know about your endpoints and application profiles
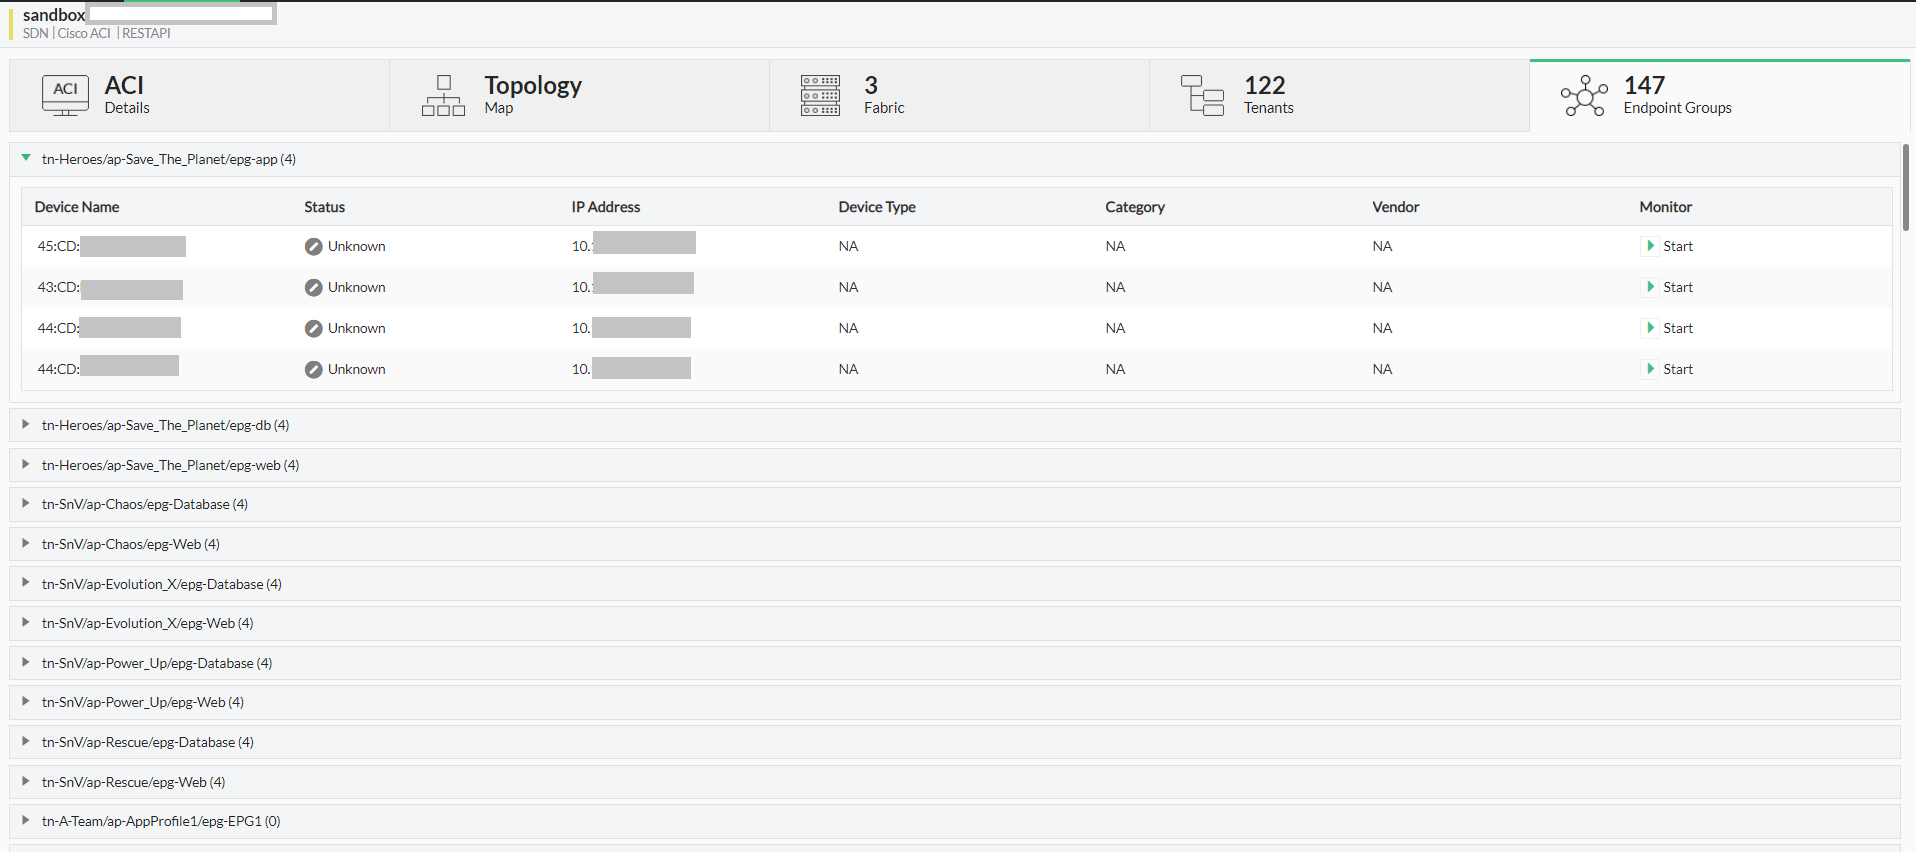
OpManager's Cisco ACI monitor discovers all endpoint machines associated with your Cisco ACI environment, grouping them automatically during device discovery. Endpoints groups are a collection of end machines that are part of the discovered Cisco ACI environment. These endpoint machines are treated as individual devices in OpManager. You can also initiate advanced monitoring for these endpoints and access all related functions if necessary.
Cisco ACI monitoring: Monitor the key metrics of your ACI environment
OpManager's Cisco ACI monitoring tool closely tracks the following metrics to check if your SDN environment is performing optimally.
| Component | Key metrics monitored |
| Fabric | Health score, availability, individual summary for associated components (spine, super spine, leaf) |
| Tenants | Health score, number of endpoint groups, associated application profiles, availability |
| Endpoint groups | Availability status, performance monitoring (if advanced monitoring is enabled). |
| APIC | Admin/Operational state, health score, availability |
Cisco ACI monitoring: Access critical data in the form of dashboards and custom widgets
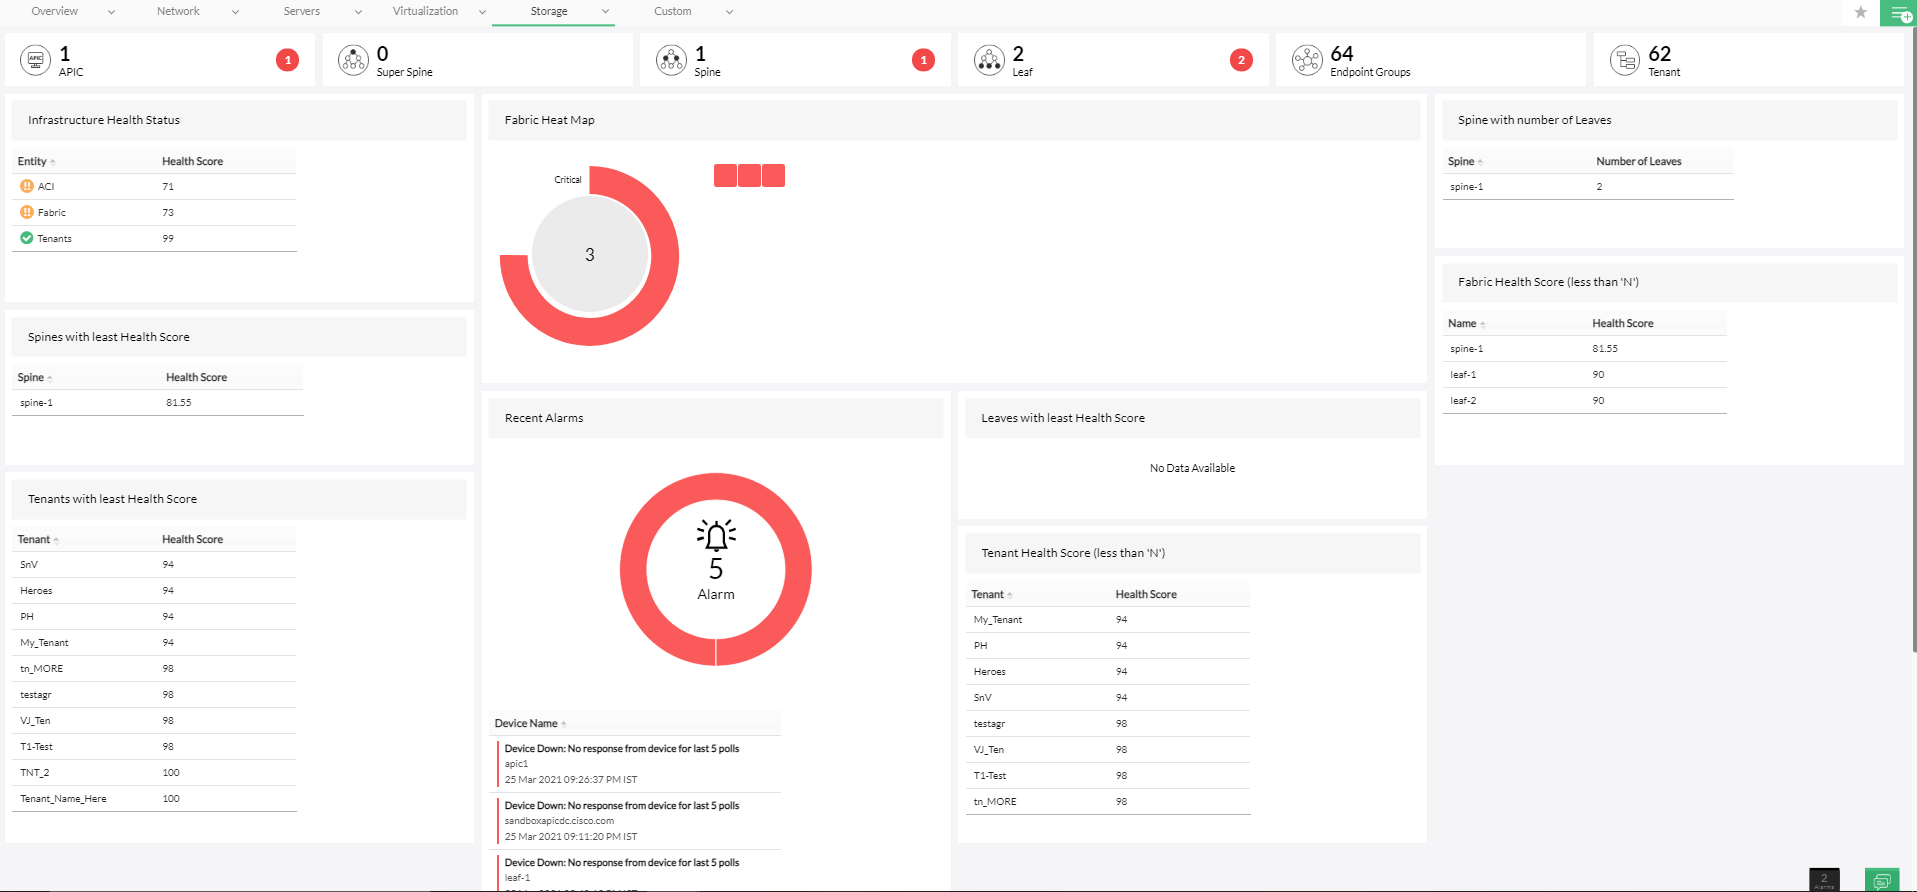
OpManager's Cisco ACI monitoring offers a dedicated SDN dashboard with a handful of personalized widgets that deliver all the necessary information about your Cisco ACI environment. This gives network administrators a quick glance at the entire network without digging into each node. The dashboard offers various widgets, such as SDN inventory, including details of all the individual components of your ACI environment; Infrastructure Health Status, displaying the health of the controllers, fabric, and tenants in your ACI environment; and Alarms, listing the most recently triggered alarms.
Cisco ACI monitoring: Stay informed with the help of instant notifications and automated reports
- Choose between default reports or customize your own Cisco ACI availability or performance reports.
- Associate notification profiles with the SDN environment and its components to alert you when something goes wrong. Mark critical servers as high-priority so you don't miss out on any updates, and configure Workflows if needed.
- Keep an eye on the most important Cisco ACI performance metrics by building customized dashboards.
- Monitor the interfaces associated with all connected components and assign various Cisco ACI performance and application monitors to devices according to device type.
FAQs on Cisco ACI monitor
What is Cisco ACI monitoring?
+Why do we need Cisco ACI monitoring?
+How to check Cisco ACI monitoring?
+Monitor your entire Cisco ACI environment with OpManager.
Download 30-day free trialCustomer reviews
Case Studies - OpManager
Awards & Honors
- Recognized as a May 2019 Gartner Peer Insights Customers' Choice for Network Performance Monitoring and Diagnostics Software
- Recognised as an April 2019 Gartner Peer Insights Customers' Choice for IT Infrastructure Monitoring Tools.
- Network Management and Monitor Vendor of the Year 2018, 2019
- Entered the 2019 Gartner NPMD Magic Quadrant.
- Ranked #2 in the Infotech Research Software Reviews Data Quadrant 2018.

