Discovery
What all protocols needed to add a device?
To add a device via discovery, Netflow analyzer requires SNMP credentials and Telnet/SSH access to the device.
Note : device will be automatically added if NetFlow Analyzer receives Flow from a device.- Do I need multiple credentials to add a device?
NetFlow analyzer uses SNMP to discover the interfaces and Telnet/SSH for executing flow export commands. Alternatively, you can manually add the interfaces for executing flow export commands without entering SNMP credentials.
- What should I do if I find errors in the executed output screen?
In case of errors in executed output screen, edit the configlet with the correct commands and click Execute to execute the edited configlets.
Note: If there are wrong commands in default configlets, please refer the flow processing error help document or contact our support team at netflowanalyzer-support@mangeengine.com
Settings
What is raw data?
Every flow received from the router is stored as raw data. This contains in-depth information about the data packet passing through the device like port number, tcp flag, next hop etc. Since the data is huge NetFlow analyzer stores raw data up to one week, which can be extended using High-Perf add-on.- What will I miss if I don't store raw data?
Any report generated in Netflow Analyzer for less than 2 hours will be from raw data (if available). Raw data contains every conversation for the selected time period with application t raffic, DSCP, etc.
If raw data is not available , NetFlow Analyzer generates reports from aggregated where the data is aggregated for top N records of applications , DSCP and conversation.
If you don't store raw data, you'll miss real-time reporting. - Which are the reports generated from raw storage?
Forensics report is generated from raw data.
Any traffic, application, source, destination, DSCP, conversation reports for less than 2 hours is generated from raw data (If available)
- How to calculate the disk space required for raw storage?
HDD space required (in Bytes) = Raw Data Storage Period in hours * (150 Bytes * 3600 seconds * Flows Per Second).
- Raw Data Storage Period in hours : You can find this in settings > storage settings > raw data settings
- Flows Per Second : You can find this in the system performance dashboard
- How to manage raw storage between devices?
In the settings page, you have an option to select the devices for which you need to enable raw storage.
Is it possible to store raw data in MSSQL database ?
Yes, if the default database is MSSQL, raw data is also stored in MSSQL database.
- How long can we store raw data?
By default raw data can be stored for 1 week. Using Hi-Perf add-on you can store upto 6 months.
- How can I customize the data storage pattern?
You have an option to customize your data storage settings from NetFlow Settings. By default, raw data in NetFlow Analyzer is set as OFF and aggregated data as ON. You also have a option to customize:
- Data retention time
- Top N record for Aggregated data
- Number of devices for raw data
- Email alert option for high data storage.
- What is aggregated data? How is it calculated in NetFlow Analyzer?
The aggregated data is stored based on top "N' records of the applications and conversations for every 10 minute interval and is further aggregated in a timely manner. Aggregated data can be stored forever in the database. The aggregation mechanism will happen simultaneously at the back-end along with the raw data storage. Flow data aggregation is done to avoid high disk usage without impacting the reporting and performance. The aggregated data on NetFlow Analyzer is used for historical reporting, capacity planning and trend analysis. The following explanation will help you to understand how Application data on NetFlow Analyzer is aggregated and stored in various tables. Older data is repeatedly rolled up into less granular times (10 minute, 1 hour, 6 hour, 24 hour and weekly). The top 'N' records of application based on octet value is stored for every 10 minute interval. As time goes, this data is further aggregated to an hourly table, similarly to 6 hours, daily and weekly tables.
What is the purpose of one minute storage?
Apart from the raw data and aggregated data, NetFlow Analyzer stores 1 minute traffic data which is used for real time reporting . The traffic report generated for any time period which is less than 24 hour is generated with 1 minute granularity which gives a detail picture of every minute IN and OUT Traffic.- How much disk space will it occupy?
It requires free disk space of 25 MB to store one year of one minute traffic data for each interface.
What is deep packet inspection?
Deep Packet Inspection (DPI) is a process to know what is being received and transmitted by a network device. It is the most accurate technique to monitor and analyze the application problems and regulate traffic in the best suitable way. With DPI’s packet level analysis, it is easy to make decisions on capacity planning and achieve better network performance and management. DPI helps determine the root cause for performance related issues with the complete traffic picture (both network and application) in a single view.What all information you can see with DPI?
As Initial phase, ManageEngine has introduced analysis for TCP packets even though it captures all packets. Rest will be supported in the future. Using the DPI , we can calculate Application Response Time (ART), Network Response Time (NRT), url's used and traffic utilization (productive\non-productive).
With these reports a network administrator can have a clear picture of what is consuming the bandwidth at what time and so, he can regulate it cost efficiently.
In DPI we get information about ART,NRT and URL
NRT : Network Response Time is the time difference between TCP_SYN packet and its ACK (acknowledgement)
ART : Application Response Time is the time difference between TCP_DATA packet and its ACK (acknowledgement flag)
URL : URL details in data packets.Do I need an additional license for DPI?
Yes, DPI requires an add-on license.Do I need an additional database for DPI?
Yes, DPI works with High Perf's database onlyWhat all reports can be generated using DPI?
To access reports from UI, navigate to Reports > DPI.
Here we have 2 types, Online/Offline reports. Online reports are generated from embedded in-built database. You can also have the packets captured in PCAP format and generate reports for the same. ManageEngine DPI reports are based on time and criteria. DPI reports are mainly concentrated on 3 metrics URL, NRT, ART.
Offline Reports
We also have offline reports where you can save the captured packets (in PCAP format) separately and generate the same reports.What is the web server port?
Webserver port is the GUI hosted Port number. To access NetFlow analyzer GUI, http://<serverip>:<webserverport>/
The default port is 8060.What is the listener port?
The port number on which NetFlow Analyzer listen for the UDP flow packets.
The default port is 9996 for ManageEngine NetFlow analyzer.How many web server ports can be added?
Only 1 webserver port will be hosted. It can be <http> or <https>.How many listener ports can be added?
You can add 5 listener ports using comma.Do I need a service/server restart?
Yes, changes in the port number requires a product restart.Why do I see Interface name as Ifindex-1,2,3 etc.
NetFlow Analyzer discovers the interfaces with the interface-index from the flow packets received. If SNMP is updated for the device, the interface names are resolved with respect to Name/ Description / Alias of the interfaces.
If the interfaces names are not resolved using SNMP, NetFlow Analyzer displays Interface Indexs as Names Eg: Ifindex-10.Why should I set interface speed?
NetFlow Analyzer collects flow packets and update the volume of traffic in bytes for the respective interfaces. With this volume, Speed and Utilization are calculated within the product. For utilization calculation, the bandwidth capacity plays a vital role.What is sampling rate?
Sampling can be configured on the device to export sampled flows and the same value can be applied here to get correct reports.What types of reports can be scheduled?
All reports except Forencis report can be scheduled.
Consolidated, Traffic, Capacity Planning, Application, Source, Source Network, Destination, Destination Network, QoS, Conversation, Conversation Network, Compare, Custom, Inventory, Multicast, Medianet, Protocol Distribution, NBAR2 Application, Http host, QoS Stats, QoS Drops, ART, ART Client, ART Server, NBAR, and CBQoS reports can be scheduled once or on a daily, weekly and monthly basis.Can I schedule reports for business hours?
Yes, Business hour filters can be applied in scheduled reports.Can the schedule settings be customized based upon the report?
Yes, Apart from the default settings, users can also customize the settings (Resolve DNS, Traffic graph and QoS) of specific scheduled reports.Why do we need an ESP/GRE filter?
Data transfer over VPN tunnel are more common now are days. The tunnel traffic is encrypted at the entry and decrypted at the exit.
From NetFlow point of view, the traffic going in the device is different from traffic coming out because the packet are encrypted.
All NetFlow based reporting tools will show the actual traffic before encryption and the same will be again classified as ESP Traffic after encryption. This leads double counting on traffic for the edge tunnel interfaces with wrong bandwidth calculations.
To avoid the above scenario, Netflow Analyzer behaves smartly by excluding ESP/GRE application traffic for the tunnel device.Why do I have to add access control filter for the dropped traffic?
When a access-list is added in the device, the corresponding traffic is dropped in the router. In the flow exported, OUT interface will be index 0 for the dropped traffic. NetFlow Analyzer by default do not show the dropped traffic, but still the IN traffic information from the incoming interface is accounted. If such interfaces are added to Access-Control filter, this dropped traffic information will be filtered.Do I have to apply suppression filter for my WAN optimizer?
Yes, When a traffic passes through a device, say it enters interface A and exits through interface B. NetFlow Analyzer, will assume that whatever flows enter interface A will exit through interface B. This is not the case when it comes to WAN optimization devices, which compress the packets going out. To avoid wrong data to be shown in the OUT interface of WAN optimization devices, output suppression should be enabled for LAN facing interface of WAN Optimizer.- What is Inventory Updater?
The Inventory Updater creates tasks in which device details like device name, interface name, speed and interface status are fetched using snmp at user specified time.
- What actions can you perform on an Inventory Updater?
The following actions can be performed:
- Adding an updater
- Editing an updater
- Deleting an updater
- Enabling/Disabling an updater
- How do you select the interfaces to be added in an updater?
To select all the interfaces, click the All interfaces check box. To select a particular interface or a set of interfaces, click on Modify Selection and select the interfaces you want to add.
- What details can you fetch using the Inventory Updater?
You can fetch devices details like the router name, interface name, interface speed and interface status.
- Is it possible to schedule the updates?
Yes, you can schedule it on a one time, hourly, daily, weekly or monthly basis.
- What can you configure under Data Unit settings?
Data unit calculation allows you to configure Data unit calculation method(SI or IEC standard), Speed Unit, Volume Unit, Decimal places(2 or 3 digits), and Percentile Value(90th, 95th, 99th percentile values).
- What are the available units of measurements? What is the default value?
Data Unit settings give you the option to set the measurement units as per industry standards. It can either be set to 1000 Bytes (SI standard) or 1024 Bytes (IEC standard). The value is set to 1000 by default.
- Explain the Automatic option in Data Unit settings?
NetFlow Analyzer automatically selects the unit based on the minimum and maximum values in the Speed/Volume graphs.
- How many decimal places will be displayed in the reports?
You have the option to choose 2 or 3 digits to be displayed following the decimal point in the IN and OUT traffic values in the reports.
- Can I upgrade to the Enterprise edition directly from the Standalone UI?
Yes, NetFlow analyzer's Distributed Monitoring feature allows users to upgrade to Enterprise Edition on a single-click.
- Can the direct Essential to Enterprise conversion be reversed?
No, the process is irreversible.
Where can I find the available LAN IPs?
LAN-WAN reports come with internationally preconfigured LAN IPs that allows you to configure any device or IP and IP range with ease. The available LAN IPs are listed under the LAN IPs setting. You can simply navigate to Settings > NetFlow > LAN IP Settings to see the available LAN IPs. To learn how to configure or edit LAN IPs click here.What is the use of LAN IPs settings?
LAN IPs setting allows you to add/edit/delete local network IP for an individual or group of routers. It provides you with an option to edit the existing LAN IPs and add new devices / IP range.
You can edit and modify the predefined configurations of both individual router or group of routers, and these IPs will be used as LAN IPs to generate LAN-WAN reports. To learn more about the LAN-WAN report, click here.
Autonomous Systems
- Is it possible to add or delete AS Number?
No, we cannot add or delete AS number. However, It is possible to edit AS name and the Organisation name.
- Do we need any additional configuration to view Autonomous System information in NetFlow Analyzer?
Yes, you need to enable BGP routing in the device to send AS information to NetFlow Anlayzer. To view the AS view information, enable AS data collection under storage settings.
What is the difference between flow-based ASN and IP-based ASN?
The flow-based ASN option will provide you AS number based on flow data received from the router. Whereas an IP-Based ASN option will help you find the AS number using source and destination IP addresses, when there is no AS number from router.What is an Autonomous System?
An Autonomous System (AS) can be conceptualized as a network of interconnected IP networks managed by a single administrative entity, which could be a university, government entity, commercial organization, or another type of internet service provider (ISP).What is the Autonomous System Number range that NetFlow Analyzer supports?
NetFlow Analyzer supports Autonomous System number range starting from AS number 1 to AS number 65534.
Amazon VPC
- Can a free tier, AWS account be used for VPC monitoring?
- In the free tier, only one million HTTP API requests per month are free.
- After 1M , the first 300 million API request costs $1.
API requests from NFA would be: (NFA supports only 1000 interfaces per server)
- For live traffic - for 1000 NFA Interfaces a month would need 1.3M (1357800000 requests).
- Other requests like Fetch interfaces, createloggroups, createFlowLogs, Listing FlowLogs (based on the user's inputs like refreshing) would need roughly 100 Requests.
Navigate toSettings> Discovery> Export Cloud Flow. Flow in the NFA, and discover the VPC flows again to find the recently added VPC's in the list of available interfaces.
Navigate to Settings> Discovery> Export Cloud Flow. Flow in the NFA, and discover the VPC flows again, click on the selected interfaces to temporarily stop the export flow logs.
NFA is capable of using "proxy" or "no proxy" to connect to AWS. Click here, to understand how NFA's proxy server setting works.
- In your AWS account delete the flow logs of each interfaces which is monitored in NFA.
- To delete, get AWS FlowLogID's of respective interfaces from AWS account listed in NFA.
- ReAdd FlowLogs with aggregation interval 1Min for each interfaces.
Network Packet Sensor
What is Network Packet Sensor ?
Network Packet Sensor is an agent installation that operates as both NetFlow Generator and DPI engine. It reads raw network packets from servers and converts them as NetFlow Packets and also performs packet-level inspection.Can Network Packet Sensor be used as a packet filtering tool?
No, Network Packet Sensor does not filter or block any packets. It has no control over the packet flow. Network Packet Sensor reads, translates and sniffs out information to NFA upon installation.Does Network Packet Sensor provide an option to switch from DPI Engine to NetFlow Generator?
Yes, once the Network Packet Sensor is installed, you can see it listed under NetFlow UI > Settings > Agents> Network Packet Sensor. Select the agent, there is an option named ' Server Type selection' where you can enable the functional modes: DPI engine, NetFlow Generator or both. If you need to switch from your previous selection, then you can switch anytime by changing your preference as per your monitoring needs.Where can I find the installation key?
You can find the installation key in the NetFlow Analyzer UI. Settings>ITOM Agents>Network Packet Sensor. The tab on the right corner has the installation key. You can copy and paste the installation key details while you type in the credentials.Should ManageEngine NetFlow Analyzer run in HTTPS mode for Network Packet Sensor installation?
Yes, Network Packet Sensor works only when NetFlow Analyzer is running in HTTPS mode.Can I set the agent type as both NetFlow Generator and DPI during installation?
No, you can only select either NetFlow Generator or DPI engine during installation. However, You can enable the functional modes: DPI engine, NetFlow Generator or both during the configuration of Network Packet Sensor. The Network Packet Sensor configuration process allows you to enable or disable the functional modes as per your monitoring needs.What does DPI provide?
DPI allows the network administrator to monitor the network response time and application response time and conduct an analysis to find out whether it is the network or the application is at fault. The reports generated by the DPI enable the network administrator to find the root cause of the poor network performance and resolve them before the end-users are affected.Can I install more than one DPI?
Yes, the set up allows multiple installation. You can install up to ten DPIs and it is configurable.How to change time interval for NetSpeed Tracker?
Navigate to Settings > Agents > ITOM Agent > Network Packet Sensor > Actions. Click on the settings icon where you can select the Time Interval depending upon your usage and requirement.How much volume of data can be used for upload and download data?
The minimum amount of data that can be used is 40mb as default.rHow long can this data be stored?
The maximum period for storing the data is 6 months.
Mapping
What all information you need to map a custom application?
To map a custom application, provide application name, port number and protocol (mandatory). You can also associate IP address/ IP network / IP range if needed.Can I map an application with server details?
Yes, you can create a mapping for corresponding port and protocol along with IP details.- Can I create a custom DSCP name?
Yes, you can create a custom DSCP name for the existing code points. Please visit the link to know more about DSCP mapping.
- Is it mandatory to create topsite map to know the URL traffic?
Yes, the created topsite details alone will be displayed.
Does Netflow Analyzer have some inbuilt mapping like google, youtube. etc.?
We do not have predefined site map as of now. We are working on it.How is Top site different from Application mapping?
With Application Mapping you can map applications with port, and protocol along with IP range. It allows you to scan your network based on IP ranges, and discover all applications and servers.
Top Sites gives a list of applications contributing to the traffic. For mapping top sites, you have to provide the site name, application name, and IP range.What is the update interval for Cloud Services?
All Cloud Services undergo automatic update every day at 1am provided if internet connection / ManageEngine server is reachable.Is it possible to perform Cloud Services at any time of the day?
Yes, we can update and refresh Cloud Services any time of the time of the day. by clicking 'Update Now'' button. It fetches information from the ManageEngine server and updates the Cloud Services.What does Online/Offline mode in Cloud Services mean?
Online mode in Cloud Services indicate the availability of a sound internet connection /reachability of ManageEngine Server where Cloud Services gets updated automatically. Offline mode indicates the lack of an internet connectivity/ ManageEngine server is non-reachable at point of time.What does Last Updated time mean?
Last updated time indicates when the cloud services that are most recently updated.The Last Updated Time will be shown in the user interface for the customers for better monitoring.Can we edit or delete an existing Cloud Service?
It is not possible to edit or delete an existing Cloud Service in NetFlow Analyzer.
Network Mapping
What is needed to create your network map?
Add at least two devices in the maps tab and link the two devices to create a network map.Will I able to see link status from the map?
Yes, the link status can be understood with the color change, click on the device icon for device details.Can I see the map in big screen and know if my link is down?
Yes, Maps can be displayed in the big screen and the color of the link changes with respect to the status.
Grouping
What is the purpose of device group?
Device group allows administrators to effectively manage the users by limiting access to all devices.- Can I see the combined devices traffic for a created group?
No, device group doesn't show the combined traffic. To view combined traffic, Interface groups can be created.
- How does the device group help in effective user management?
You can create device groups and associate to the users, so that the respective users will have access to the specific groups only.
- How can I generate reports for device group?
Reports for device groups can be generated using Report Profile under reports tab.
- What is 'ALL DEVICES GROUP'? Can it be edited?
'ALL DEVICES GROUP' is a default group that includes all devices and it cannot be edited.
What is the purpose of an interface group?
Interface group allows you to see the combined traffic of multiple interfaces of same device or different devices. Say for example: if there are 2 wan routers (primary and secondary) which works in load sharing mode, you can create an interface group with respective WAN facing interfaces of both the routers. You can monitor the combined traffic of WAN interfaces and generate reports.Where can I see reports for the interface group?
Navigate to Inventory > Groups > Interface group (in the left pane) > select the group name and expand it. You can see the snapshot page for interface group. To generate report, click on menu icon (green square on top right).- Can I schedule a report for the interface group?
Yes, you can schedule all reports for interface group from the reports tab.
- Can I group multiple interfaces of different devices?
Yes, you can group multiple interfaces of different devices.
- Can we associate an interface group to a bill plans?
Yes, you can associate an interface group to a bill plan under Reports > Billing. Click on the edit icon next to the Bill Plan and click Next. Here you can select the interface group name and click save to associate to the bill plan.
Can we generate alerts for the interface group?
Yes, you can generate alerts for the interface group from Settings > NetFlow > Alert Profile. Create a new alert profile / click on the existing alert profile and select the interface groups to be associated and save.What is the purpose of IP group?
IP group allows you to monitor a specific traffic for the criteria proided. You can create a IP group based on IP details/ protocol/port/DSCP , include/exclude and associate to one or many interfaces to monitor the corresponding traffic.- How can I generate reports for the IP group?
Yes, you can generate reports for the IP group from the IP group snapshot page. Navigate to Inventory > Groups > IP group (in the left pane) > select the group name and expand it. You can see the snapshot page for IP group. To generate report, click on menu icon (green square on top right).
- Do we have an option to exclude a criteria for IP group?
Yes, you have an option to exclude a criteria for IP group,Port & Protocol and Autonomous System. Also combination of include and exclude is available. For example, you can include 192.168.0.0/16 and exclude 192.168.100.100 and include/exclude Autonomous System and Port & Protocol.
- Can I schedule a report for the IP group?
Yes, you can schedule a report for the IP group from the reports tab.
Can I associate multiple interfaces for an IP group?
Yes, you can associate multiple interfaces for an IP group.Can we associate an IP group to a bill plan?
Yes, you can associate an IP group to a bill plan under Reports > Billing. Click on the edit icon next to the Bill Plan and click Next. Here you can select the IP group name and click save to associate to the bill plan.- Can we generate alerts from the IP group?
Yes, you can generate alerts for the IP group from Settings > NetFlow > Alert Profile. Create a new alert profile / click on the existing alert profile and select the IP groups to be associated and save.
- Can I get a single report for all IP groups?
Yes, you can generate a IPgroup consolidated report to see all the IP group IN & OUT in a single report.
- Where can I see the application group traffic?
Navigate to Interface / Interface group / IP group snapshot page (Inventory > Interface/IP group/Interface group), select Application tab, scroll down to see the application group traffic.
Where can I see the DSCP group traffic?
Navigate to Interface/IP group/interface group snapshot (inventory > interface/IP group/Interface group ) page, select QoS tab, select DSCP group from the "DSCP" drop-down.What is the purpose of Access Point group?
It is possible to create an Access Point group to view the combined traffic usage by multiple APs. Access Points group can used to categorize the traffic by location, site, user-type etc.How can I generate reports for Access Point grouping?
It is possible to generate reports for AP group from Inventory > Groups. You can view the traffic by real-time graph, Clients, SSIDs, Application, QoS and conversation for a particular AP group. You also have an option to create and view the reports under dashboard for the associated across access point group. The report can be scheduled or can be exported as PDF or CSV.What is the purpose of SSID group?
SSID groups are created to view the combined traffic usage by multiple SSIDs. SSIDs group can be used to categorize the traffic by location, site, user-type, Access Points etc.How can I generate reports for SSID grouping?
It is possible to generate reports for AP group from Inventory > Groups. You can view the traffic by real-time graph, Clients, Access Points, Application, QoS and conversation for a particular SSID group. You also have an option to create and view the reports under dashboard for the associated across SSID group. The report can be scheduled or can be exported as PDF or CSV.
Alerts
Will link down alert generated if flows are not received?
Yes, you have an option to get alerts if there is no flows received for 15 minutes from any monitored device.- Is it possible to enable link down alert for selected interfaces alone?
Yes, it is customizable. Navigate to Settings > NetFlow > Alert Profiles > Real-time. Click on "Link down" alert and edit the interfaces and click on Update.
- What are the different types of alert profiles that can be created?
Real-time and Aggregated alert profiles.
- What is a Real-time alert profile?
A Real-time alerts are generated when the volume/utilization threshold is violated a given number of times in a particular time period.
- What is an Aggregated alert profile?
An Aggregated alert is set based on the number of occurrences and is generated when the threshold per minute is violated more than the given number of times.
- What are the different criteria you can provide in creating an alert profile?
Thresholds can be set for Interface\IP group\Interface Group on IN \OUT \Combined (With business hour filter) for greater than \ less than based on Volume\Utilization\Speed\Packets with severity Attention\Trouble\Critical.
Can Aggregated alarms be generated for more than one source?
Aggregated alert profiles can be generated for one or more interfaces, interface groups, access points, access point groups, and SSID groups.Can alarms be generated for custom time periods?
Aggregated alert profiles can be created for Custom and Periodic time periods.
Custom: Users can select both the Start and End time and date.
Periodic: Users can select both the Start End time and the frequency of time intervals for the alerts.When is the Aggregated alarm raised if the criteria is set for alarms to be generated less than a certain volume?
When the alert criteria is set to be raised for less than a certain volume in a given time frame, say, less than 100MB between 12 am(Start date) to 12 am(End date), the alarm will be raised at the end of the given time period, i.e, 12 am(End date). In case the volume exceeds the given limit(100MB in this case), the alarm is raised immediately.- Can a report be generated for an alarm?
Yes, Last hour report will be generated and emailed with attachment if raw data is available.
- Can I generate alerts for groups?
Yes, alerts for IP group and interface group can be generated.
- Can I customize alert notifications?
Yes, alert messages can be customized (provide link to email customization)
- Can alerts be forwarded to an external monitoring system?
Yes, A SNMP trap can be generated from netflow server and sent to corresponding NMS server.
Can multiple severity set for different threshold values?
Yes, multiple severity can be set for different threshold values.Can I log tickets for alerts?
Yes, you can choose to log an alert as an SDP ticket under Alerts Profiles once you configure the ServiceDesk Plus add-on.What are the different method types in webhook URLs?
- GET
- POST
- PUT
- DELETE
- PATCH
- HEAD
What are the different data types in Webhook?
The data types are given in three categories: form-data, form url-encoded, or raw.What are the payload types of HTTPs requests supported in NetFlow Analyzer?
- Non-ASCII text
- Large binary data
- Simple text, ASCII text or text
- XML
- JSON
- Javascript and HTML
What are the replaceable tags used in custom parameters?
NFA Source Type > $NetFlowField(sourceType)
NFA Source Name > $NetFlowField(sourceName)
NFA Alert Profile Name > $NetFlowField(alertName)
NFA Alert Profile Type > $NetFlowField(alertType
NFA Alert Criteria > $NetFlowField(criteria)
ID of the Alarm > $alarmid
Message of the Alarm > $messag
RCA Profile Name > $rcaLinkedToTheAlar
Source of the Alarm > $displayName
Category of the Alarm > $category
Severity of the Alarm > $stringseverity
Time when Alarm was generated > $strModTime
type of the Alarm > $eventType
Entity of the Alarm > $entity
Last Polled Value > $lastPolledValueWhat is the difference between custom request header and request header?
A request header can be used to provide information in an HTTP request so that the server can customize the request. Whereas , a custom HTTP header provides additional information for troubleshooting pruposes.Can we monitor volume, utilisation and packets of an interface in Pattern Analysis?
No, we can only monitor the traffic contribution of an interface based on Speed on a real-time basis.Can we customize the Alerts with different criteria?
You have the option to customize the alert based on the deviation percentage criteria based on your network monitoring needs.What is the ML algorithm that is used to determine Pattern Analysis feature?
We use Exponential Moving Average algorithm to predict network traffic anomalies of an interface.What is the default time period setting for incoming and outgoing network traffic?
Network Traffic Pattern Analysis presents the incoming (IN) and outgoing (OUT) traffic of a specific interface within a defined time period where there will be a data point with default of every 10 minutes that predicts how a normal data behaviour should be.Is it possible to view traffic contribution of a specific anomaly detected?
The network traffic patterns which do not match the expected traffic behaviour will be marked as an anomaly and the traffic contribution for that anomaly can be seen by clicking the anomaly on Show graph.
NBAR/CBQoS:
- How long can you retain Cisco CBQoS & NBAR data? Disk space for storage of NBAR/CBQoS?
NBAR and CBQoS data can be stored for a max of 1 year. You will require a free disk space of 360 MB to store NBAR data and 180 MB to store CBQoS data for a year per interface.
- What is NBAR?
Network Based Application Recognition is a Cisco feature to know the application traffic passing through the device. It requires a additional license from Cisco and add-on license from NetFlow Analyzer. In NetFlow Analyzer applications are categorized based on port and protocol. There are some applications which use dynamic ports (ex:skype). These applications can be catogorized by NBAR add-on.
What is CBQoS?
Classed Based Quality of Service is an add-on in Netflow Analyzer. It helps to analyze if the policy in the device is effective.
You can see the pre-policy and post-policy traffic, Amount of traffic drop due to applied policy and, Parent policy and child policy tree view.What is the minimum and maximum polling interval for NBAR & CBQoS?
MIN : 5 min Max : 1 hour- Do I need additional license for NBAR & CBQoS?
Yes, CBQoS and NBAR are add-ons for NetFlow analyzer.
- Is NBAR & CBQoS supported on non-Cisco devices?
No, CBQoS and NBAR are supported only on Cisco devices.
- Do I need an additional license for NBAR & CBQoS from the vendor?
NBAR : Yes
CBQoS : No
Security Module
What is Security Module in NetFlow Analyzer?
Security Moduleis a flow based network security analytics module that helps detect and classify network intrusions. It offers intelligence to detect a broad spectrum of external and internal security threats. Using the "Continuous Stream Mining Engine" technology, Security Module analyzes flow packets in real time and matches predefined problem events. Thus, it offers continuous overall assessment of network security.Do I need an additional license for Security Module?
No,Security Module is available by default in the Enterprise edition.
License Management
Licensing is based on devices or interfaces?
NetFlow analyzer is based on number of interfaces you wish to monitor.- What is the difference between manage, unmanage & new interfaces?
Manage : Counted for license
UnManage: Not counted for license
New Interfaces: Receiving flows but do not have license to manage, so data is not collected. - I enabled flow on 2 interfaces but I can see all the interfaces in the Inventory.
Yes, Netflow Analyzer finds the other interface from the incoming flow packet. With this information both the interfaces can be discovered. Like wise all the interfaces that has communication with the netflow enabled interfaces are discovered.
Note: We recommend to enable netflow on all available layer 3 interfaces of the device to provide accurate reporting. Interfaces you do not want to monitor can be unmanaged from license management.
- If interface is deleted and readded, can I see the old data?
Yes, if a interface is deleted from Netflow Analyzer it will get added automatically if server receives flow from the interface. Old data will be available if it was managed earlier.
How do I retrieve a deleted interface?
If you delete an interface but want to add it again, please contact our support team netflowanalyzer-support@manageengine.com- Should I unmanage or delete an interface if I don't want to monitor.
You can unmanage the interface if you do not want to monitor.
- Licensing is based on WLC or Access Points?
Licensing is based on number of access points you wish to monitor.
What is the difference between manage, unmanage & new APs?
Manage : Counted for license
UnManage: Not counted for license
New Access Points: Receiving flows but do not have license to manage, so data is not collected.If an access point is deleted and readed, can I see the old data?
Yes, if access point is deleted from Netflow Analyzer it will get added automatically if server receives flow for the access point. Old data will be available if it was managed earlier.Licensing is based on interface or device?
Licensing is based on number of interfaces for which Security Module is enabled in user interface.- I'm monitoring 4 interfaces in a device but I need Security Module for 2. Is it possible?
Yes, Security Module license is customizable. Navigate to Settings > NetFlow > Security Module License Management and Enable/Disable interfaces.
Reports
What is available in search report?
Search report generated is from aggregated data which is based on top N records. You can generate search report by clicking on Reports tab. You can select the interfaces for which you want to generate report, specify different criteria and time period. This report is more helpful when you need to analyze specific information going back in time. Since it is generated from aggregated data, it can give historic information.Can I generate a report for multiple criteria?
Yes, you can set multiple criteria to view specific traffic.What are the maximum criteria that can be added in search report?
You can set max of 3 criteria to generate a report.Can I generate a report for customized time?
Yes, reports can be generated for any period, provided data is available.Can I export the reports?
Yes, there is an option to export the report to email, csv & pdf .Is it possible to save the search criteria or generated reports?
Yes, generated reports can be exported and saved in either of the above formats. The criteria can not be saved for future use. Instead, you can use report profiles to achieve this.What do I see in the report profile?
Device specific reports can be viewed in Report profile.Is there an option to include all and exclude one criteria in report?
Yes, you can create multiple filters with include and exclude criteria to drill down to specific view.What all reports are available for a device in Report Profile?
Application, Conversation, Source, Destination, Conversation Network, QoS and DSCP reports are available.Can we schedule the report profile to email?
Report profiles can be scheduled and reports can be emailed.Can I use multiple data points?
Yes, one min, and five min data points are available.What are data points in Consolidated report?
Data points are the granularity of the report generated.Can I generate a forensics report for multiple criteria?
Yes, forensics report can be generate based on multiple criteria.What are the maximum number of criteria that can be added in forensics report?
You can add up to 3 criteria to view specific traffic.Can I generate a forensics report for a customized time period?
Yes, Forensics Reports can be generated for custom time period (provided Raw data is available).- Where do I see AS reports?
To see the AS information navigate to corresponding device snapshot page and under AS view you can expand it to download as pdf, csv or send as e-mail.
Can I export the forensics reports?
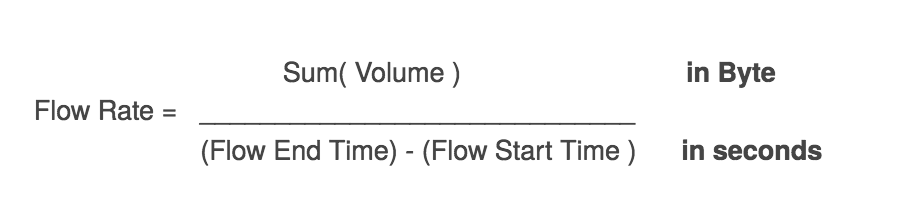
Yes, Forensics report can be exported to pdf, csv or emailed.How is flow rate calculated for active conversations in the forensics report?
Flow Rate is calculated as follows:What is the percentile used for billing?
Billing uses the 95th percentile calculation by default since 95th percentile is an averaging method, which is less volatile than actual usage. However, the option to calculate the billing percentile based on 90th, 85th, 80th, or 75th percentile is available.What are the different types of billing option?
There are two different billing types in NetFlow Analyzer. The bills can be generated based on speed or volume.Is it possible to generate an on-demand bill plan?
Bills can be generated on demand. By clicking on "OnDemand" for a particular bill plan in the bill plan list, a bill can be generated for the time period from the beginning of the billing cycle to the current date.Is it possible to associate a bill to a particular email address?
It is possible to send a bill report to a particular or multiple email address. The option is available in the "Bill schedule details". Multiple mail IDs should be separated by comma "," The email subject can also be customized as per the user requirement.Do I have an option to customize currency?
Yes, you can select the currency for an individual bill plans from the drop-down box and enter the cost.What are the reports available with billing?
Once the bill is generated, you can view the bills under "Generated reports". This will show the complete bill details and you can drill-down to see the usage by each interface or group.How does 95th percentile billing works?
The 95th percentile is a widely used mathematical calculation to evaluate the regular and sustained use of a network connection. The 95th percentile says that 95% of the time, the usage is at or below a certain amount. Thus 5% of the samples may be bursting above this rate. Select one of the two options from the drop-down box. Selecting "In & Out merge" will merge the In and Out values and calculate the 95 percentile value. Selecting "In & Out separate" will calculate 95th percentile value of IN and 95th percentile value of OUT separately and the higher of the two is considered. This is calculated using 5 minutes average data points.Can I add tax or additional fees to bill plan?
Yes, you can add tax, one-time charges or any surcharge to your bill plans. The charges can be either a fixed value, or percentage.What can I infer by generating protocol distribution report?
Protocol Distribution report lets you to view the information on top protocol utilizing the bandwidth from Interface, Interface Group or IP group.What is the data point granularity in capacity planning report?
Capacity planning reports can be generated with one min, and five min data point granularity.How to define weekends in NetFlow Analyzer?
By default, Saturday & Sunday are set as weekends. Please contact Support@netflowanalyzer.com to customize Weekends.Is it possible to set business hours for capacity planning report?
Yes, Business hour filters can be set to filter non-productive information.What is additional information I can see in Capacity Planning?
You can view the application Growth and Traffic trend in Capacity planning reports.What types of reports can be scheduled?
All reports except Forencis report can be scheduled . Consolidated, Traffic, Capacity Planning, Application, Source, Source Network, Destination, Destination Network, QoS, Conversation, Conversation Network, Report Profiles, Compare, Custom, Multicast, Medianet, NBAR, and CBQoS reports can be scheduled on a Daily, weekly and monthly basis.Can I schedule reports for Business hours?
Yes, Business hour filters can be applied in scheduled reports.What are the different types of Compare report?
1. Compare same interface/IPgroup for multiple time intervals.
2. Compare multiple interface/IPgroup for same time interval.On what algorithm is the forecast report generated?
NetFlow Analyzer uses machine learning with Time Series approach to generate forecast reports. NetFlow Analyzer also employs techniques like autocorrelation, seasonality trend loss decomposition and regression to forecast reports.What is the accuracy of the forecast reports?
To generate one week's forecast report with 80% accuracy, historical data should be available for at least 28 days. The granularity and accuracy of the forecast will vary based on the available data.What are the possible error messages that might show up while generating the report?
- Atleast 5 past instances are required / No data
A minimum of 5 data instances are required to generate a forecast report. Newly configured devices might not have sufficient data to forecast future trends. - business hour alerts - Start time is greater than the end time
While applying Business Hour Filter, the user must ensure that the start time precedes the end time. - Too many values missing and hence, inappropriate to forecast!
When the service is down, the available data might be insufficient to generate forecast.


- Atleast 5 past instances are required / No data
Can the forecast report be generated for custom time periods?
No, the data can be forecasted only for the following pre-defined set of time periods - 7 days / 15 days / 1 month / 3 months / 6 months / 1 year.What is the function of show history button?
The show history when enabled depicts the past trends based on which the report has been generated. For example, to generate forecast for the next 7 days, the past 35 days data would be graphically depicted to the users.How does NetFlow Analyzer select the top applications?
NetFlow Analyzer chooses the "Top 5 Applications" and the applications displayed under "Custom applications" based on usage from the last 7 days.What can I infer by generating Inventory Report?
Inventory report shows the consolidated information of the Interfaces, Interface groups, IP groups, Access Points, Access Point groups and SSID groups with the IN and OUT bandwidth utilization based on Speed, Volume or Utilization.When is the violation report generated?
A violation report is generated only when the selected criteria are violated while generating the inventory report. These criteria violations can be viewed by clicking on the graph icon which appears in the generated report.What is the need for defining criteria in Inventory report?
By defining criteria, users can view filtered reports based on the selected criteria, and violation report in case of any criteria violations. This helps in gaining better visibility over their bandwidth utilization with more intuitive reports.Can I generate the Percentile report for customized time?
Yes, Percentile reports can be generated for any custom time period based on availability of data.Is it possible to generate report with for a custom percentile?
Percentile report can now be generated only with 90th, 95th, and 99th percentile and cannot be customized.Why is the percentile value displayed as “-“?
The percentile value displayed as “-“ when there is unavailability of data. The 90th percentile requires a minimum of 10 data points, 95th percentile requires a minimum of 20 data points, and 99th percentile requires a minimum of 100 data points to generate IN and OUT traffic data.What is LAN-WAN report?
LAN-WAN report provides an in-depth analysis of network traffic specific to LANs and WANs. The report generated contains detailed insights into IN and OUT traffic between a LAN IP within the network and a WAN IP outside the network.What is LAN-LAN report?
LAN-LAN reports generate detailed reports on traffic within the network. The report provides insights into IN and OUT traffic between two LAN IPs.Can I edit LAN IPs configuration?
Yes, LAN-WAN reports provide an option to edit existing LAN IPs and add new devices / IP range. LAN IPs setting offers internationally predefined configurations based on the individual routers. If you need to add or remove any devices or IP range, you have an option to edit or modify the criteria with the configure LAN IP(s) option.Does LAN-WAN reports provide an option to exclude weekends?
Yes, LAN-WAN reports provide an option to customize business hours and exclude weekends to filter non-productive business hours and weekends.Can I generate a report for network traffic within the network?
Yes, the LAN-LAN reports enable you to monitor IN and OUT traffic within your network and generate reports with detailed insights on traffic between two LAN IPs.Can I monitor LAN-LAN/WAN traffic for a particular time?
Yes, LAN-WAN reports come with a time filter that allows you to customize and generate a report for the last hour, last 6 hours, last 24 hours, today, yesterday, last week, last month respectively.


HighPerf add-on
Why should you have HighPerf add-on?
HighPerf add-on has a complete set of unique benefits that it offers. Some of them are:
- Increased raw data storage capacity
- Instant report generation for bulky data volumes
- Columnar database
- Improved data compression techniques
- Raw data availability for a much longer duration<.
- Better analytics in reports
- Better capacity planning reports
How does HighPerf add-on enhance the capabilities of NetFlow Analyzer?
NetFlow Analyzer is primarily an analytical tool. The flow data is collected from the devices, analyzed and it generates analytical reports based on collected data. The availability of raw data is of critical importance to the generating reports. With HighPerf add-on, raw data can be made available up to a period of 6 months. This repository of raw data can help in better analytics. These reports help in getting much better insights about the traffic statistics in your network.
What are the recommended settings and system requirements for HighPerf add-on?
Rate of Flow/Second Processor RAM Raw Data(Optional) 0-10k 8 cores/16 threads or higher.
3.5 GHz or above.24GB 100 GB/day 10 - 25k 8 cores/16 threads or higher.
3.5 GHz or above.24GB 250 GB/day 25 - 50k 8 cores/16 threads or higher.
3.5 GHz or above.24 GB or HIgher 500GB/day 50 - 75k 16 cores/32 threads or higher.
3.5 GHz or above.32 GB or Higher 750GB/day 75 - 100k 16 cores/32 threads or higher.
3.5 GHz or above.32 GB or HIgher 1000GB/day What is the installation procedure for HighPerf add-on?
Please download our installation guide from here.
Which build numbers support HighPerf add-on?
The HighPerf add-on is supported on build number 12.5.447 or above. Users of the earlier versions need to upgrade to the latest version of NetFlow Analyzer to be able to use the HighPerf add-on add-on.
What type of servers support HighPerf add-on?
HighPerf add-on is supported in 64-bit servers alone. It cannot be run on 32-bit servers.
Are High Performance Reporting Engine and HighPerf add-on different?
No, they are the same thing. High Performance Reporting Engine is abbreviated as HighPerf add-on.
Do I need an extra license for High Perf?
Yes, High Perf is an add-on for Netflow Analyzer.