Understand reports
A report is a compilation of data collected using a form in the created application. ManageEngine AppCreator incorporates reports as one of the components to complete the purpose of the application that you create. A report collates and presents information to help the user anaylze, track, or record data. Conventionally, a report comprises information that is gathered and put together with the intention of displaying, viewing, scrutinizing, tracking, or simply recording details. Reports are made up of text, figures, graphic, and/or audiovisual information.

All reports in ManageEngine AppCreator are based on forms and the inputs from the forms constitute the records in the reports. Information gathered using a form needs to be presented for viewing. It is stored in the application itself and reports help present it in a meaningful way. When you create a form, a list report with standard table layout will be generated automatically when a form is created.
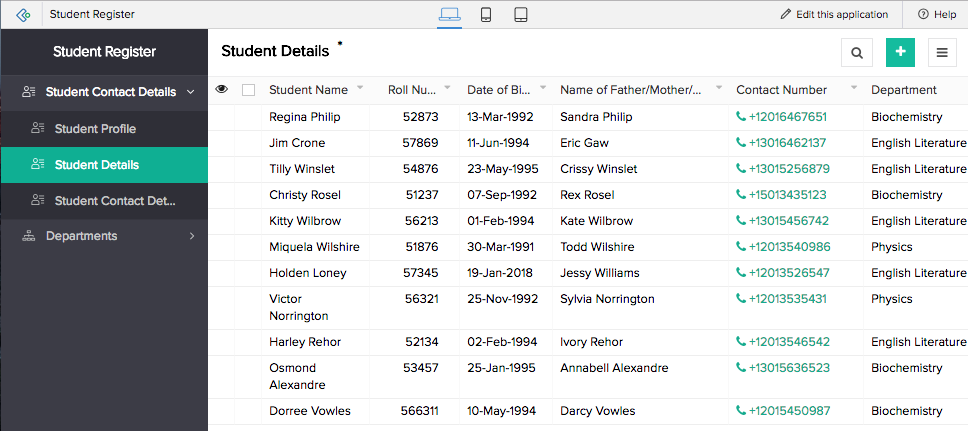
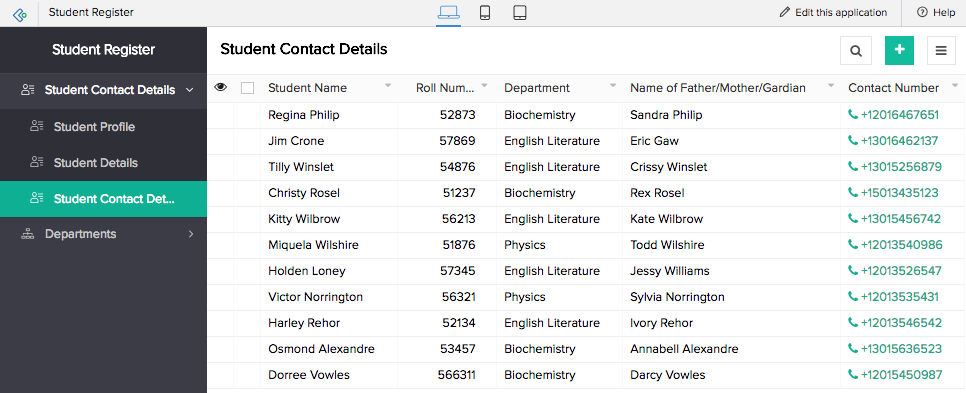
ManageEngine AppCreator offers a range of functions to help create efficient, functional reports that fulfil specific business needs. You can use charts, diagrams, images, and audiovisual files, create criteria to filter information, arrange data by category, and use charts, diagrams, images, and audiovisual files. You can also create more than one report based on a single form. For instance, if you have a form that gathers complete student profiles, your default report captures all the information. However, you can create multiple reports using this one form, for example:
- A Student Contact Details report that extracts contact information from the report containing the complete profiles of all the students.
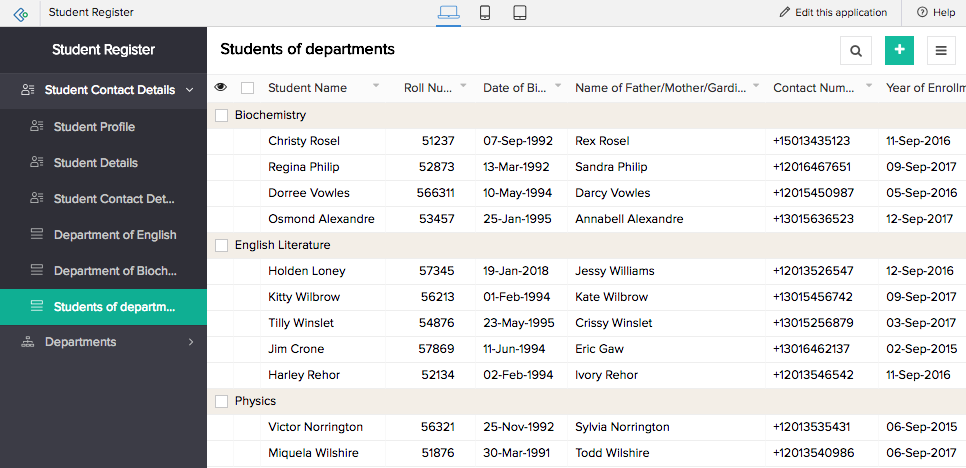
- A Department Details report that categorizes students based on departments.
- A report for a specific major which filters the records and only displays those which meet this criteria. You could create separate reports for each major from a single form.

- A performance analysis report. In this scenario, you have a second form that contains students' grades and marks. Your complete student profile report can contain fields which look up values from the grades form, which allows you to create the performance analysis report, containing fields and values from the two different forms.
Report features and capabilities
General features
- Quick view: View the entire report and glance through the records.
- Detail view: View all information for a single record, and quickly gain insights from related data.
- Quick view layout: The report is structured in a quick view layout that makes the data comprehensive.
- Detailed view layout: View record information as label and value pairs or in a format that displays more information.
- Quick view actions: System actions like add, print, export, edit, delete, duplicate, and view records allow you to interact with the report in the quick view interface.
- Detail view menus: System actions like add, print, edit, delete, and duplicate allow you to interact with an individual record.
- Quick view gestures for browser, mobile, and tablet: Gestures associated to system or custom actions will help you execute actions or display the associated actions in the report.
- Action items: Scripted actions created exclusively to meet specific purposes in the report.
- Filtered report (criteria-based records): The filtered report features records that match a particular criteria. The criteria serves as a predetermined filter, enabling you to view and access only selected records from the report.
- Grouped records (based on specified fields): Records can be categorically organized into groups based on specific field values, enabling the report to provide field-based insights into the data.
- Sorted records: Report that displays the records in a predetermined sequence.
- Print templates for report: Templates created to print the records in a different layout are available when you select Print. The printed records are output in the format of the chosen template.
- Conditional formatting in report: Highlights or draws attention to key aspects or particular field values that require emphasis. The formatting is based on defined conditions and the values that match the conditions are highlighted.
CRUD operations
- Add button: You can add a new record to the report. Clicking the add button opens the form in a pop-up window.
- Duplicate record: Make a copy of a record in the same report.
- Edit record: Make changes to an existing record in the report. Clicking edit opens the form in a pop-up window where the changes can be made and submitted.
- Bulk edit: Bulk edit enables you to make changes to the field values of all or a subset of records. This makes it easy to make uniform changes across multiple records.
- Bulk delete: Bulk delete allows you to permanently remove all or a subset of records from the report.
- Bulk duplicate: Bulk duplicate allows you to make copies of all or a subset of records in the same report.
- Import records: You can import data into the report from external sources. It allows you to browse and upload records from local drive or cloud and copy and paste data to make a report.
- Delete record: You can permanently remove a record from the report.
Offline capabilities
- Export as spreadsheet: Export the report as a Spreadsheet.
- Export as pdf: Export the report as a PDF.
- Export as html: Export the report as HTML.
- Export as xml: Export the report as XML.
- Export as json: Export the report as JSON.
- Export as csv: Export the report as CSV.
- Export as tsv: Export the report as TSV.
- Print as list: Select a list layout when printing the records. This will not change the layout of the report in web, mobile, or browser.
- Print as summary: Select a summary layout when printing the records. This will not change the layout of the report in web, mobile, or browser.
- Save offline: Save records offline on your phone to avoid certain difficulties caused by lack of network connectivity.
Application features
- Search: Search for required information in the report. Search operators help define how the records will be filtered and displayed. Multiple conditions can be used to narrow down the displayed records.
- Quick filters: Help you view particular records based on specific field values. Filters are choice field values and date or date-time field values. When one of these values are selected, only the records that match the selection are displayed.
- Show as list: View a report as a list report.
- Show as spreadsheet: View a list, calendar, timeline, or kanban report as a spreadsheet.
- Show as kanban: View a list, calendar, timeline, or spreadsheet report as a kanban report. This switch will be enabled if there are single select dropdown or single select lookup fields in the report.
- Show as timeline: View a list, calendar, spreadsheet, or kanban report as a timeline report. This switch will be enabled if there are date-time fields in the report.
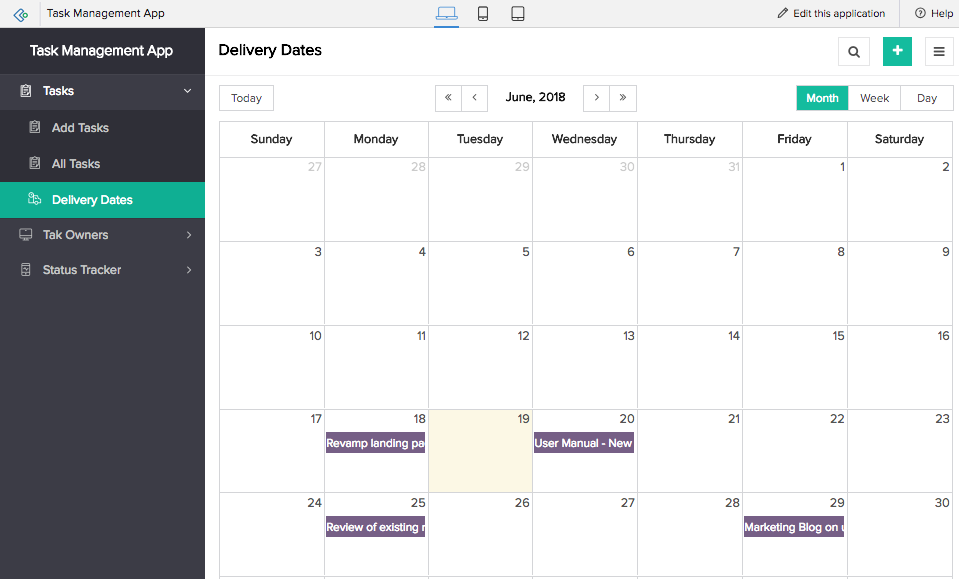
- Show as calendar: View a list, timeline, spreadsheet, or kanban report as a timeline report. This switch will be enabled if there are date or date-time fields in the report.
Calendar and Timeline features
- Month view - You can view a month's worth records in a calendar or timeline report.
- Week view - You can view a week's worth records in a calendar or timeline report.
- Day view - You can view a day's worth records in a timeline report.