- Home
- Logging Guide
- IIS server log analyzer
- How to locate, view, read, and monitor IIS logs
IIS logs: How to locate, view, read, and monitor
In this page
- What are IIS logs?
- IIS access logs vs IIS error logs
- Step-by-step instruction on how to locate IIS log files
- How to enable logging in your IIS web server
- How to view and read IIS logs
- Simplifying IIS log access and analysis
What are IIS logs?
Microsoft IIS is a widely used web server application for hosting websites. IIS logs are files that the server writes every time it handles a request. When someone loads a page; a bot scrapes a URL; an API client fires a POST, each of those interactions produces a log entry describing what happened. Because every request leaves a trace, monitoring and analyzing IIS server logs lets you spot malicious activity, unusual request patterns, failed logins, or suspicious URLs before an attacker gains a foothold in your network.
A single entry captures the request timestamp, the client's IP, the HTTP method, the URL requested, the response status code, bytes sent and received, the user agent string, and how long the server took to respond. IIS keeps logs per website: each site gets its own folder inside the LogFiles directory, named after its site ID.
Two categories of log matter here. Access logs, in W3C Extended format by default, record requests that reached your worker process. Error logs, stored separately from access logs, capture failures that happened before the request got that far.
IIS access logs vs IIS error logs
Access logs capture every HTTP request that made it to a website's worker process. They use the W3C Extended Log Format by default (IIS also supports IIS format and NCSA Common, but W3C is what you'll almost always see), and they live in %SystemDrive%\inetpub\logs\LogFiles\W3SVC[site-ID]\ with one folder per site. This is where you look for who requested what, when, and what response code they got back.
Error logs, also called HTTPERR logs, capture failures that happened before IIS handed the request off to a site. The HTTP.sys kernel-mode driver writes these when it rejects a request outright: malformed HTTP, connection timeouts, connections that dropped mid-transfer, and scenarios where no worker process was available to take the request. HTTPERR files live in %SystemDrive%\Windows\System32\LogFiles\HTTPERR\ and, unlike access logs, sit in a single folder for the whole server. Each entry names the site involved.
Which one to check depends on what you're troubleshooting. If a page loaded and returned an error status, start with the access log for that site and inspect the sc-status field. If the site isn't responding at all, or you're seeing generic "Service Unavailable" messages with no matching access log entries, check HTTPERR. Dropped worker processes and connection-level failures show up there. Slow-page complaints belong in the access log too, under the time-taken field. And when you suspect a probe or scan that's throwing malformed requests, HTTPERR often catches attempts that never made it into the site's own log.
If IIS logged a 4xx or 5xx in an access log, IIS parsed the request and knows what was asked for. If the failure only shows up in HTTPERR, something broke before IIS could parse the request properly.
To locate the IIS log files of a website, you need the following:
- The site ID
- The directory
You can find them in IIS Manager by following these simple steps:
Launch IIS Manager
Go to Windows Control Panel > System and Security > Administrative Tools > Internet Information Services (IIS).
OR
Open the Run dialog box > type inetmgr > click OK.
IIS Manager will be launched.
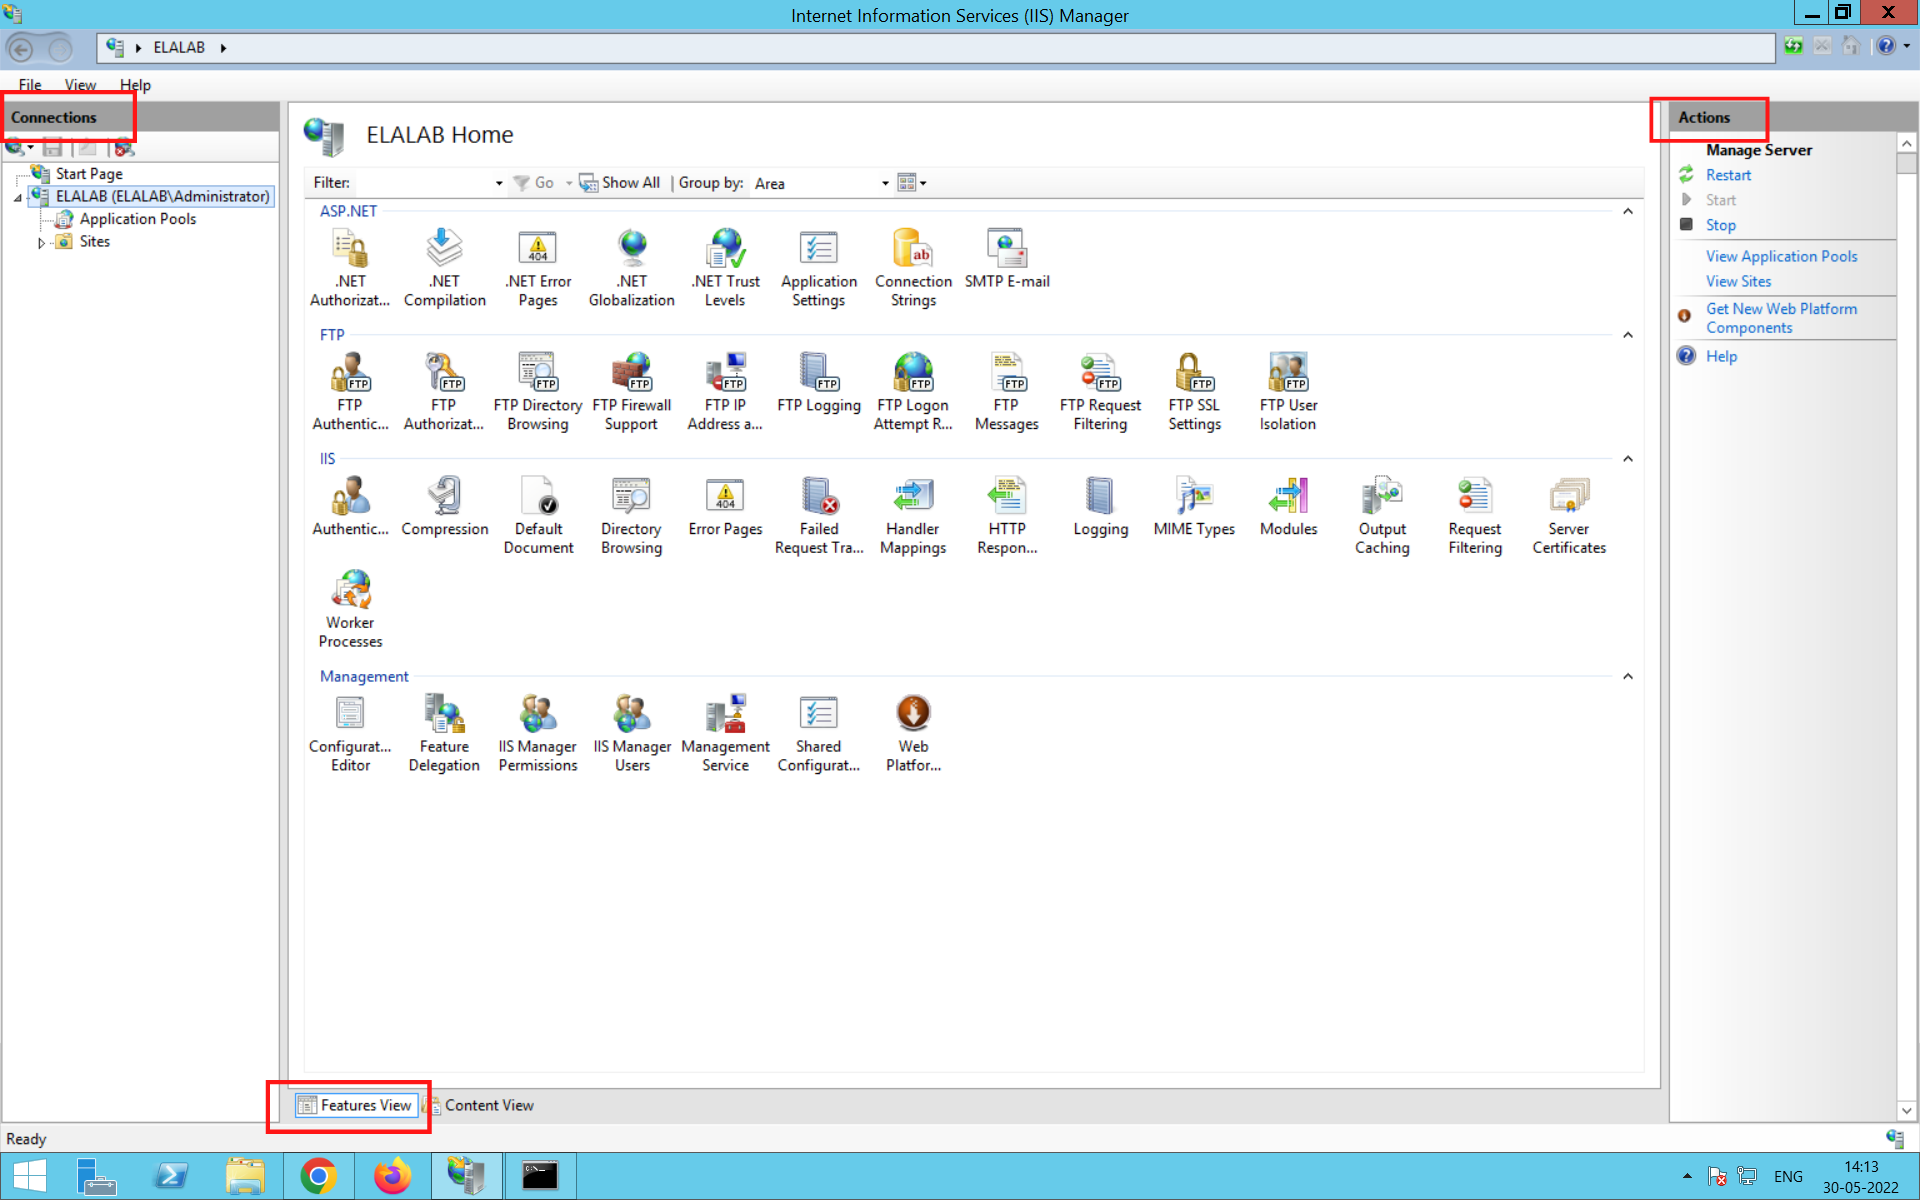
- The Connections pane
- The Features View
- The Actions pane
Make sure to locate them to follow along with the remaining steps.
Finding the site ID:
The site ID is used to uniquely identify the log folders of different websites.
- In the Connections pane, click the Sites drop-down menu and find the list of all websites hosted in the IIS server. The site ID of all websites will be displayed in a list view.
- In the Actions pane, click the Settings option. The site ID will be displayed in the Advanced Settings window.
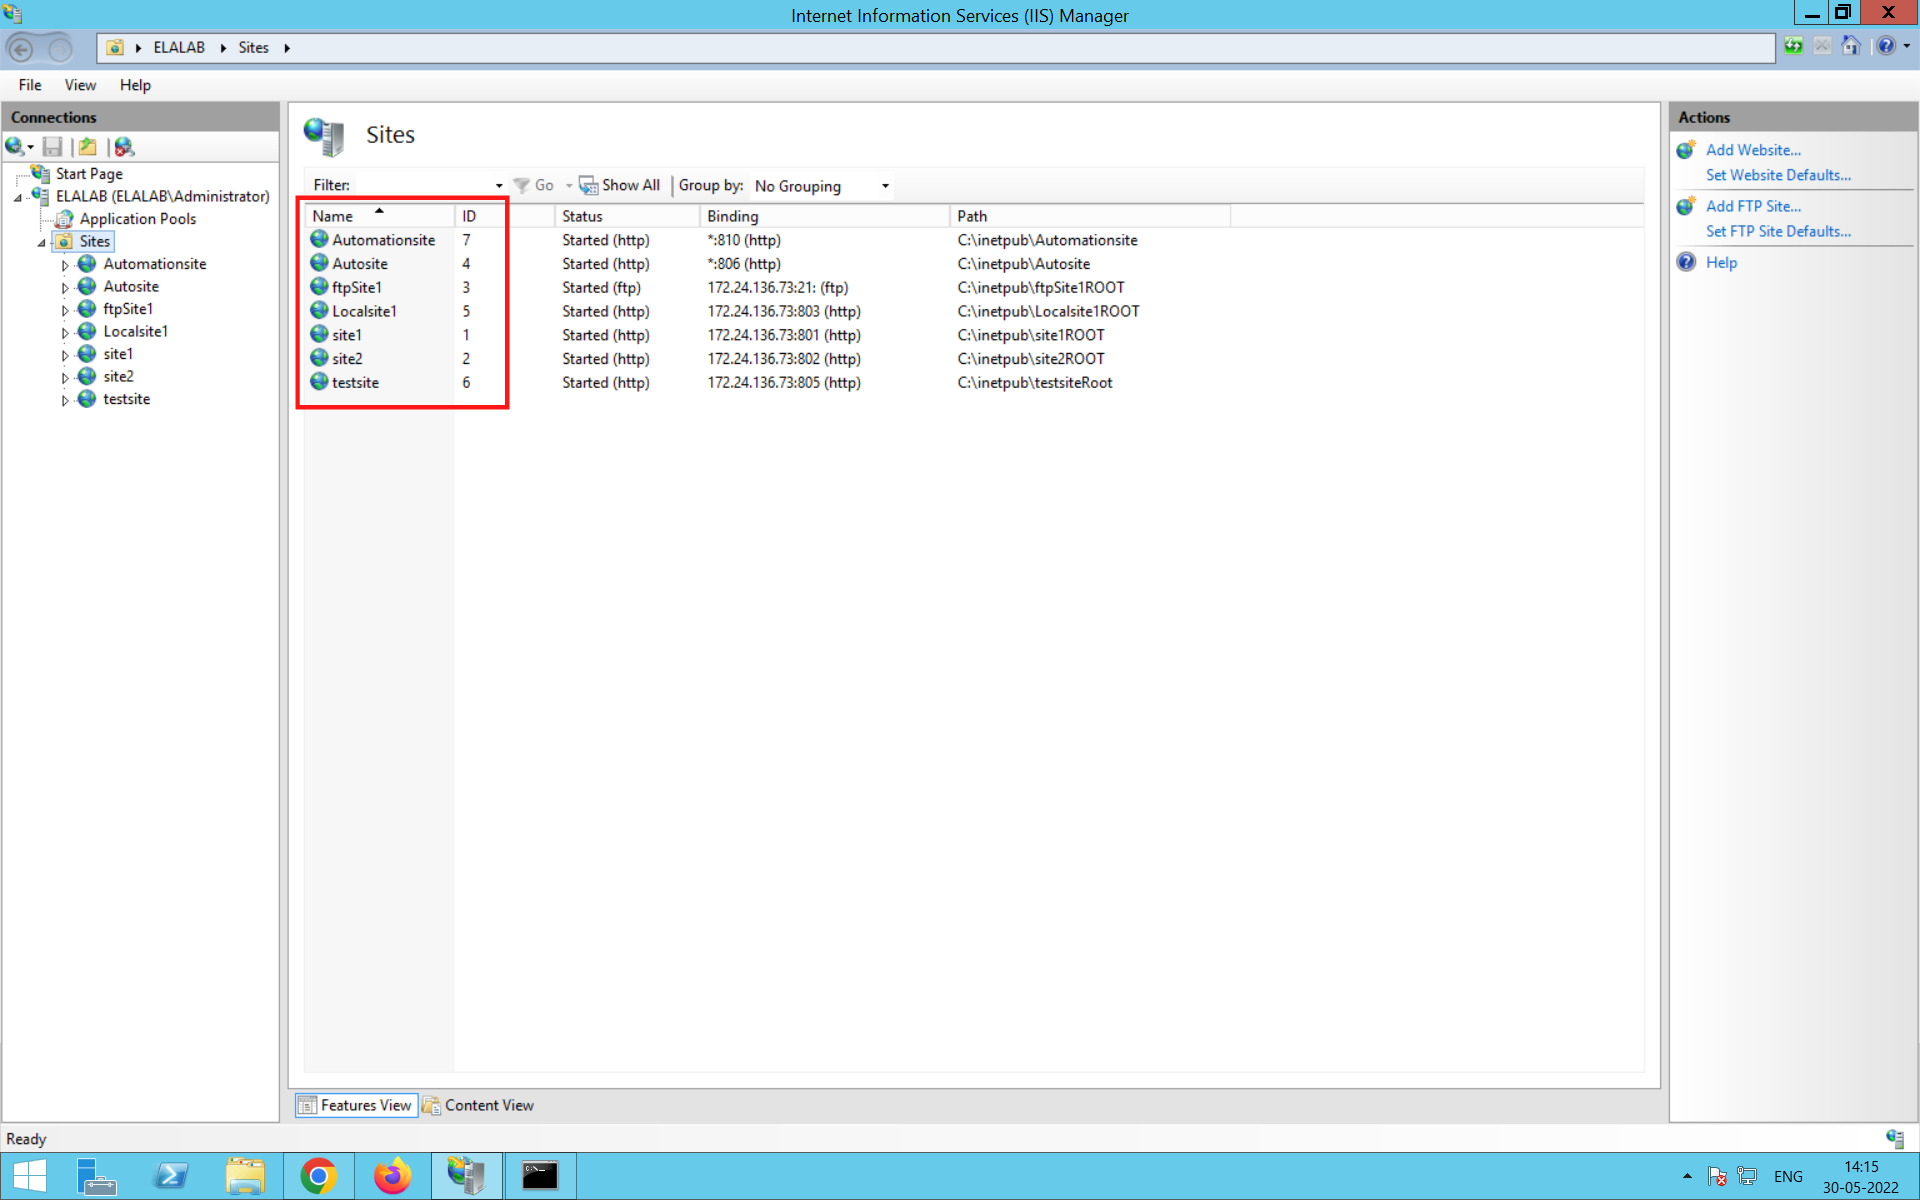
If you cannot find the ID, follow the next step
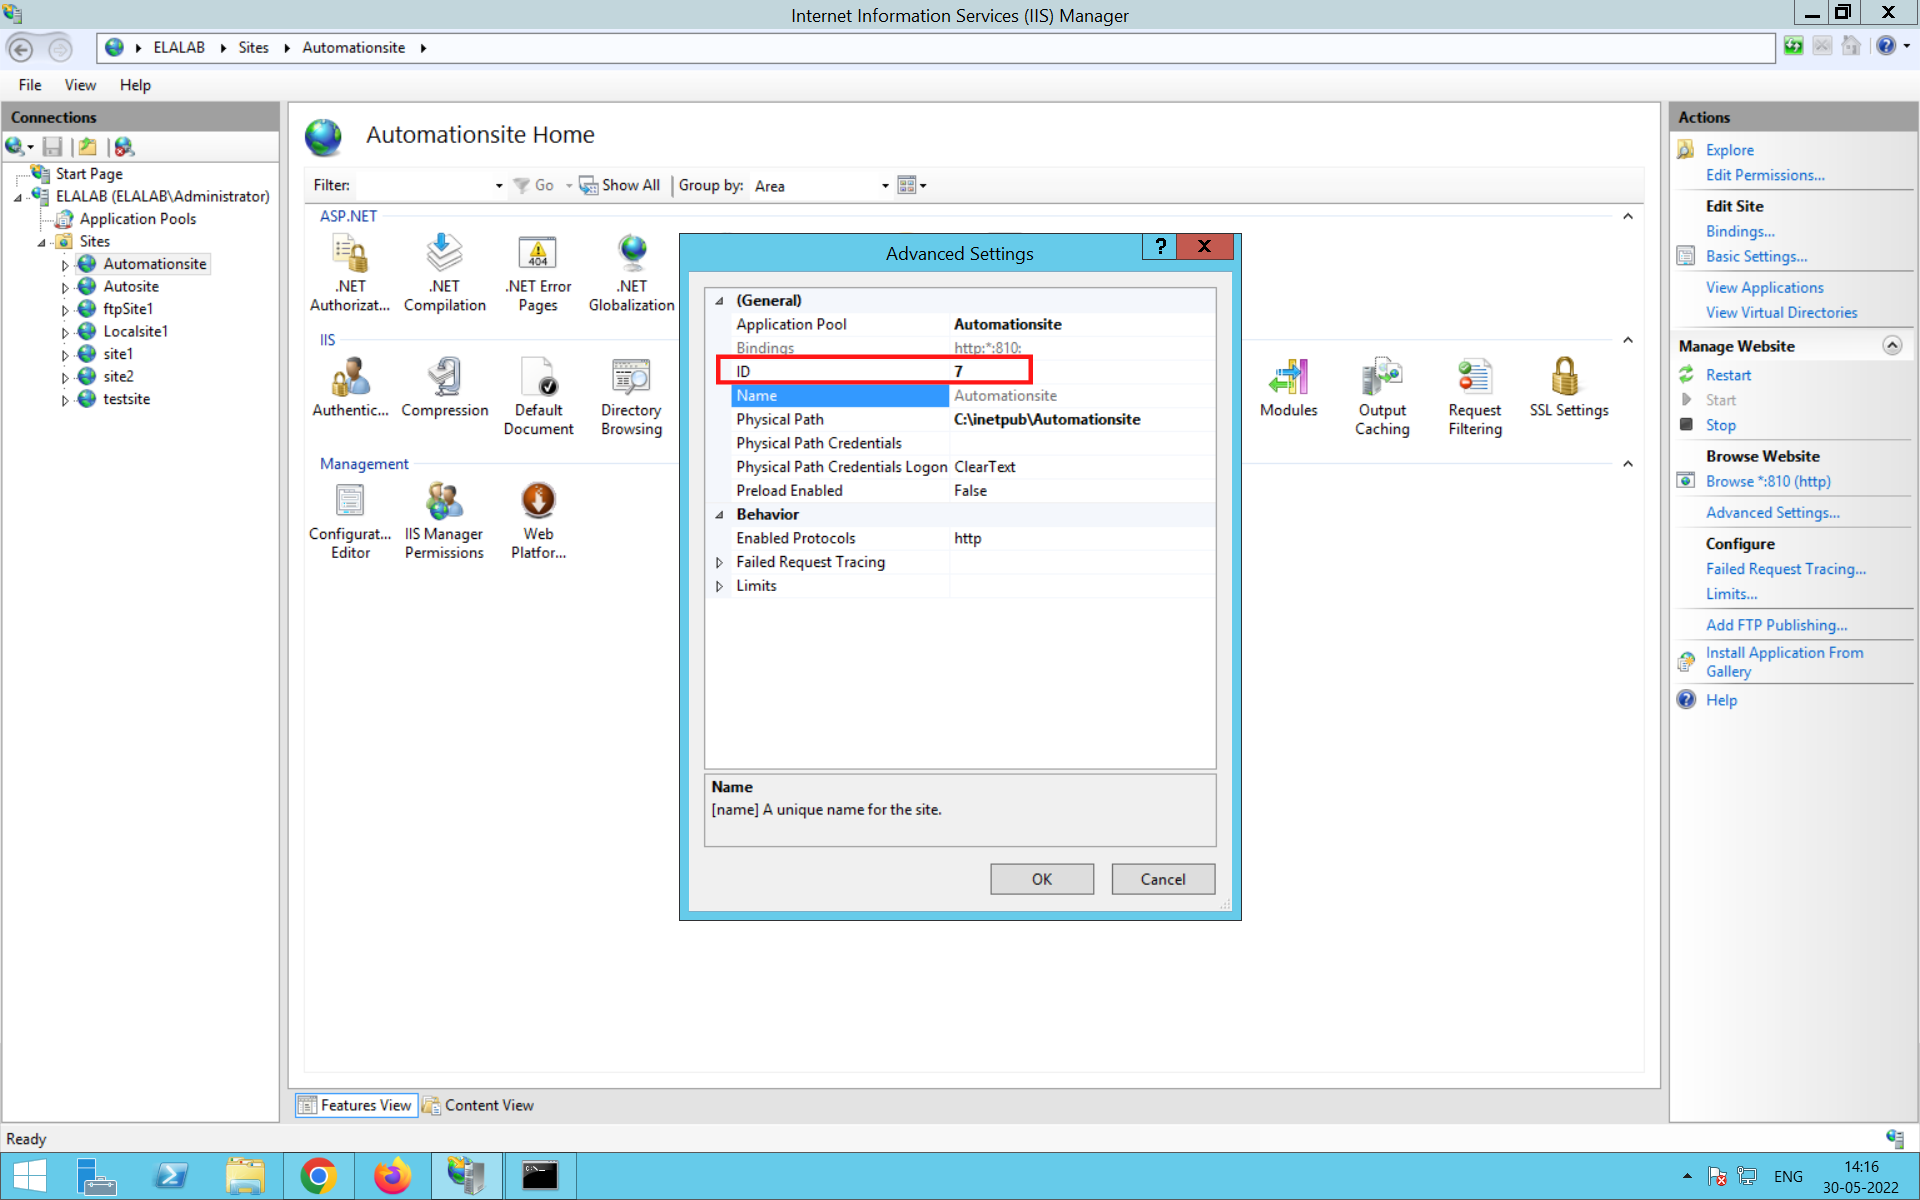
Finding the location of the IIS log files:
Generally, IIS log files are stored in this default path:

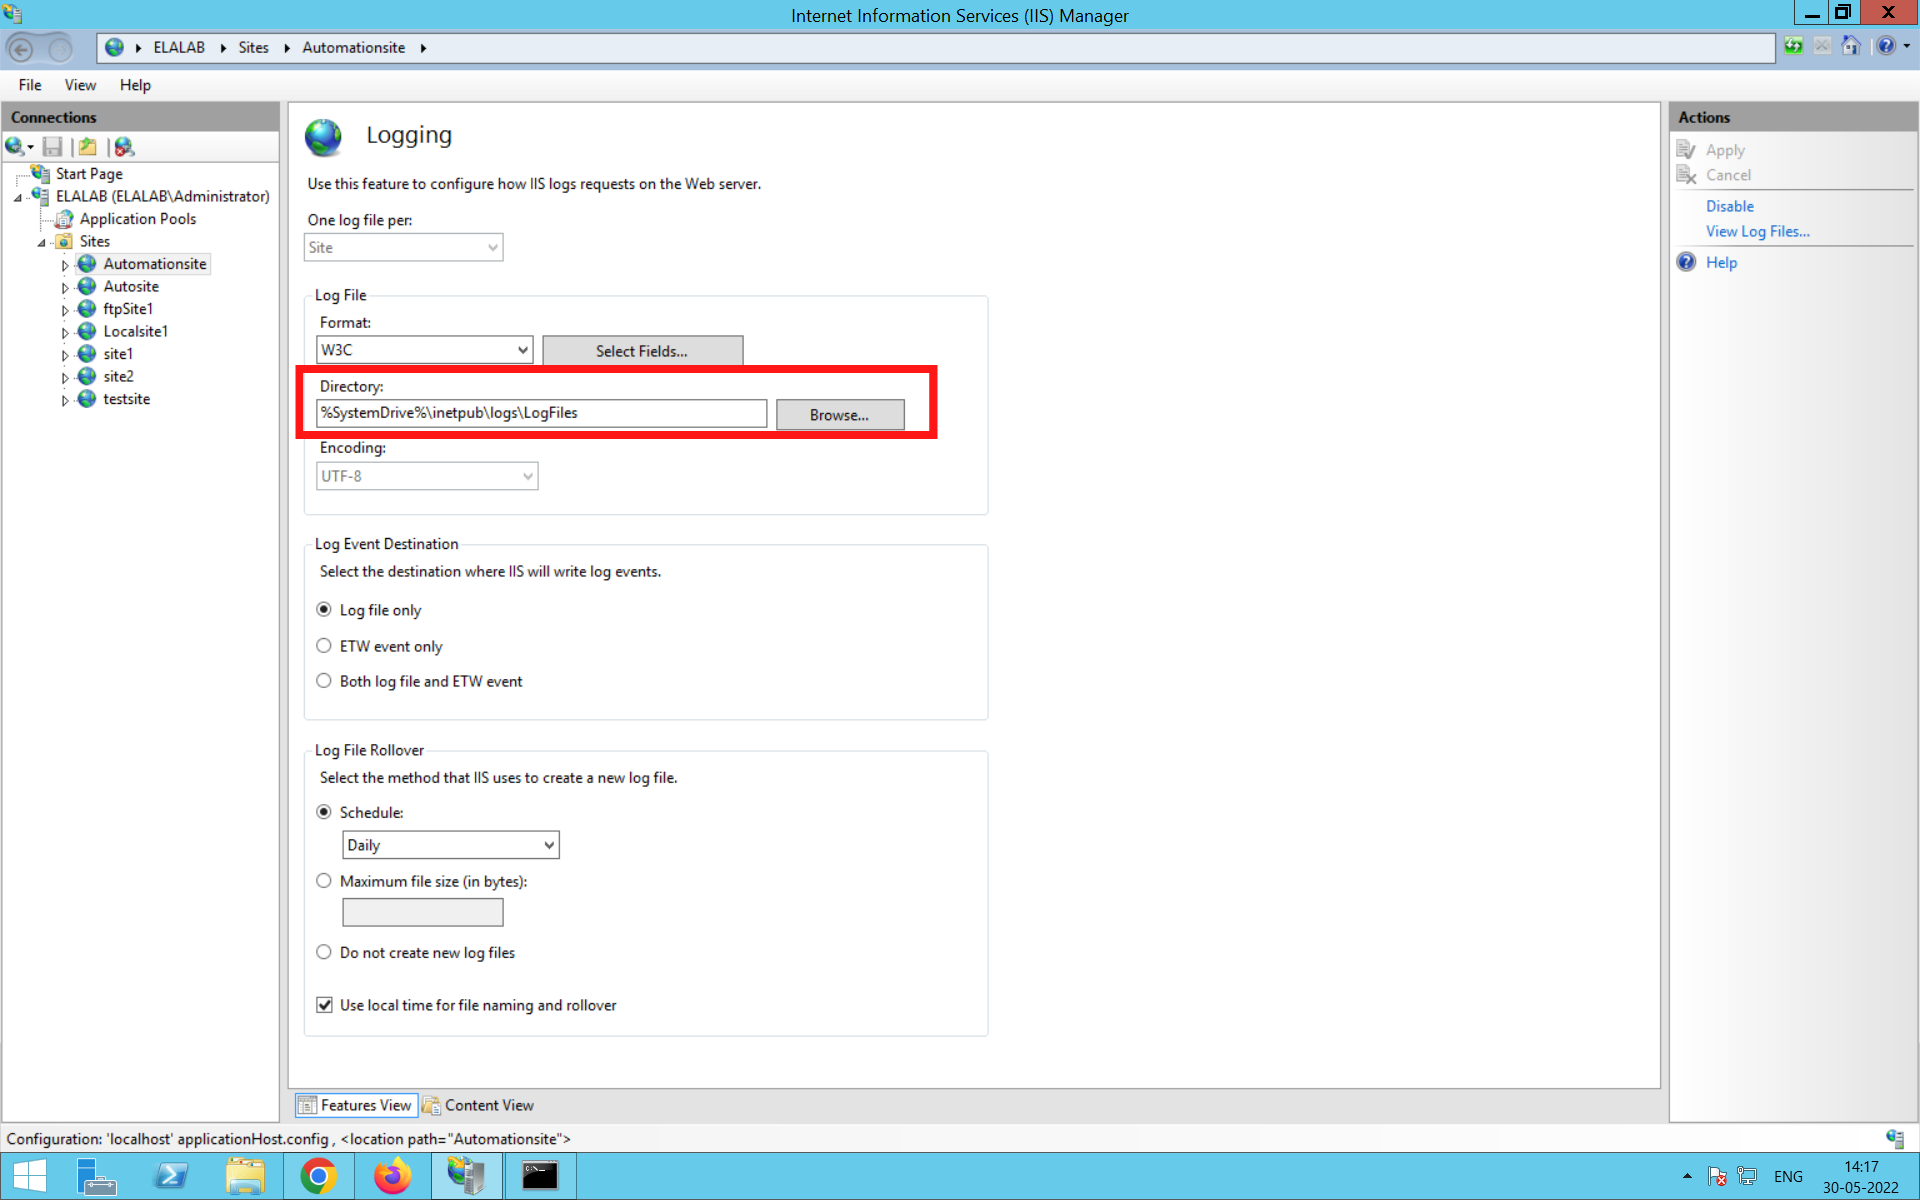
%SystemDrive%\inetpub\logs\LogFiles
- Go to Windows File Explorer > C Drive > Inetpub folder > Logs folder > LogFiles.
- In IIS Manager, after selecting a website in the Connections pane, select Features View and double-click the Logging icon. The logging window will open. Scroll through to find the Directory field and use the path mentioned there to locate your log files.
Once you open the LogFiles folder, you will find multiple sub-folders of

    different websites named in this pattern: W3SVC +Site ID.

    If your site ID is 10, then open the folder named W3SVC10.
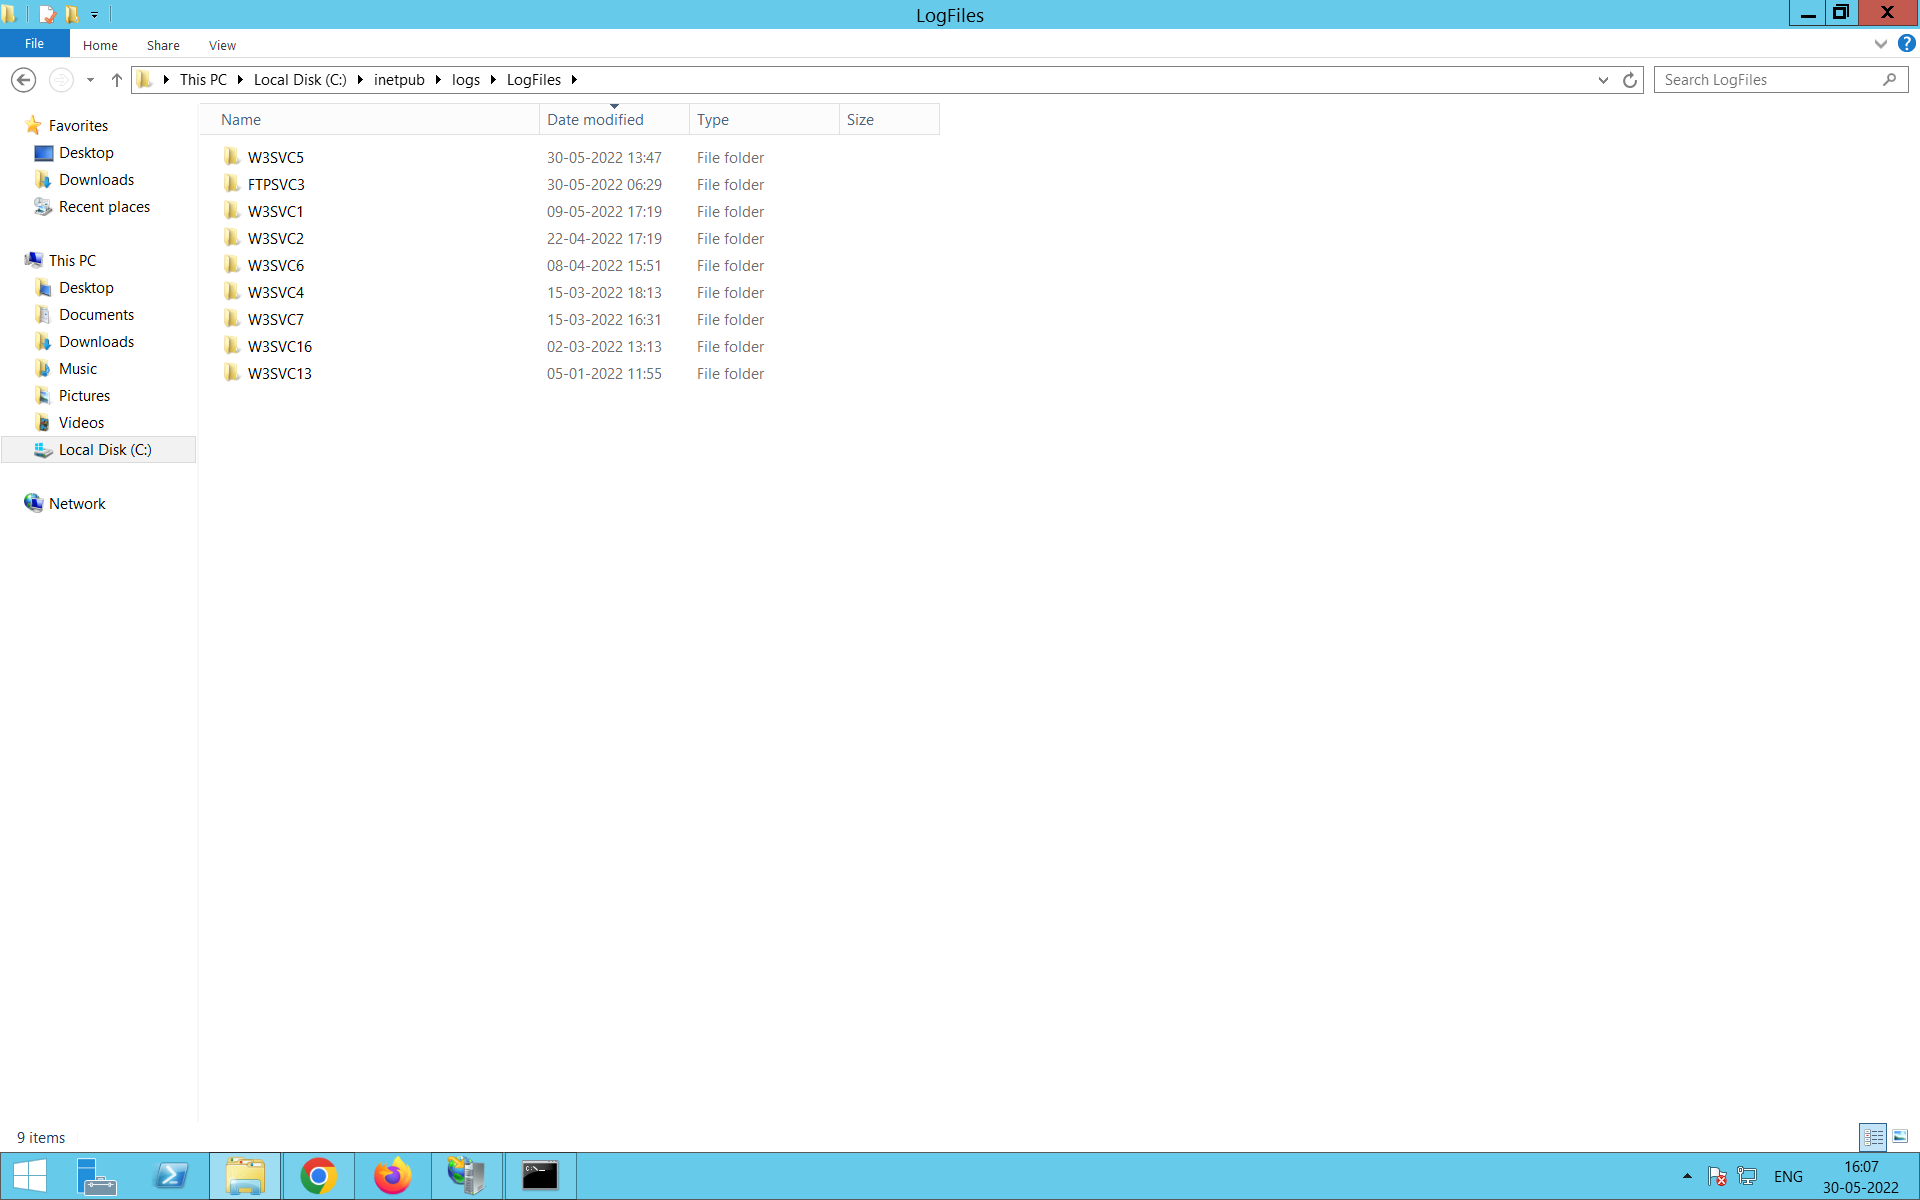
In case the folders can’t be found in this default path, follow the next step
Locating log files of earlier IIS versions:
Identify which version of IIS is used by your server.
For versions IIS 1.0-IIS 6.0, follow these steps to locate your log files:
- Launch IIS Manager.
- In the Connections pane, click the Sites menu. Find the site for which you want to view the logs, right-click it, and select Properties.
- From there, go to Active Log Format > Website tab > General Properties, then scroll down to find the directory field.
         The full path along with the sub-folder name will be displayed like this:

%SystemDrive%\Windows\System32\LogFiles\W3SVC8
If you're still unable to find the IIS log files, it's possible logging might have been turned off.
How to enable logging in your IIS web server
Open IIS Manager. In the Connections pane, click the website you want to enable logging for > click Features View > double-click the Logging icon > click Enable in the Actions pane.
How to view and read IIS logs
IIS log files are plain text, so any text editor will open them. Notepad works for a quick look, but the files get large fast (a busy server can push hundreds of MB per day), so Notepad++, Visual Studio Code, or PowerShell's Get-Content -Tail 100 is a better bet for anything sizable. For serious analysis, LogParser and LogParser Studio remain the classic Microsoft tools. Both let you run SQL-style queries directly against W3C log files.
Open a log and you'll see something like this:
#Software: Microsoft Internet Information Services 10.0
#Version: 1.0
#Date: 2025-03-15 00:00:01
#Fields: date time s-ip cs-method cs-uri-stem cs-uri-query s-port cs-username c-ip cs(User-Agent) cs(Referer) sc-status sc-substatus sc-win32-status     time-taken
2025-03-15 14:22:03 192.168.1.10 GET /products/report.aspx id=447 443 - 203.0.113.45 Mozilla/5.0+(Windows+NT+10.0;+Win64;+x64) https://example.com/dashboard 200 0 0 156
Lines beginning with # are directives. The #Fields: directive is the important one; it names each column of the log entries below it. IIS only writes the fields you enable in the Logging feature, so disabled fields don't appear in the file at all.
Here's what each standard W3C field means:
| Field | What it captures |
|---|---|
| date, time | UTC date and time of the request. IIS logs in UTC by default, so don't assume your local timezone. |
| s-ip | The IP address of the server that received the request. Useful when a machine hosts multiple sites on different IPs. |
| cs-method | HTTP method: GET, POST, PUT, DELETE, HEAD, and so on. |
| cs-uri-stem | The path portion of the URL requested. |
| cs-uri-query | The query string without the leading ?. A hyphen (-) means no query string was sent. |
| s-port | The port the request hit. Usually 80 for HTTP, 443 for HTTPS, or a custom port if you've bound one. |
| cs-username | The authenticated user. Anonymous requests log as -. |
| c-ip | The client's IP address. Behind a load balancer or reverse proxy, this will show the balancer's IP unless you've configured X-Forwarded-For handling. |
| cs(User-Agent) | The client's user agent string, with spaces replaced by +. |
| cs(Referer) | The URL that linked to this request. Often - for direct navigation or when the browser strips referer headers. |
| sc-status | The HTTP status code IIS returned: 200, 301, 404, 500, and so on. Your first stop when triaging errors. |
| sc-substatus | IIS's more specific sub-code. 401 with substatus 2 means an authentication configuration issue; 401.3 means access denied by ACL. |
| sc-win32-status | The underlying Windows error code. Zero means no error. Non-zero values map to Windows system error codes and often explain why a status like 500 was returned. |
| time-taken | Request duration in milliseconds, measured from when IIS received the first byte to when it sent the last response byte. |
When triaging errors, filter by sc-status first. Grouping by code (all 500s, all 404s) cuts the noise fast.
time-taken includes network latency between server and client, not just server-side processing. A single slow request over a bad connection can look like a server-side problem when it isn't.
If cs-username is populated on a site you didn't expect authenticated traffic on, check whether Windows Authentication is enabled.
The #Fields directive can change partway through a file when logging settings are updated. If you're parsing programmatically, re-read that directive every time you encounter one, and don't assume column positions stay fixed.
Simplifying IIS log access and analysis
Manually enabling IIS web server logging and analyzing the logs is quite tedious. To overcome this challenge, we have log management tools like ManageEngine EventLog Analyzer that automate the collection, monitoring, analysis, and retention of your IIS web server logs in a central server.
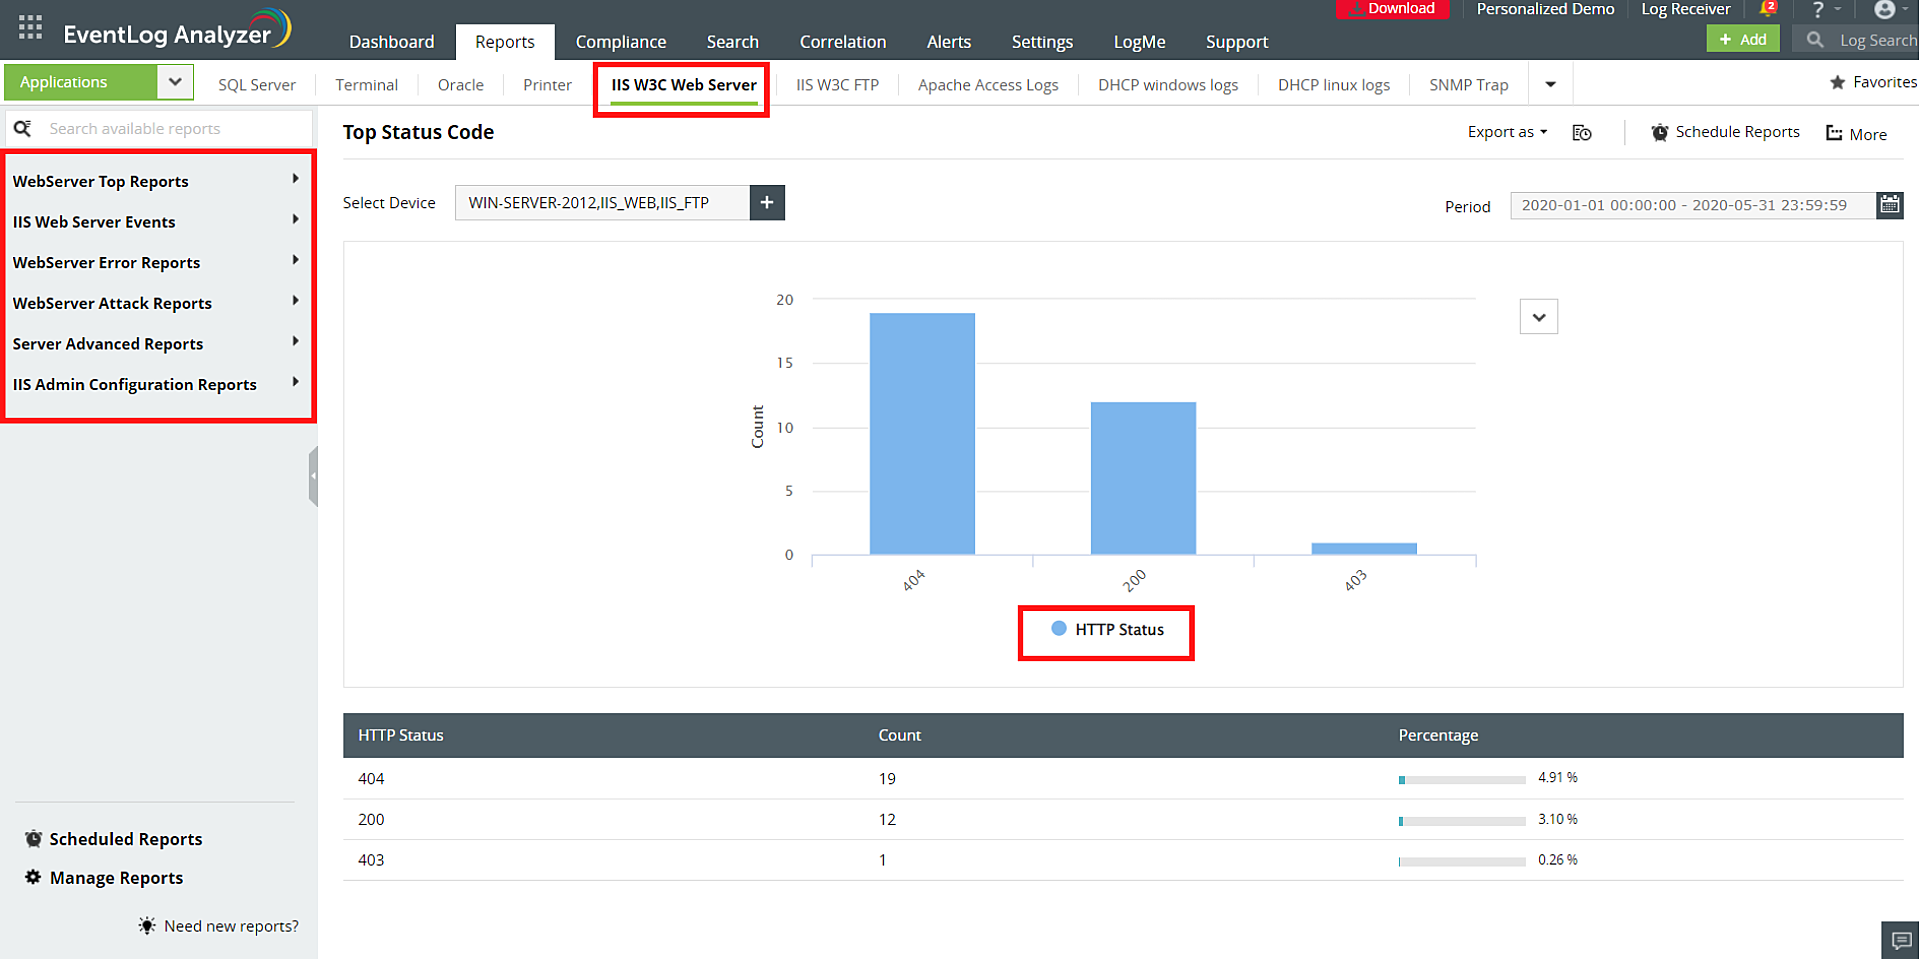
Apart from generating real-time alerts and reports for IIS server incidents, EventLog Analyzer also provides deeper insights into critical information such as HTTP status code summaries, password changes, top users, admin resource accesses, and server configuration changes.
Check out and download a 30-day, free trial of EventLog Analyzer here.