The Alerts tab gives an overview of all the alerts raised based on the risk scores and detected anomalies.

These alerts are categorized based on their severity as critical, trouble, and attention. To view the alerts in each category, click on the required tab. For instance, clicking on Trouble Alerts will give you a list of all the alerts that indicate a moderate amount of risk in your environment.
To enable pre-built alerts or to add new alert profiles, click on the Manage Profiles button in the top right corner of the alerts tab. The manage profiles page will open.
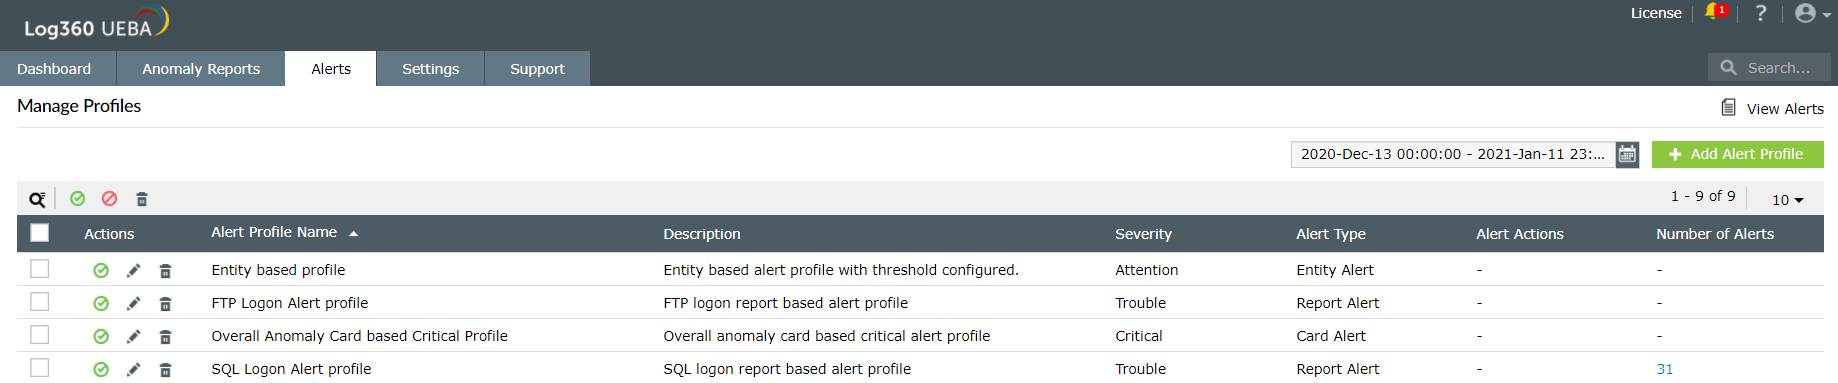
The Manage Profiles page gives an overview of the alert profiles that are currently enabled or disabled. The green-tick icon in the Actions column signifies that an alert has been enabled.
To enable or disable an alert(s):
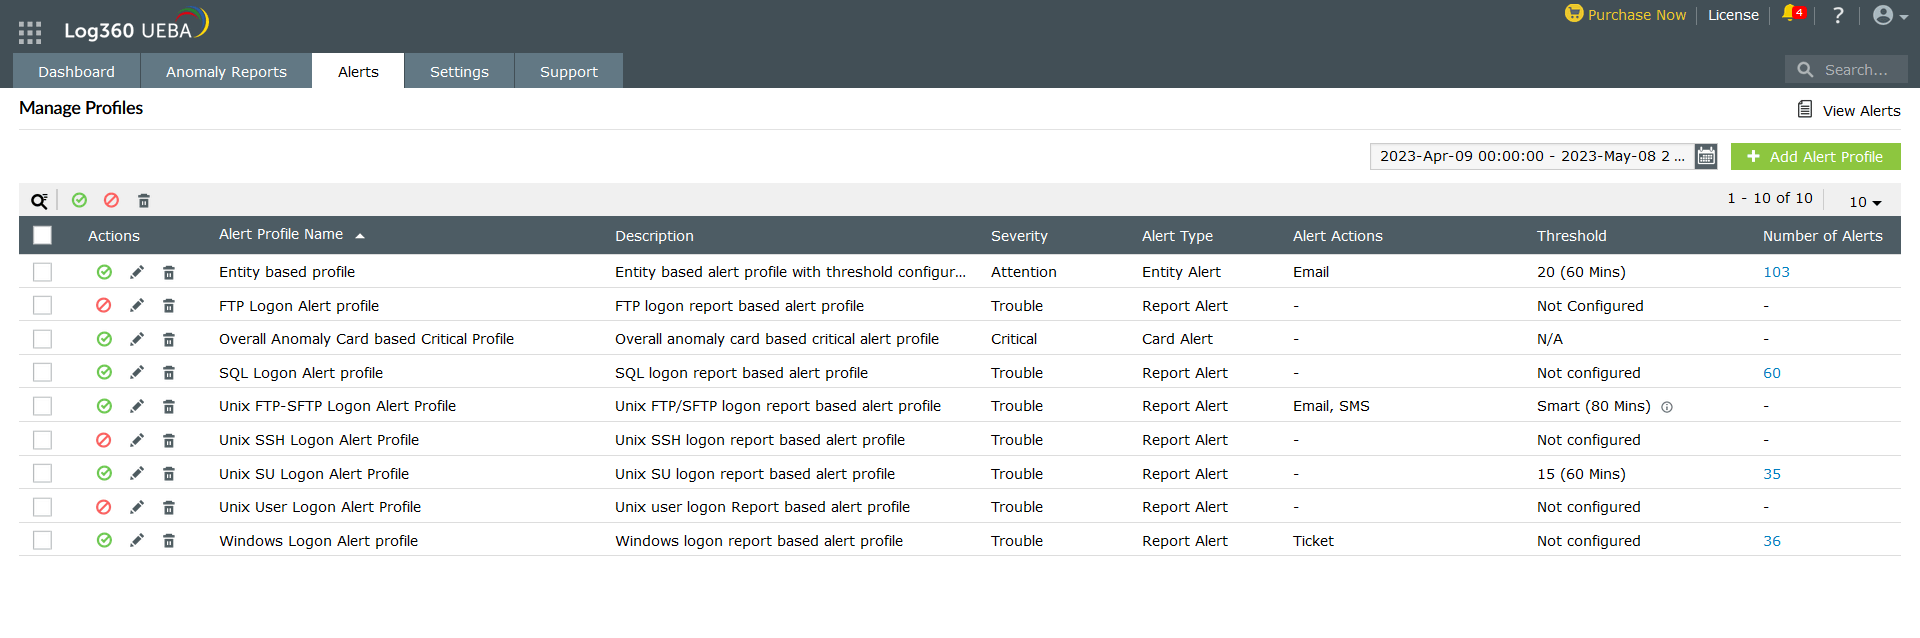
This page also gives you a list of the alert profiles that are available. This includes both default, and created alerts. The number of alerts raised for each profile, the type, the severity, and the threshold will be displayed in the table.
The Number of Alerts column displays the number of alerts raised for each alert profile. By clicking on the number, you will be taken to the list of alerts for that alert profile. There you can see the time at which each alert was raised, the alert format, entity type, status, and the risk score.
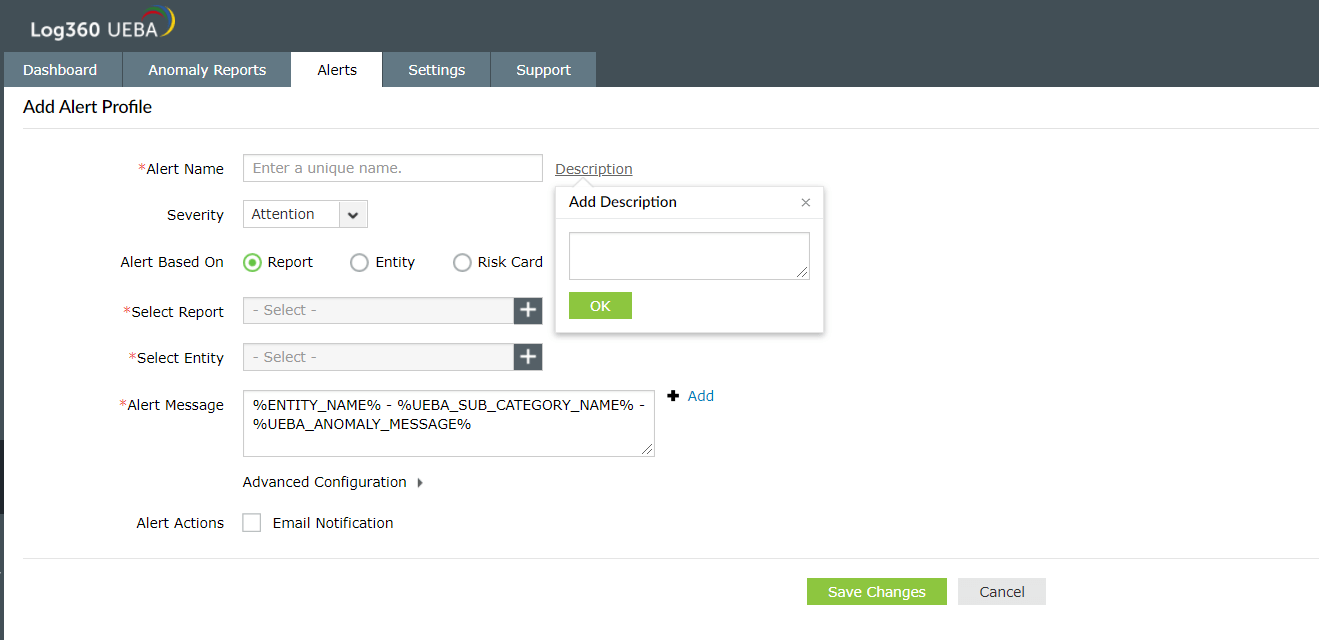
To customize an existing alert profile, click on the edit icon. The Add Alert Profile page will appear. The existing conditions set for the alert to be triggered will be filled-in. For instance, clicking on the edit icon for an existing profile FTP Logon Alert Profile will give you this page as shown below. You can modify the pre-set conditions here.
The solution provides nine default alert profiles. These alert profiles can be enabled, disabled, or customized. The list of available default profiles is shown in the image below.
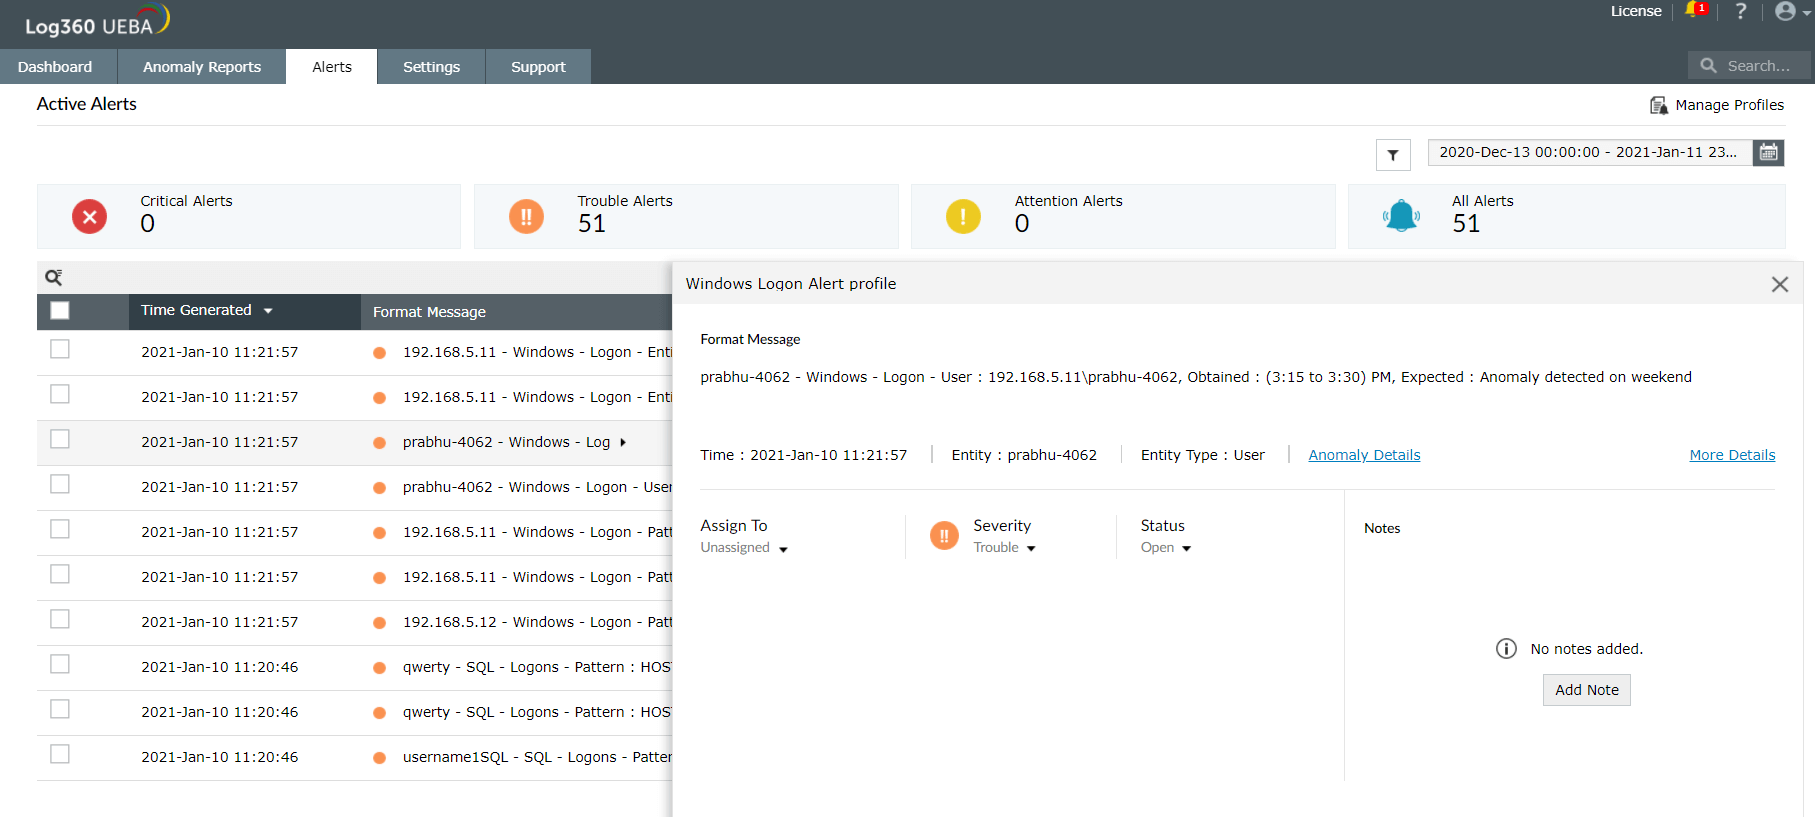
To manage an alert that has been raised, simply click on the alert and the Format Message popup will appear. All the granular details related to the alert and the options to manage it will be available here.
Assign to: Click on the dropdown to assign the technician to investigate the alert.
Severity: You can change the severity of the alert to critical, attention, or trouble by clicking on the drop down provided and selecting the required level.
Status: The status of the alert can be changed to open, closed, or unassigned by clicking on the drop down and selecting the required status.
More details: Clicking on more details will give you information on the threshold, the threshold interval, and more.
Notes: To add a note for an alert, type the message in the space under the notes section and click on save. If a note is added to an alert, it will be displayed next to the checkbox.
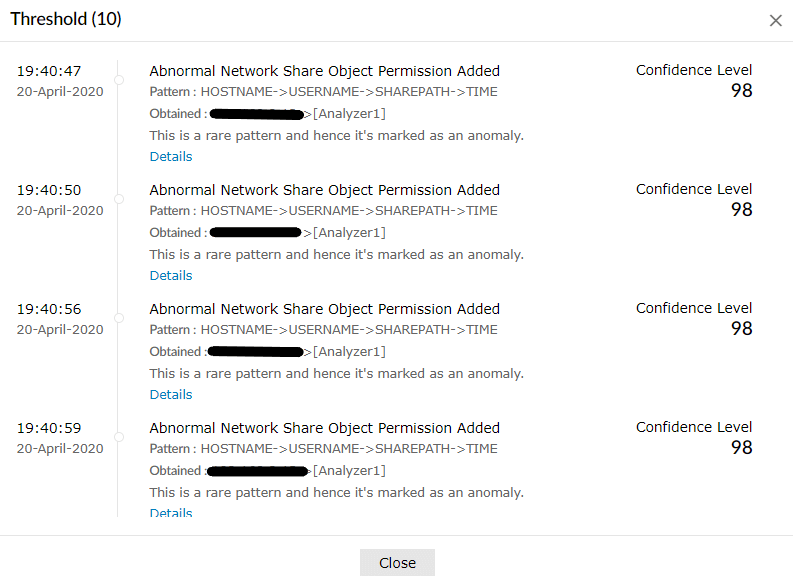
Contributed Anomalies: Clicking on Contributed Anomalies will give you details of each instance that contributed to the alert getting triggered.
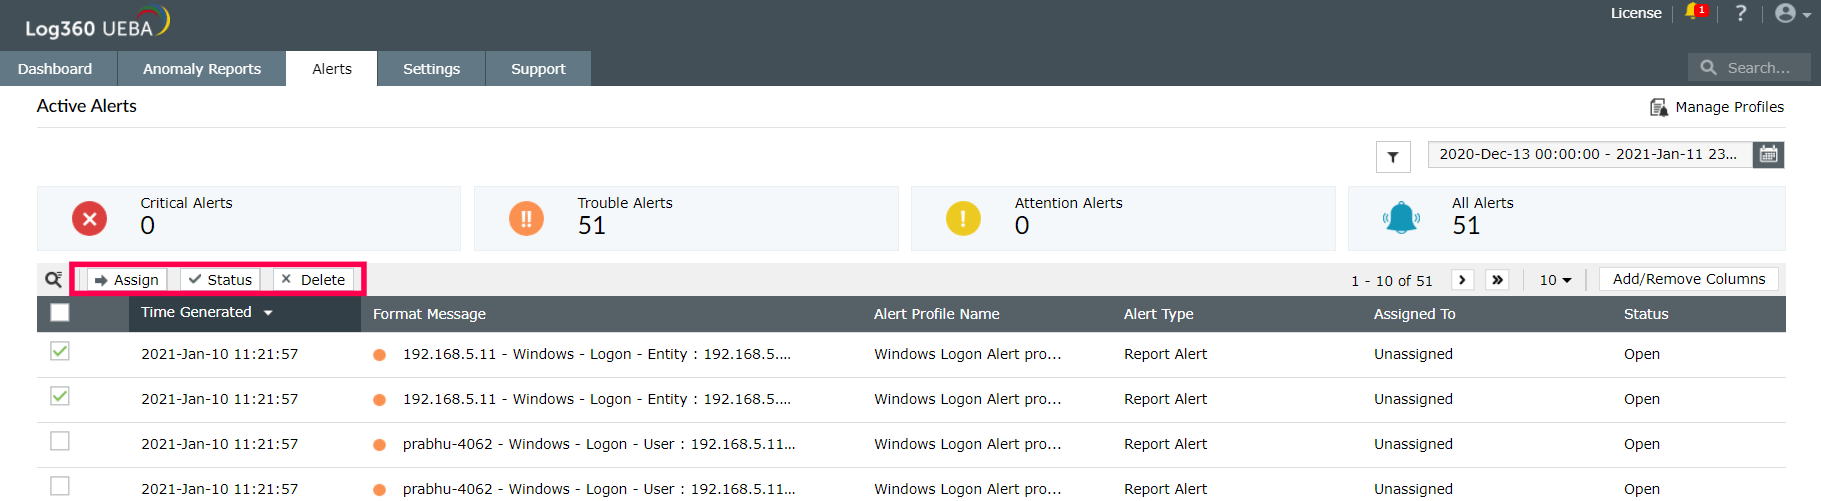
Click on the individual alert or click on the check boxes to select the multiple alerts.
Once the alerts are selected, the options Assign, Status, and Delete will appear. You could use these options to perform bulk enabling or disabling of alerts.
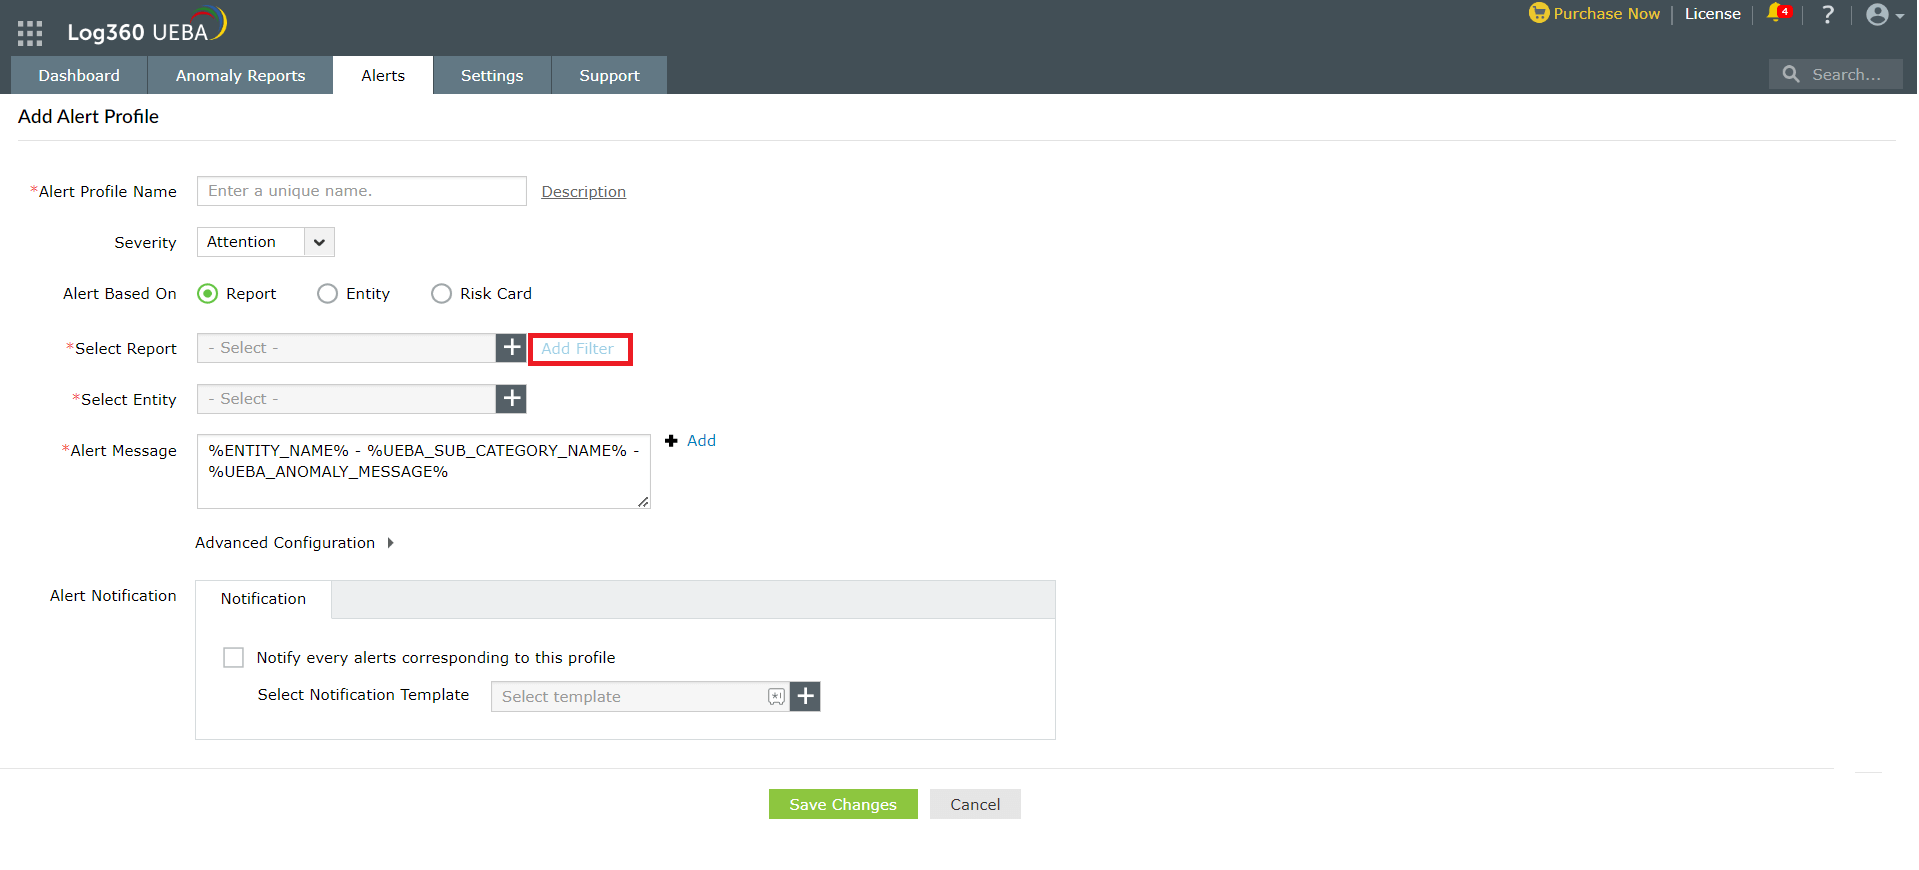
To add an alert profile, click on the +Add Alert Profile button on the top right corner of the screen. The Add Alert Profile page will appear.
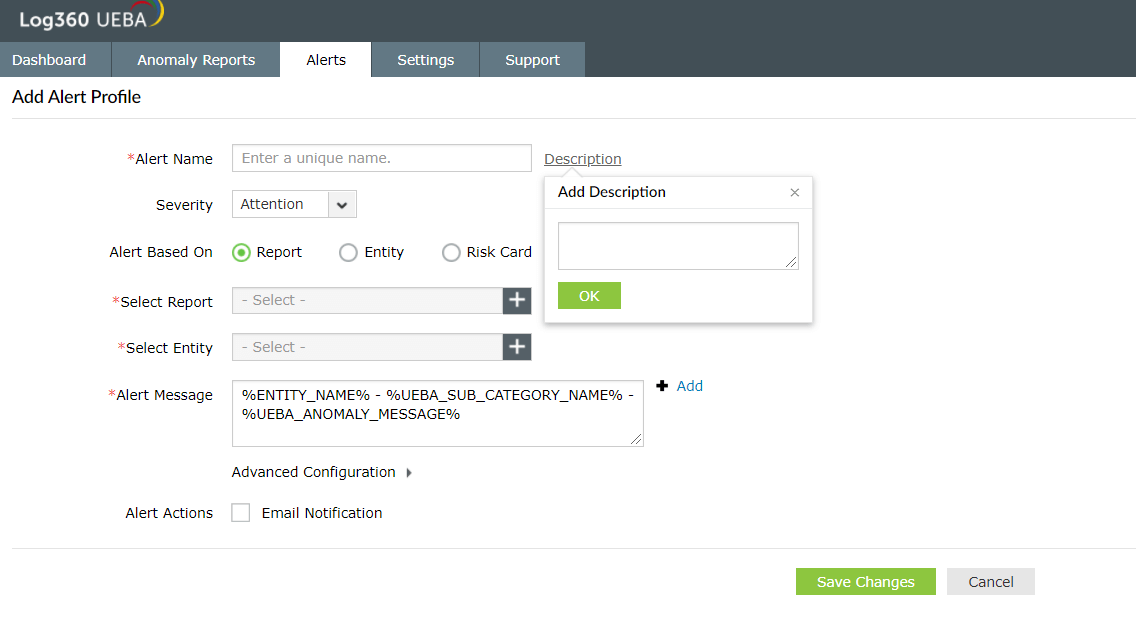
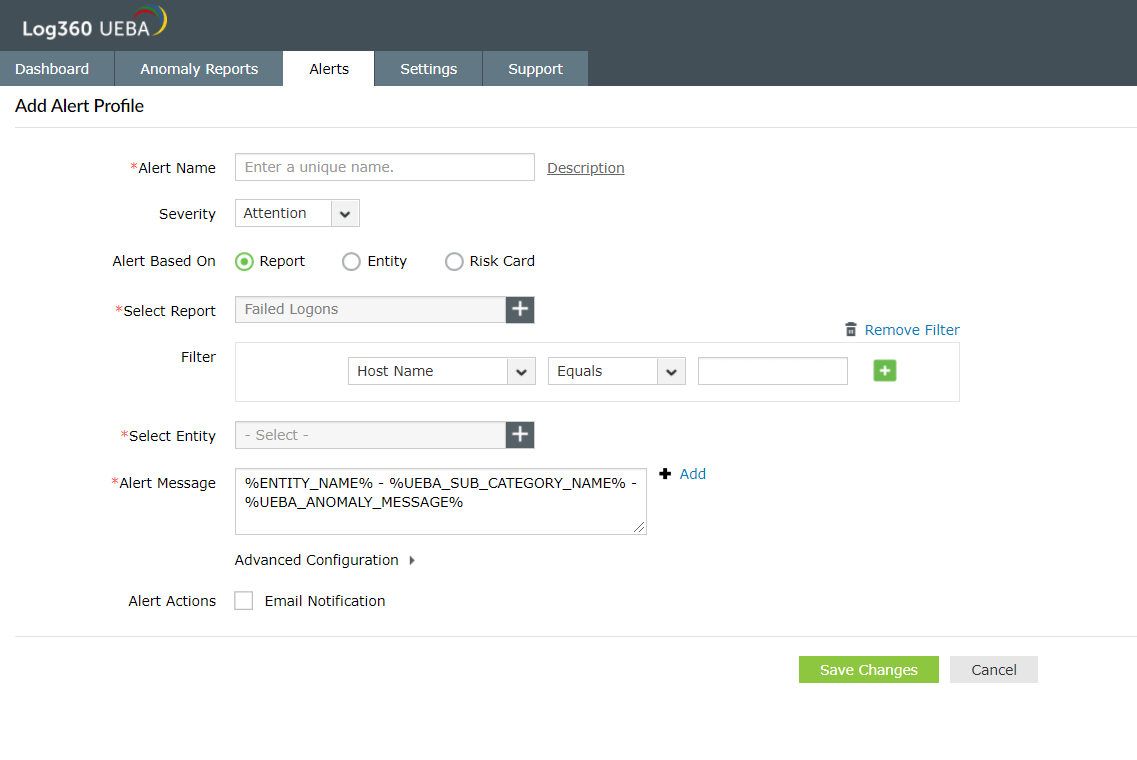
Once a report is selected in the Select Report field, the Add Filter option will appear.
The conditions associated with the report can be granularly refined by selecting the report field and setting the values.
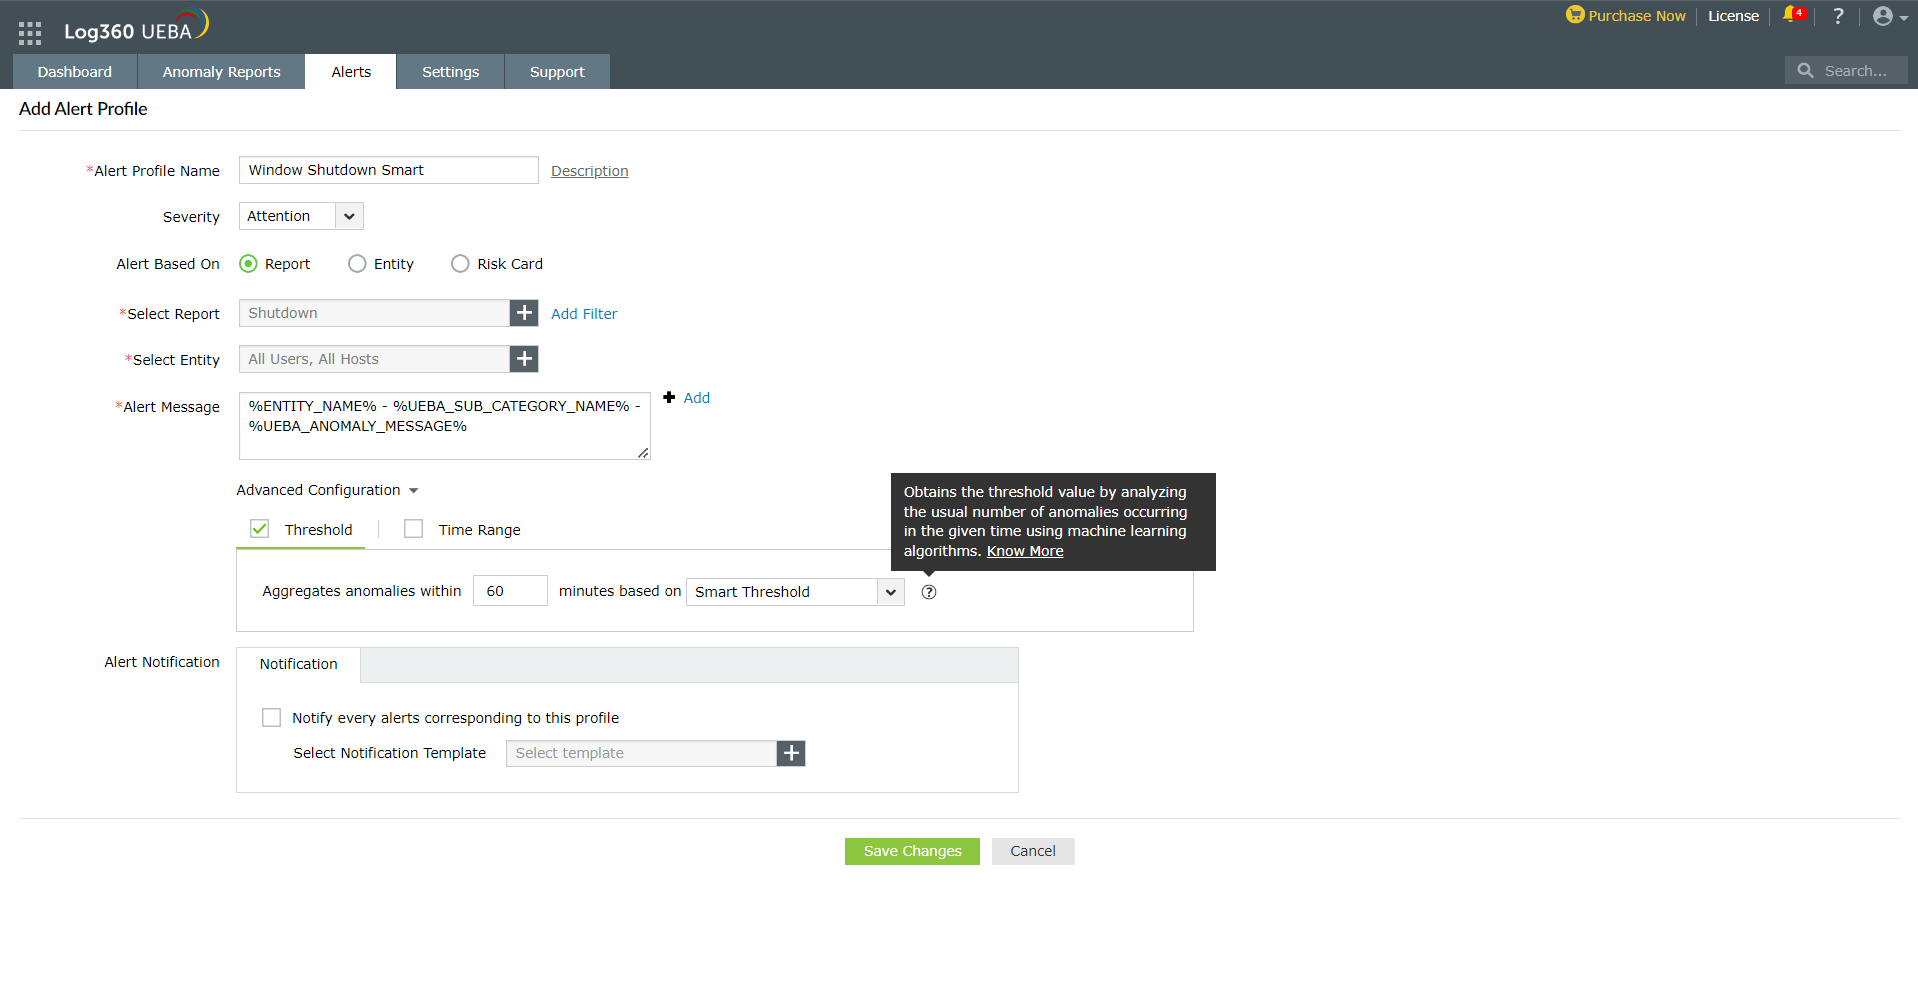
For report and entity-based alerts, there is an option to set the threshold and Time Range. The threshold is the number of anomalies to look for within a given time interval to raise an alert. Users can choose between Manual and Smart Thresholds while configuring alert profiles. Under Time Range, users can choose between Business Hours and Non-Business Hours.
The Smart Threshold feature in Log360 UEBA leverages machine learning capabilities to learn and obtain a threshold value to raise alerts for anomalies. The threshold value is obtained by analyzing the usual number of anomalies occurring in a given time.
Users don't have to rely on entering a value (i.e., the number of anomalies to look for) manually while setting thresholds in alert profiles. Smart thresholds will help reduce the false positives and increase the true positives, as the ML algorithms constantly observe anomaly behavior and update the Threshold value.
You can enable notifications for the alert profile by choosing the notification template you want to use from the available list.
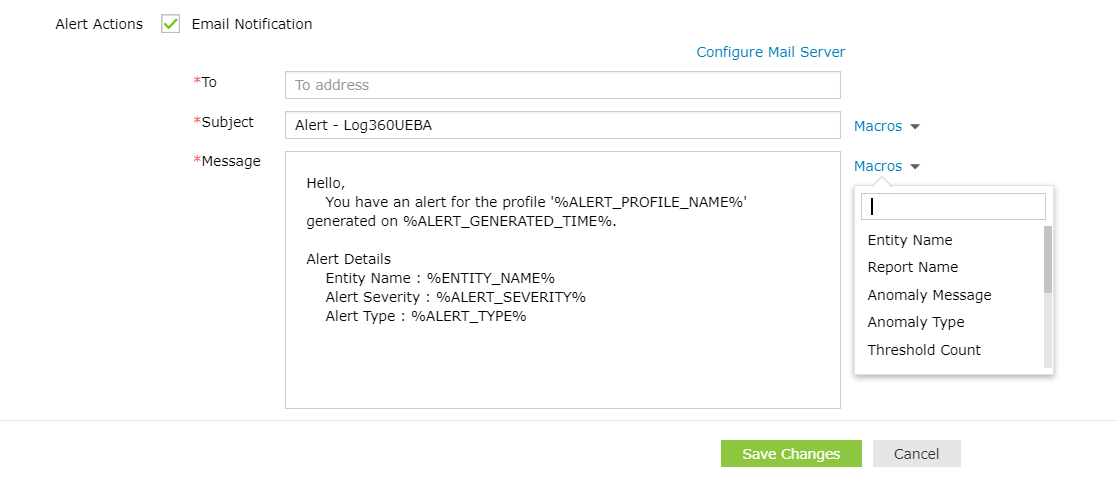
Configuring the mail server: Please refer to the Server settings page.
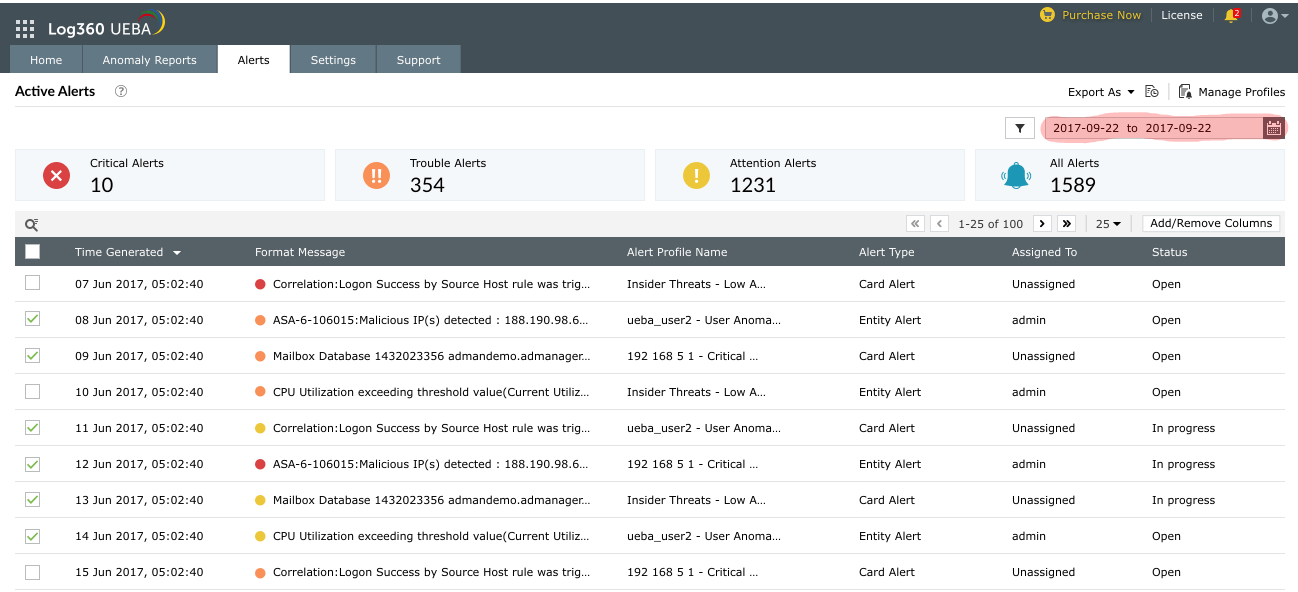
To view alerts in a specific time range, click on the calendar icon on the top right corner of the screen. Once the required range is set, only the alerts raised in that specific period will be displayed.
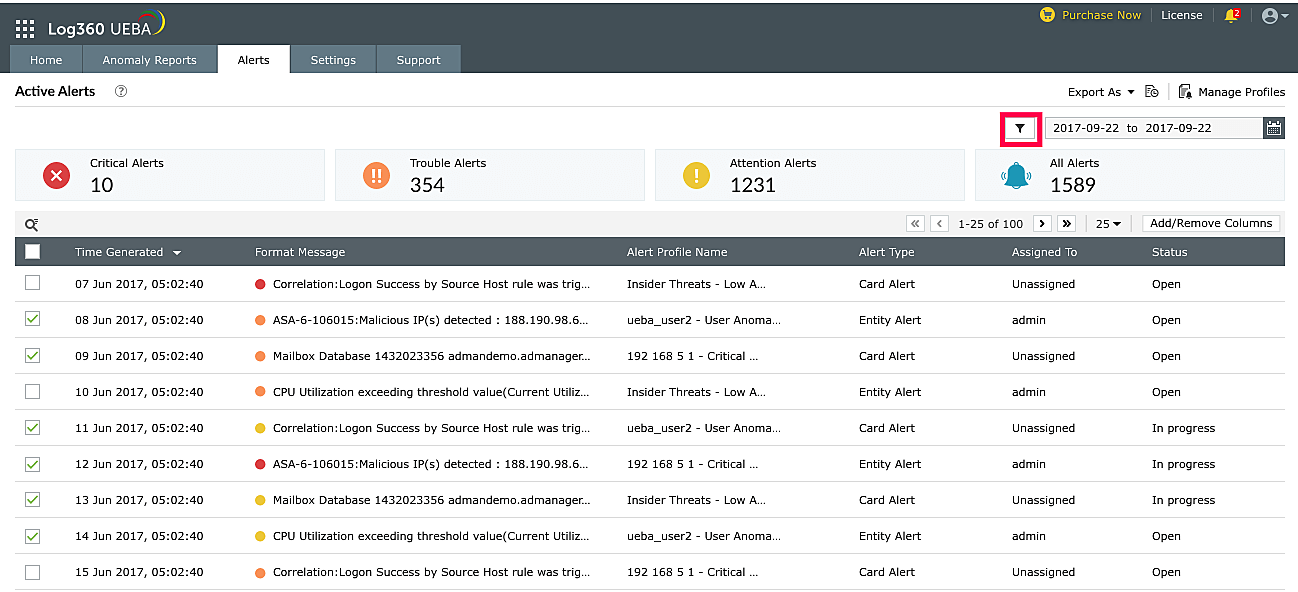
Click on the filter icon on the top right corner of the screen to filter alert profiles based on severity, status, technician, and the profile.
Click on the check boxes to set the necessary conditions for filtering alerts and click on Apply. The alerts that satisfy the conditions set will be displayed.
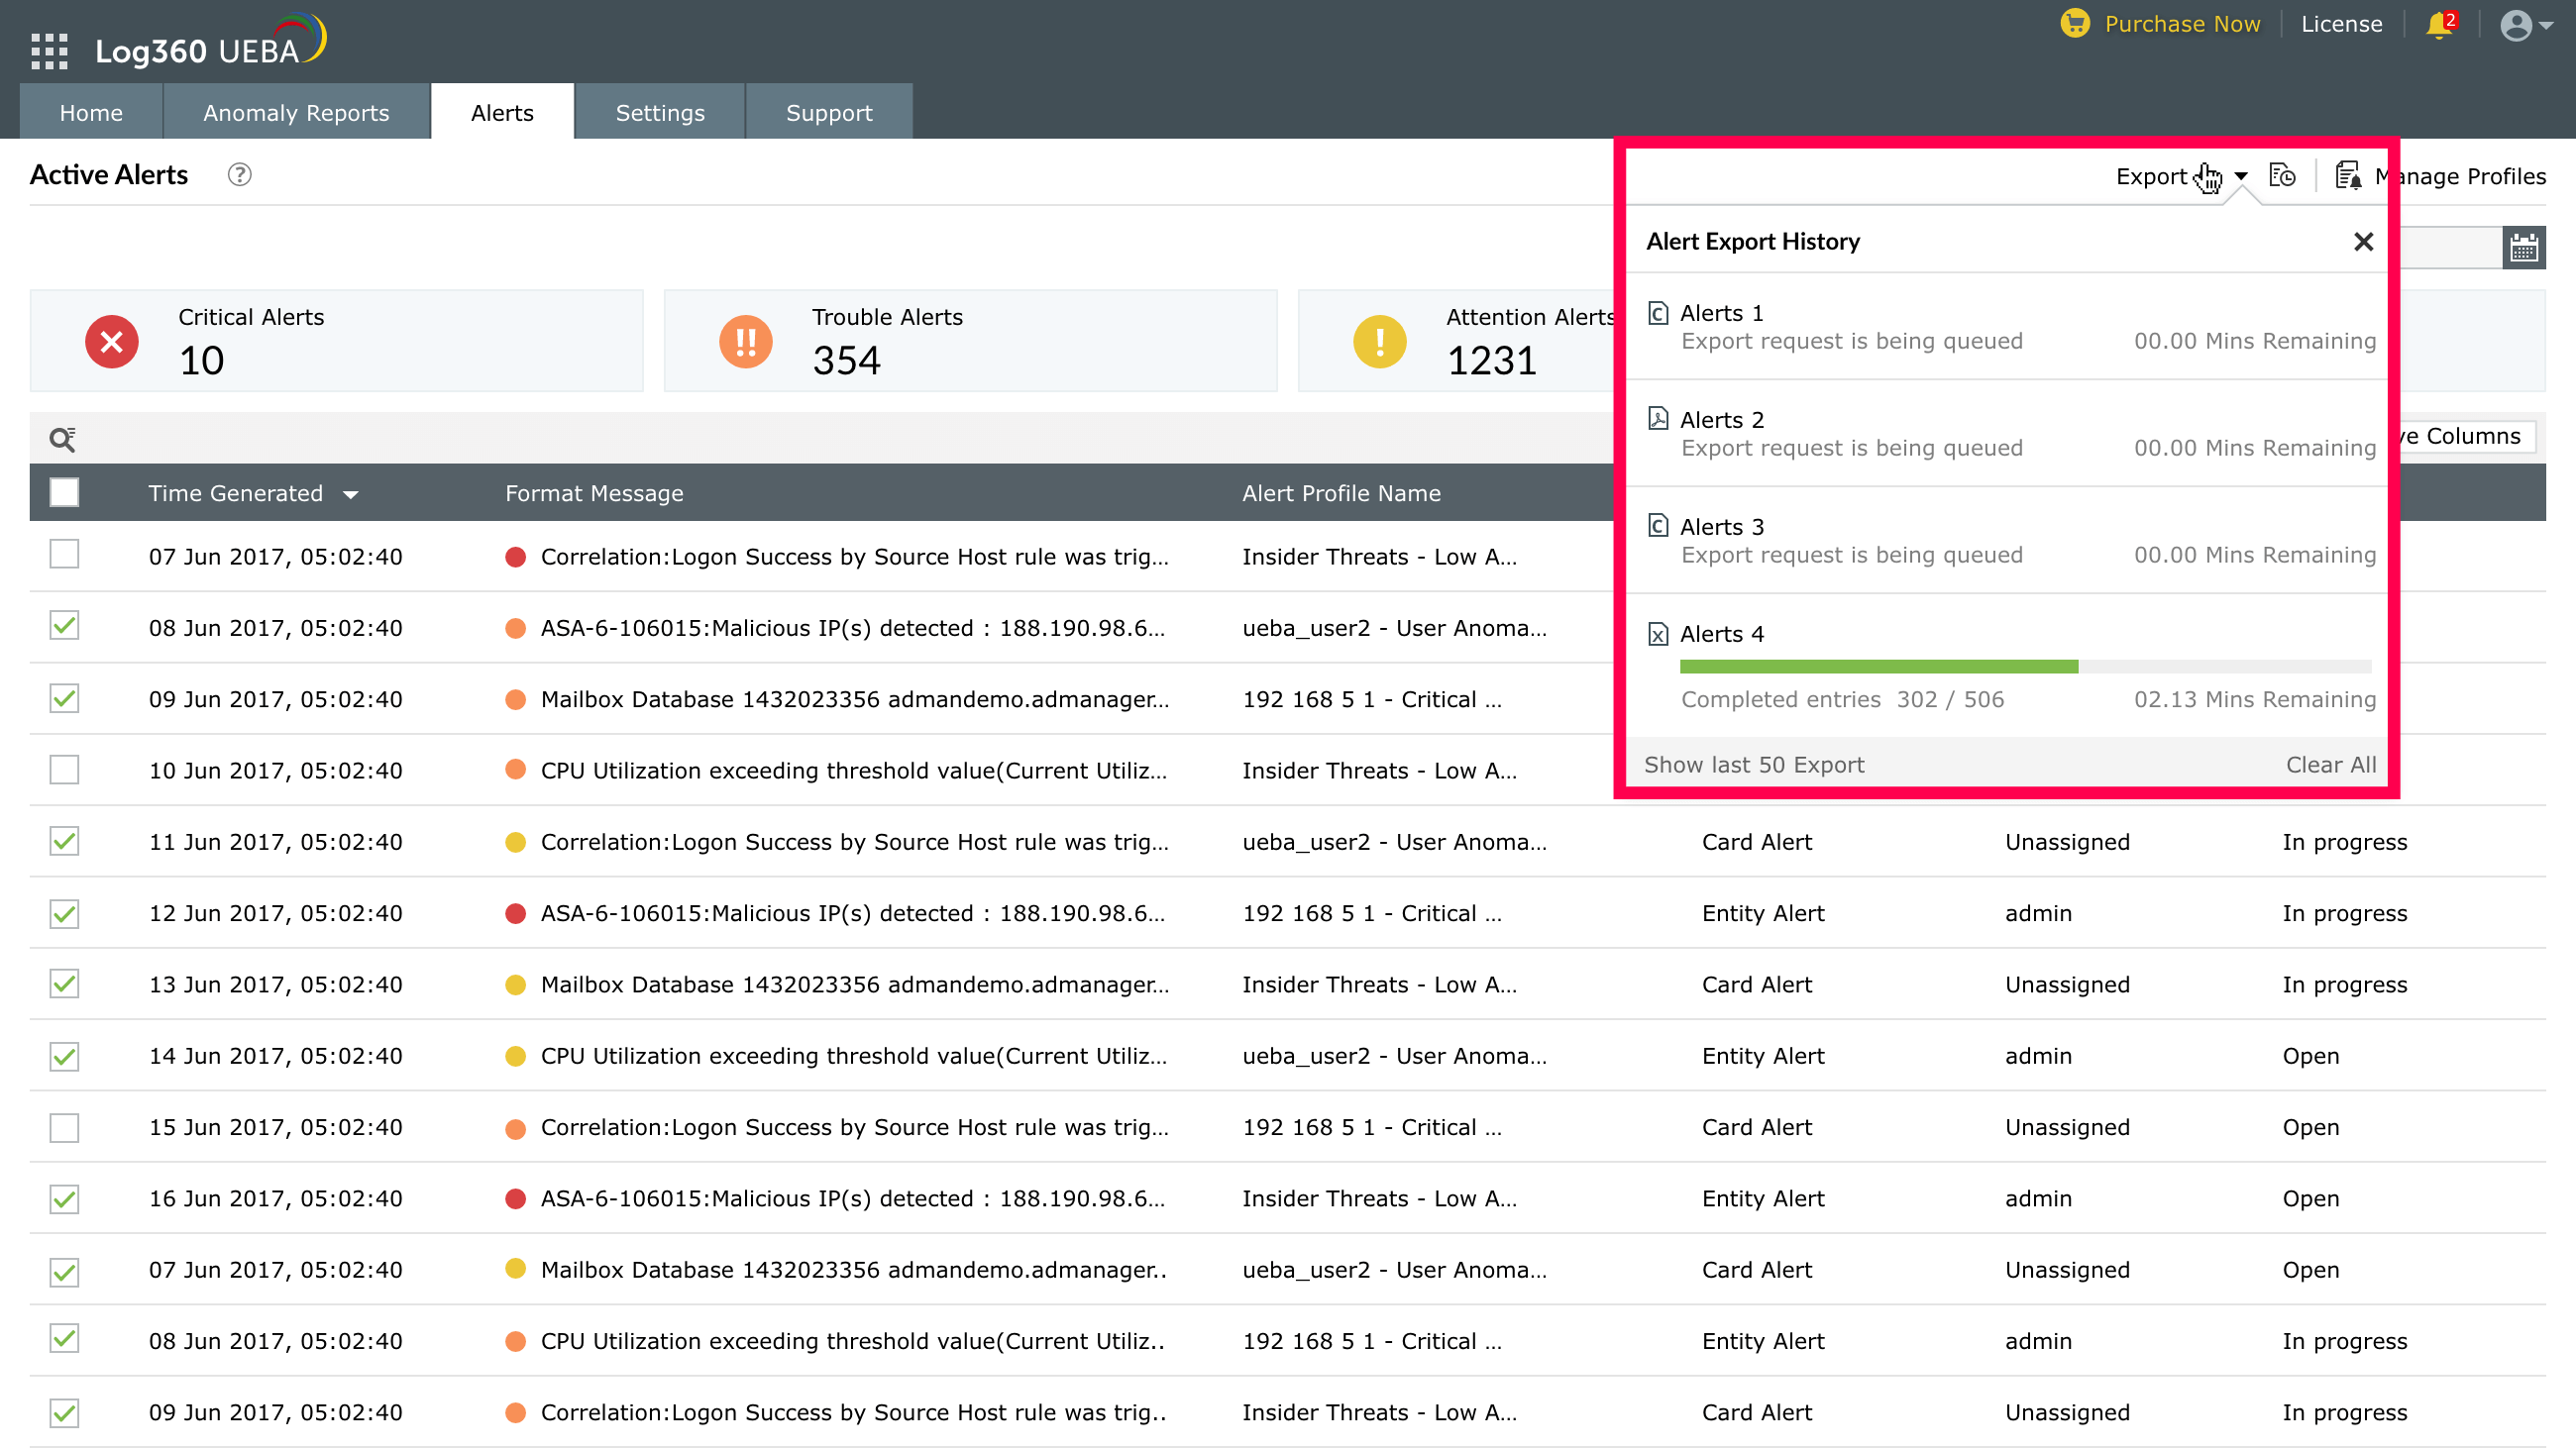
You can export Alerts for a chosen time range in CSV, PDF, XLS and HTML report formats. This will help you submit the reports to management and aid intelligent decision-making.
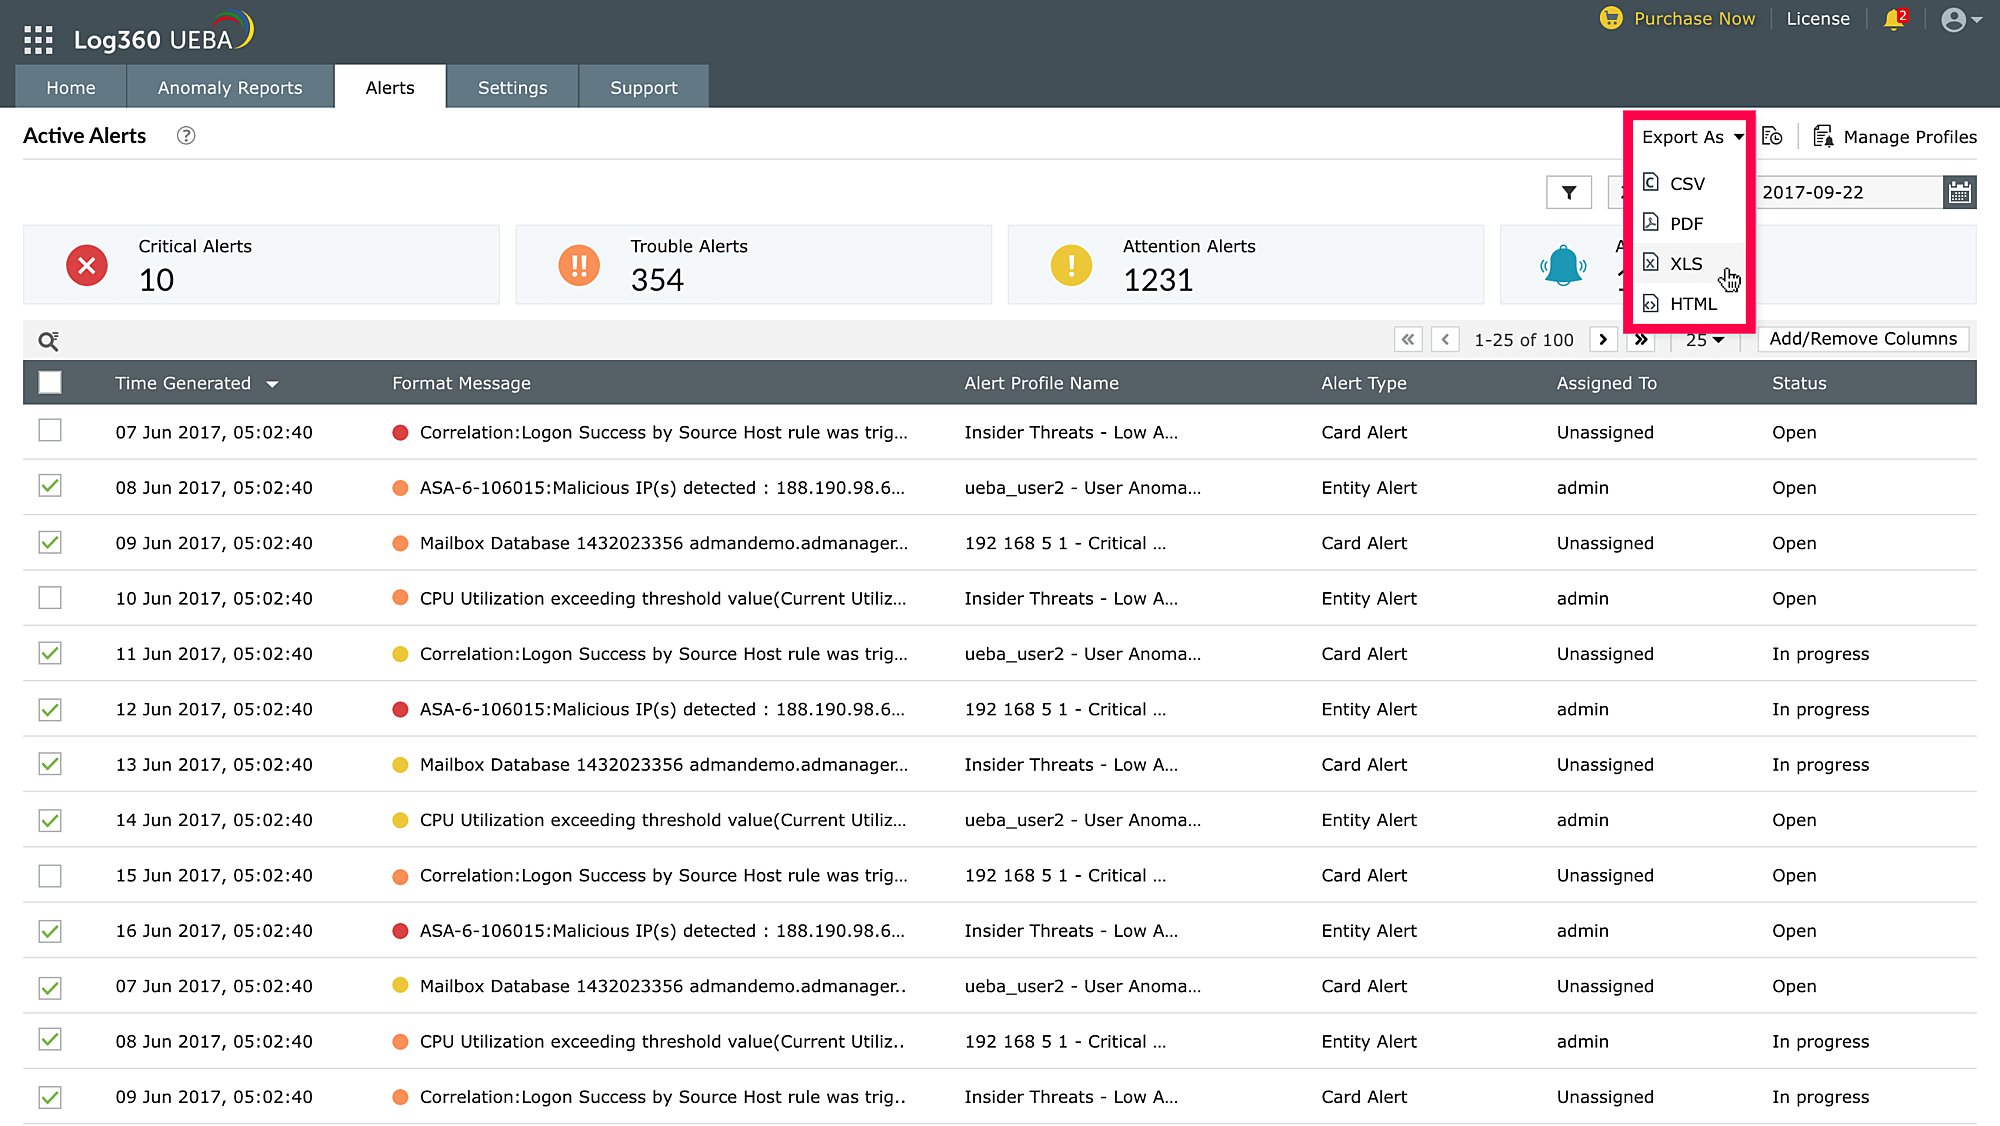
You can also review the history of alert exports.