Report Settings
Scheduling reports
Log360 UEBA users can schedule reports at a time of their choice, at specific intervals. These scheduled reports can be automatically sent over email to stakeholders at desired time intervals. Alternatively, they can be stored at a user-defined storage path.
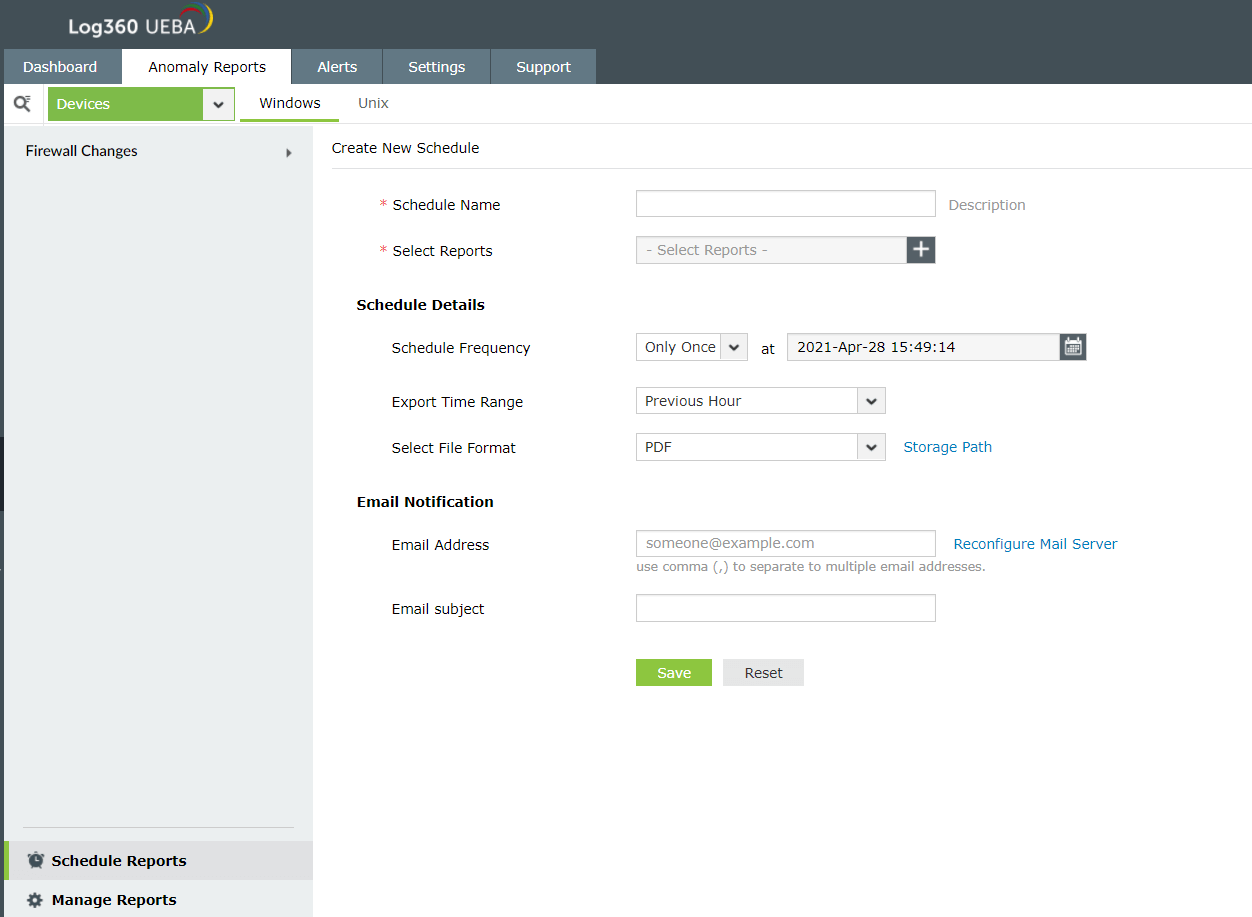 Interface for creating a new scheduled report in Log360 UEBA
Here are the steps to create a new scheduled report:
- Navigate to Anomaly Reports → Schedule Reports. This will bring up a list of the already created scheduled reports.
- To create a new scheduled report, click on Create New Scheduler.
- Enter the Schedule Name and a Description.
- Select the specific reports that you wish to schedule. You can choose multiple reports in the same schedule.
- Under Schedule Details, select how often you wish to receive the report, the time-range the report will cover, and the report format. You can also specify a desired storage path for the scheduled reports.
- Enter the email address to which the report will be sent, and also an email subject.
- Click Save to save the scheduled report.
Managing reports
Log360 UEBA enables you to manage both predefined and custom reports. Predefined reports are reports that are readily available out-of-the-box in the solution. These reports are based on data garnered from specific reports in ADAudit Plus, EventLog Analyzer, and Cloud Security Plus.
On the other hand, custom reports are user-created reports in Log360 UEBA. They can be based on data available readily as reports in ADAudit Plus, EventLog Analyzer and Cloud Security Plus. Or they can be driven through custom reports created in these three components.
Here are the steps to manage reports:
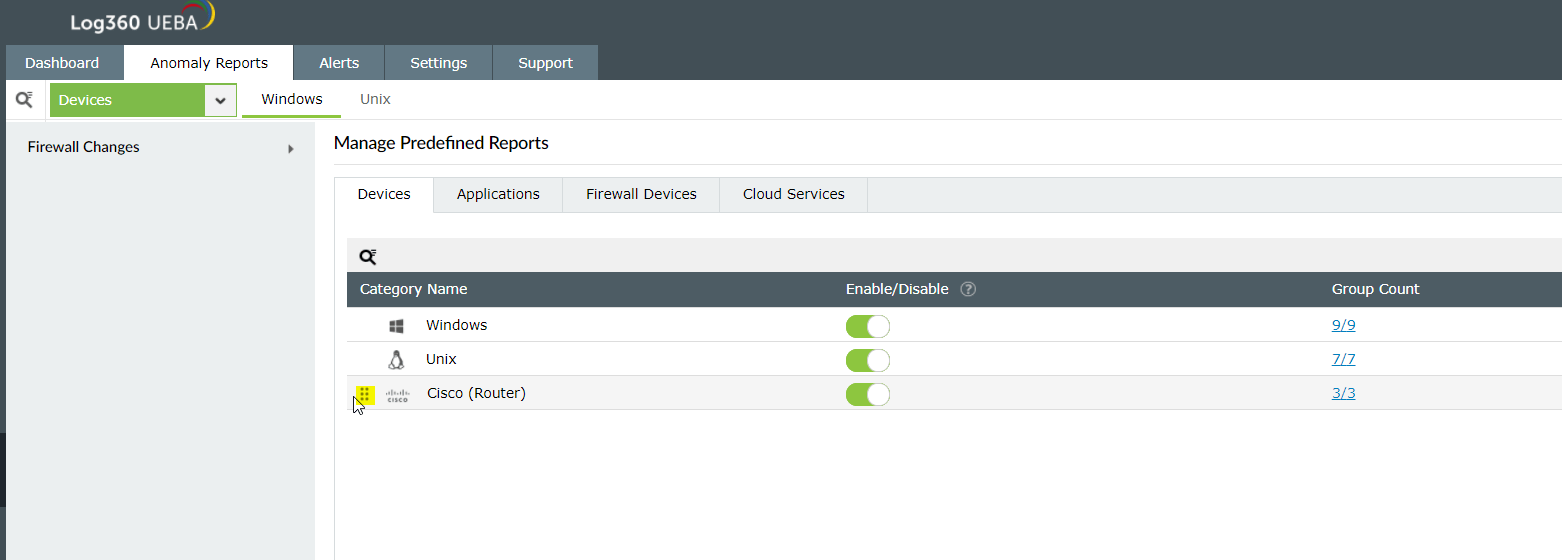
- Navigate to Anomaly Reports → Manage Reports. This brings up a list of predefined reports classified by Devices, Applications, Firewall Devices, Cloud Services, and Custom Reports.
- Select the required Devices, Applications, Firewall Devices, Cloud Services or Custom Reports and you will be able to see the report Category Names based on your selection. You can choose to Show/Hide the category in the user interface and also view the number of reports under each category name under Group Count.

- To drill down to the details of a specific category, click on the Group Count. On doing so, you will be able to see the report Group Names under the selected category. You can choose to Show/Hide the group in the user interface and also view the number of reports under each group name under Report Count.

- To delve deeper into the details of a specific group, click on the Report Count. On doing so, you will be able to see the Report Names under the selected group. Here, you can again choose to Show/Hide the reports in the user interface. Moreover, you will have options to configure Peer Grouping and Real Time Anomaly Detection.
- Peer Grouping option allows you to either Enable/Disable peer group analysis for the selected report. To find out how to configure peer groups, click here.
- Real Time Anomaly Detection option allows you to detect anomalous activities in your network in real time in addition to the existing schedule-based anomaly detection process.
Note: To ensure that particular reports are not considered for anomaly analysis, you will need to navigate to Settings → Configuration → Anomaly Modeling and set Models as Predefined Models. Then, you need to enable or disable the model.
Real time anomaly detection
Real Time Anomaly Detection is an add-on to schedule-based anomaly detection, exclusive for EventLog Analyzer reports. For EventLog Analyzer reports configured under Real Time Anomaly Detection, the events will be pushed from EventLog Analyzer to UEBA in real time to detect anomalies. These anomalies are tracked based on the time, count and pattern of events. A maximum of 25 EventLog Analyzer reports can be configured under this feature.
Note: For a report configured under Real Time Anomaly Detection, schedule-based anomaly detection will not take place.
To configure Real Time Anomaly Detection for a report,
- Click on the drop-down under Real Time Anomaly Detection column.
- Select the required reports and click Apply.
- Real Time Anomaly Detection will be completely Configured, when all the reports under a Report Name are selected.
- Real Time Anomaly Detection will be Partially Configured, when only some of the reports under a Report Name are selected.
- Real Time Anomaly Detection will be displayed as Not Configured, when none of the reports are selected.

You can also view and delete the reports configured under Real Time Anomaly detection by clicking on the Real Time Anomaly Detection option found at the top right corner of the Manage Reports page.

Reordering categories of predefined reports
Categories, groups, and reports can be reordered by clicking on the left end of the bar and dragging to the required position. The change will be reflected in the UI immediately.
 Reordering categories in Log360 UEBA
Here are the steps to manage custom reports:
- Navigate to Anomaly Reports → Manage Reports. This brings up a list of predefined reports classified by Devices, Applications, Firewall Devices and Cloud Services.
- Click on Create Custom Reports. This takes you into Settings → Configuration → Anomaly modeling and Models is preselected as Custom Models. This shows all the custom models that have been built already.
- You can enable/disable, edit or delete any available model under Actions.
- The custom model can be shared with particular technicians as well.
- You can edit the model to enable/disable reporting and risk scoring.
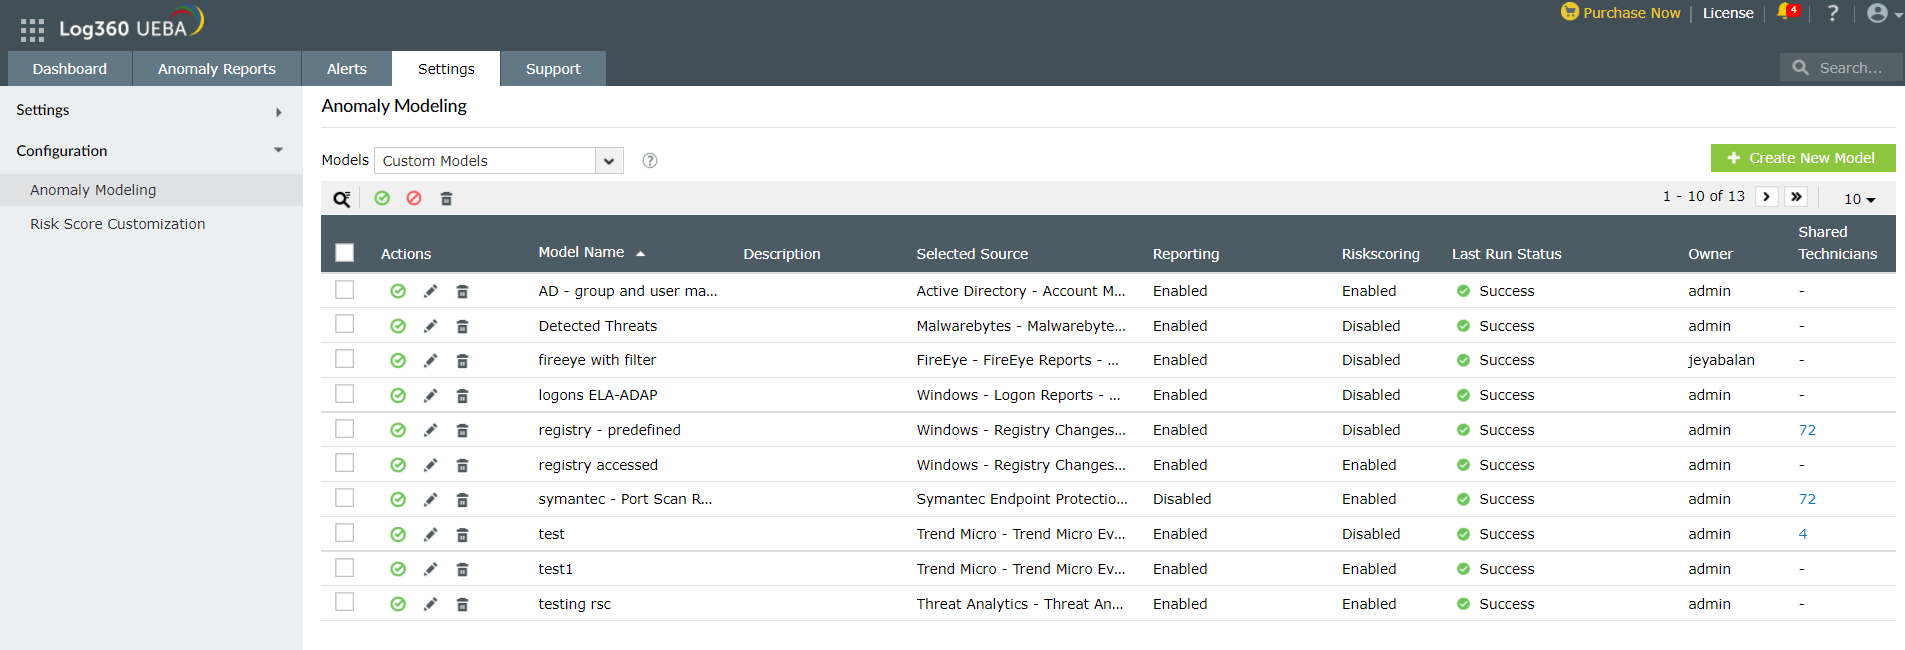 Interface for managing custom models in Log360 UEBA
Creating New Models
- Navigate to Settings → Configuration → Anomaly Modeling.
- Click on Create New Model.
- Enter Model Name and Description.
- Select for the new model. This can be any report from ADAudit Plus, EventLog Analyzer or Cloud Security Plus. You can choose multiple reports from any of the integrated modules.
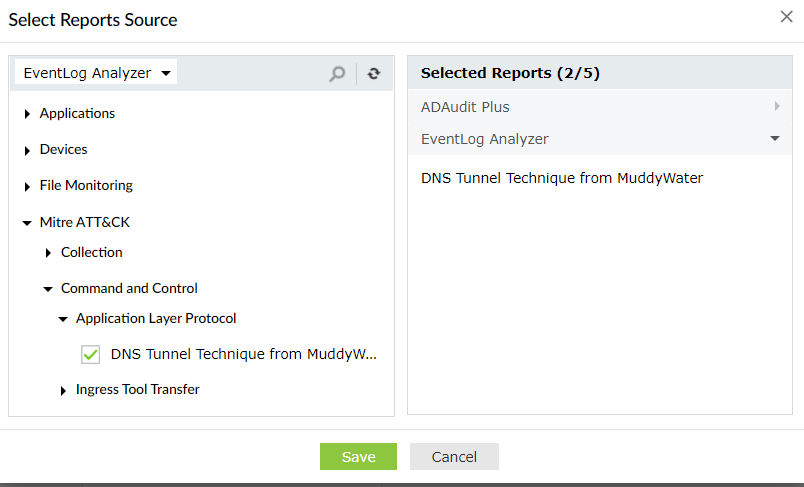 Selecting the report source for a new anomaly model
- If you Enable Filter, you can choose a particular field's value from each selected source for anomaly analysis. This can be used if you are concerned about a specific subset of events.
- Choose the Pivot Fields. This lets you map fields available in the selected reports to fields that will be shown in Log360 UEBA. This step is critical for building reports in Log360 UEBA.
- Time - This is a mandatory pivot field and the user needs to map the correct column that contains information about time in the selected reports from ADAudit Plus, EventLog Analyzer or Cloud Security Plus components.
- There are two entity fields: User Name and Host name. You need to map at least one of these with the selected reports for analyzing time, count and plain anomalies. For pattern anomalies, it is not necessary to map a user name or host name. Choose the field in the selected report that contains information about the user name or host name.
Note: A plain anomaly does not arise from the use of any ML-powered algorithms. It is simply a threat that is observed in the selected reports.
- Choose Other Fields that you want in the anomaly report. You have to choose at least one field, but a maximum of 5 fields. The mapping needs to be done in the same manner.
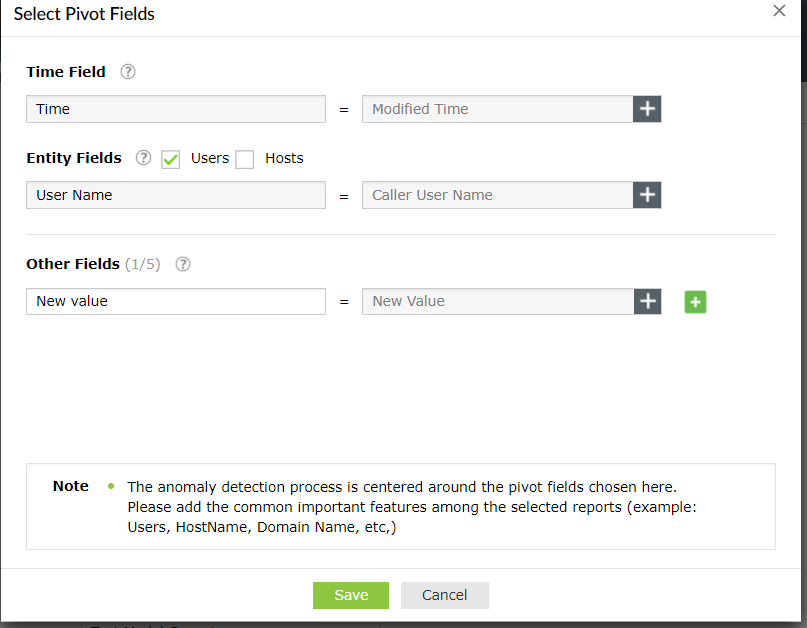
Mapping Pivot Fields in Log360 UEBA to attributes in selected reports
- Choose the Anomaly Parameters. Based on the chosen pivot fields, you will be able to choose different Anomaly Report Views or Anomaly Basis such as Time, Count, Pattern and Plain. You can also add multiple views by going into Add View.
- Note that the Plain anomaly basis only detects threats identified in the selected reports. No ML-powered anomaly detection is performed if it is chosen.
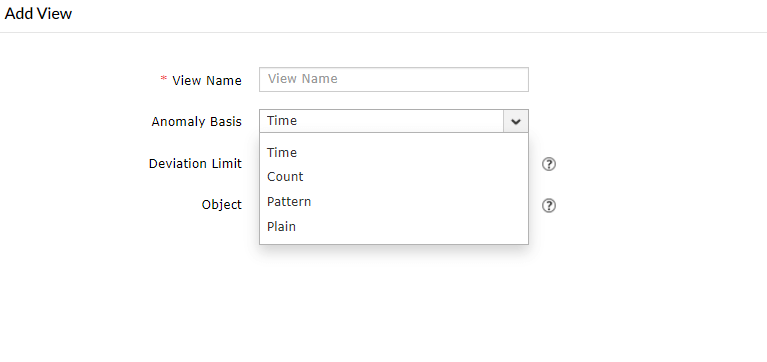 Adding new Anomaly Report Views within an anomaly model
- Enable Reporting if you wish to bucket all anomalies under a user-defined Report Name and Custom Group.
- Enter a Report Name.
- Choose the Custom Group where you want this report to be a part of. Alternatively, you can create a new custom group.
- Enable Risk Scoring if you wish to view the results of the statistical modeling of threats in the dashboard under the threat group selected.
- Once risk scoring is enabled, you will need to give details about views you have selected under Model Type.
- Enter the Card Name.
- Enter the Location(s) where the card details can be found. This can be within Overall Anomalies, Insider Threats, Data Exfiltration, Compromised Accounts and Logon Anomalies.
- You can also configure the weight and the time decay factor for each view to be included during risk score calculation.
- Hit Save to save your new custom model.
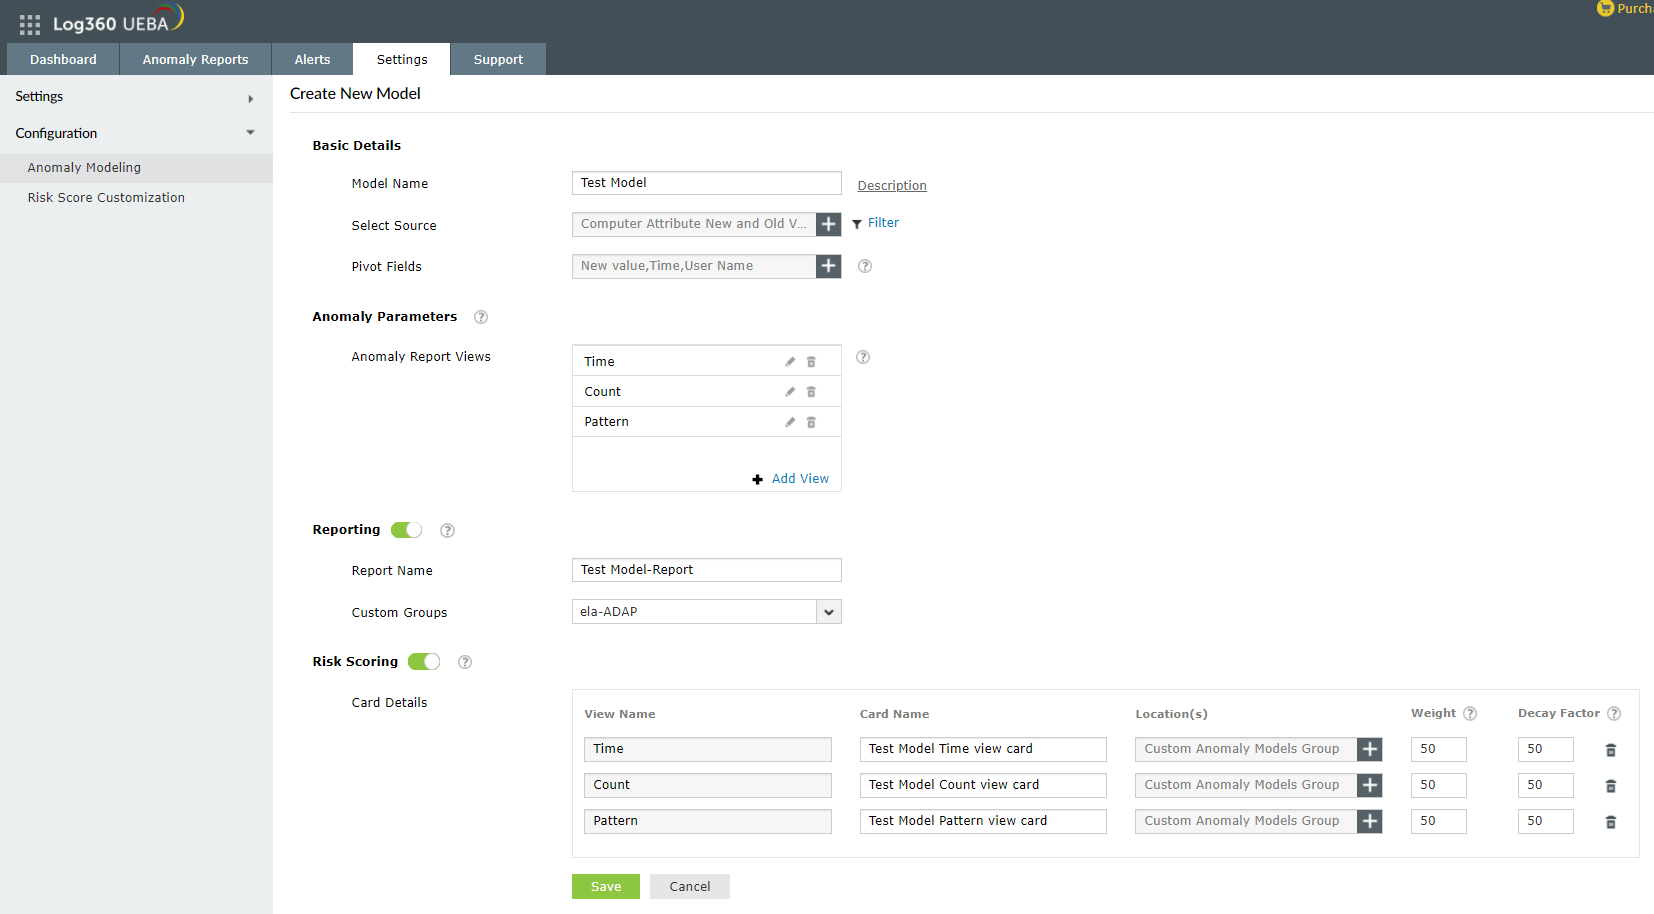 Interface for creating a new custom model