Summary
When a failing app sets off a server alert storm, OpManager Nexus' causal AI works out which alert started the chain instead of treating all of them as equally urgent. It reads how your monitors connect, groups the related CPU, memory, and node alerts into one problem, and names the probable root cause at the top—often with the logs that explain it. So instead of checking servers one by one, your team starts at the likely cause and brings mean time to repair (MTTR) down from hours to minutes.
When something goes wrong on your servers in production, it's hard to tell what actually caused it. The alerts don't show up in one tidy place. One server flags high CPU, then disk writes and reads spike, and then more warnings pile on about memory paging and I/O. Your monitoring screen fills with multiple alerts from that one server, all at once. And because every alert looks equally urgent, your team has no clear idea which one to chase first.
The trouble isn't that you're missing information. It's that you can't tell which alert set off all the rest. This is where alert fatigue becomes a real problem: too many alerts, no clear order, and nowhere obvious to begin. Your team can burn an hour chasing a metric that was never the cause.
A quick refresher on causal AI
This is the third article in our causal AI series, so here's the short version. Causal AI is a kind of AI-powered root cause analysis (RCA) that tells you why something happened, not just that it happened. It follows a trail of related alerts back to the one event that set them off. And it shows direction. Not just that the disk and CPU alerts happened at the same time, but that a surge in disk writes set them off.
If you want the full picture, the first two articles cover the basics in depth:
- How causal AI traces application latency caused by database bottlenecks
- How causal AI finds the root cause behind a Kubernetes incident
- Debugging the wrong network device? Here's how causal AI finds the real cause
This one picks up where they left off, with a different pattern: What happens when a disk write surge drives a server's CPU past its limit and sets off a storm of alerts, and why the loudest alert is almost never the real cause.
Use case: A disk write surge sets off a CPU alert on the same server
A CPU usage alert looks like a CPU problem. The server is working too hard, so you open it and start hunting for the process eating the cores. But the CPU is rarely where the trouble starts. It's reacting to something else happening in the same box.
Here's how that plays out. A team runs a database server under a heavy read and write load. During a busy stretch, disk writes on the server surge well past their normal level. Reads, I/O, and memory paging climb right alongside, and all that disk work drives the CPU up until it crosses its usage threshold. Within a minute or two, the screen fills with disk, memory, and CPU alerts from the one server.
The problem gets its name from the loudest alert. In this case, that's Trouble - CPU usage. So that's where everyone looks. But the CPU is just carrying the weight. The disk write surge behind it fired at almost the same moment, and it's the thing that set the storm off.
What OpManager Nexus sees across the cluster
These alerts all come from the same server, captured within a couple of minutes of each other.
| Time | Event | Classification |
|---|---|---|
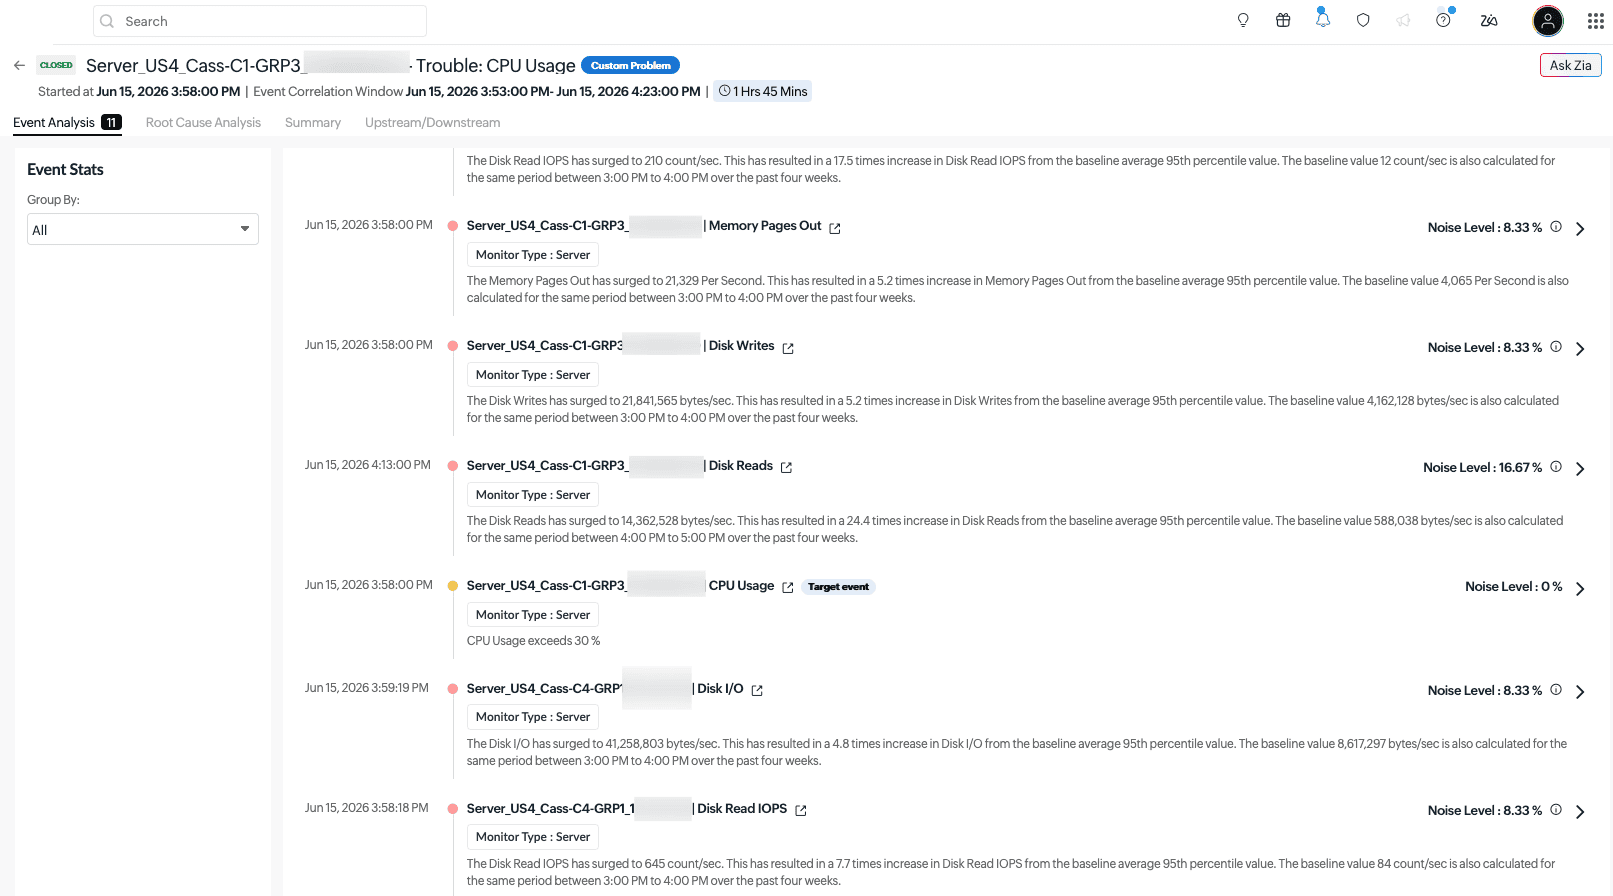
| 3:58:00 PM | CPU Usage exceeds 30% | Target event |
| 3:58:18 PM | Disk Read IOPS surge to 645 count/sec, 7.7 times the usual 84 | Correlated event |
| 3:59:19 PM | Disk I/O surges to 41,258,803 bytes/sec, 4.8 times the usual 8,617,297 | Correlated event |
| 3:59:19 PM | Disk Reads surge to 7,546,129 bytes/sec, 6.1 times the usual 1,246,814 | Correlated event |
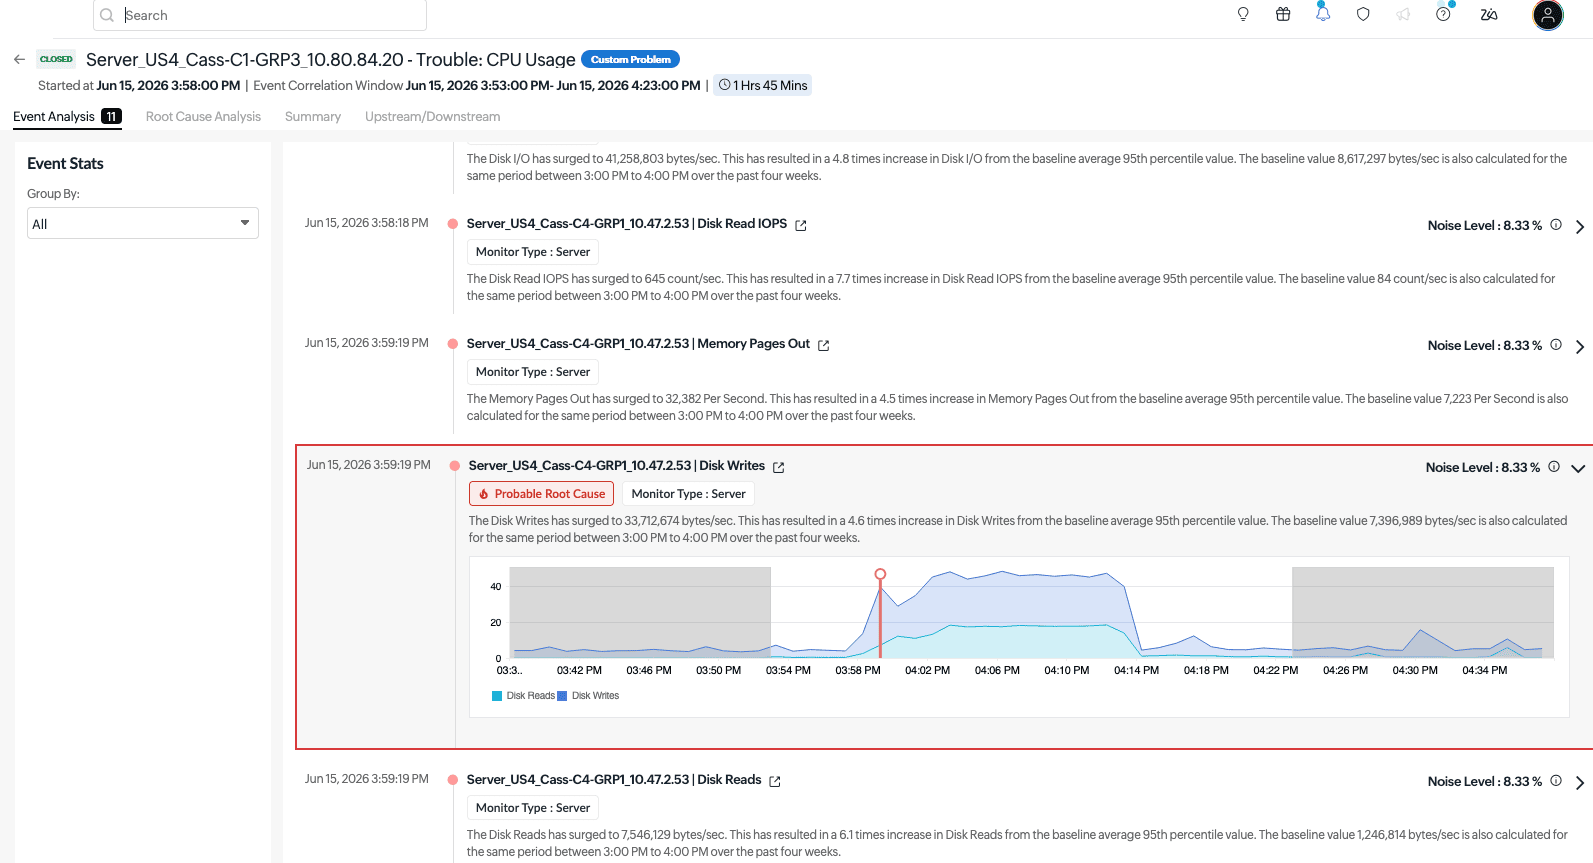
| 3:59:19 PM | Memory Pages Out surge to 32,382 per second, 4.5 times the usual 7,223 | Correlated event |
| 3:59:19 PM | Disk Writes surge to 33,712,674 bytes/sec, 4.6 times the usual 7,396,989 | Probable root cause |
What causal AI figures out on its own
This is where the storm stops being a storm. OpManager Nexus reads how the metrics on the server relate, so it treats the CPU, disk, and memory alerts as parts of one event instead of a handful of separate triggers. It pulls all 11 events into a single problem and ties the CPU spike to the disk activity underneath it.
Also, it doesn't judge any of this against a flat number. In case of an anomaly event, each surge is measured against the server's own normal baseline for the same hour, built from data from the past four weeks. So a spike is a spike compared to real history, not a threshold someone guessed at a year ago.
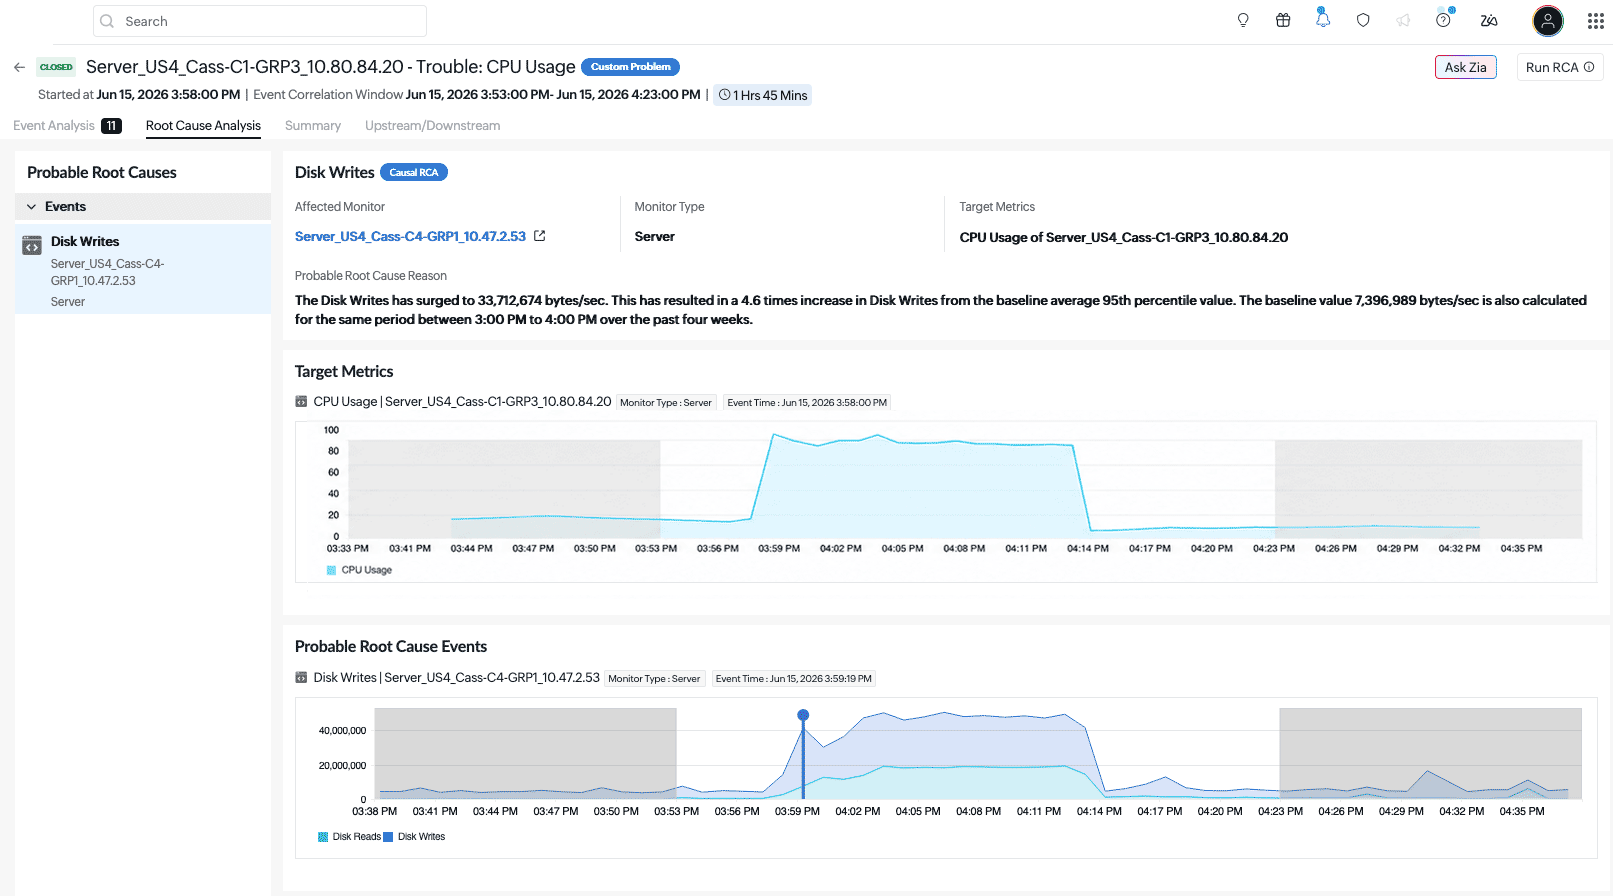
Open the Root Cause Analysis tab and the answer is waiting. Causal AI names one probable root cause with a plain reason: a Disk Writes surge that hit 4.6 times the server's normal level. The CPU usage alert that named the whole problem sits underneath it as the symptom. With OpManager Nexus' casual AI, your team sees the likely cause first, before anyone has touched the server.
Outcome
The team opens the problem and goes straight to the Root Cause Analysis tab. The disk write surge sits at the top, with a plain reason and the metric behind it. Nobody has to dig through the server's CPU by hand. The team traces the surge back to the heavy write job, eases the load, and the CPU settles on its own.
Impact
Without causal AI, your team works backward from a screen full of disk, CPU, and memory alerts, digging through the server's metrics by hand. A quick fix can turn into a long hunt, because the alert that names the problem shows the symptom, it doesn't show the cause. With causal AI, the probable cause is already sitting at the top of the problem when your team opens it. The same fix takes minutes, which brings your mean time to repair (MTTR) down from hours to minutes.
How OpManager Nexus works through the problem
Getting from a pile of raw alerts to a solved problem happens in four steps.
Stage 1: Group your monitors by how they actually connect
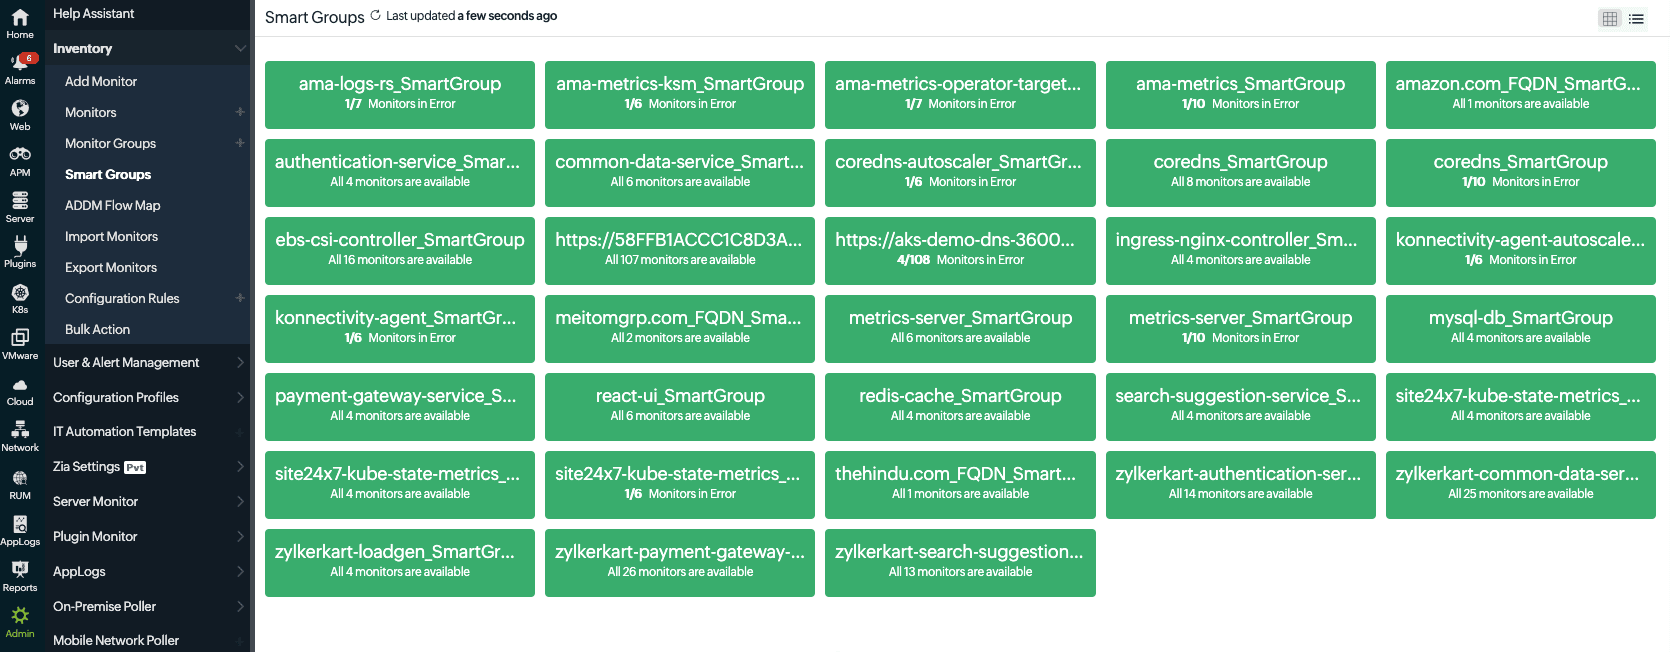
OpManager Nexus uses Smart Groups to organize monitors by their real relationships: which servers belong to the same cluster, what your application discovery and dependency mapping (ADDM) data shows, how the network links things, and which workloads run on which servers and nodes. This is what lets it judge all of the alerts together instead of one at a time.
Stage 2: Connect the alerts inside a time window
Within the correlation window, every alert from the monitors in that Smart Group is looked at together. OpManager Nexus uses what it knows about your setup to link them—like tying a disk write surge to the CPU spike it drove on the same server—while leaving out anything unrelated. By default, OpManager Nexus looks at alerts that are triggered within 10 minutes of each other. You can change that window anytime under Admin > Inventory > Smart Groups > your group > Edit > Correlation time window.
Stage 3: Show it all as one problem
The connected alerts become a single problem. To find it, go to Alarms and switch to Problems. Each problem shows its Priority, Status, Smart Group, Start Time, Duration, and the assigned Technician. Open it and you get four tabs: Event Analysis, Root Cause Analysis, Summary, and Upstream/Downstream. Assigning a technician marks it as acknowledged.
Stage 4: Read the root cause
The Root Cause Analysis tab lists the likely causes in order, each with the affected monitor, its type, and a plain reason. For this problem, it names the disk write surge as the probable cause, with the affected monitor and the metric behind it.
Getting started with causal AI
Setting this up for your server takes two steps. Event correlation is already on once your monitors are running and reporting. There's nothing to switch on.
Step 1: Set up server and workload monitoring
Install the Full-Stack Agent on your servers. It starts reporting CPU, memory, disk, and I/O metrics automatically.
Step 2: Look into incidents
Use the Problems view to dig into the grouped alerts and find the cause fast.
Fix server alert storms faster with causal AI
A spike in disk activity rarely shows up alone. It drags CPU, memory, and I/O up with it and kicks off an alert storm that hides the real issue. This is exactly what OpManager Nexus' causal AI is built for. It cuts through the noise, links the right alerts, and names the likely cause—often with the exact metric that explains it right there. Your team starts in the right place, with the proof it needs. Causal AI finds the cause. Your team makes the fix.
FAQ
1. Can causal AI reduce mean time to repair (MTTR)?
Yes. Causal AI cuts mean time to repair (MTTR) by pointing your team at the probable cause right away, instead of having them rule out servers by hand. When the probable root cause is waiting at the top of the problem, a fix that used to take hours can take minutes.
2. How is causal AI different from regular server monitoring?
Regular monitoring tells you that the CPU or disk crossed a threshold. Causal AI goes further and tells you why. It connects the related alerts, works out which one caused the others, and names the probable root cause, so you are not left guessing which alert to chase first.
3. What's the difference between event correlation and root cause analysis?
Event correlation is when several alerts are triggered at once on things that depend on each other, and OpManager Nexus groups them into one problem so you're not buried in separate alerts. Root cause analysis (RCA) then points out which event in that problem started it. Put simply, correlation tells you what's happening, and RCA tells you why it started and where.
4. Does causal AI work across multiple servers?
Yes. OpManager Nexus connects alerts across every server in the same Smart Group. A disk or memory surge on one server can be named as the cause behind alerts on the others, so a cluster-wide storm still resolves to one problem with one set of probable causes.
5. How do I find the root cause of a high CPU alert?
Start in the Problems view rather than opening the server and hunting for a process. OpManager Nexus' causal AI will group the related CPU, disk, and memory alerts into one problem and name the probable root cause at the top, so you can see whether the CPU is the cause or a symptom of heavy disk activity on the same server. The Root Cause Analysis tab shows the exact metric behind it.
6. Why do all my server alerts fire at once?
One overloaded server rarely triggers just one alert. A disk write surge pushes CPU, I/O, and memory up on the same box, and each metric trips its own alert. Causal AI ties those alerts back to the one event that set them off, so you see the cause instead of the fallout.
7. Do I need to configure anything to turn on event correlation?
Event correlation runs automatically once your monitors are installed and begin reporting events, so there's nothing to enable. OpManager Nexus builds the Smart Groups and starts correlating alerts on its own, using how your monitors connect to judge which alerts belong to the same problem.