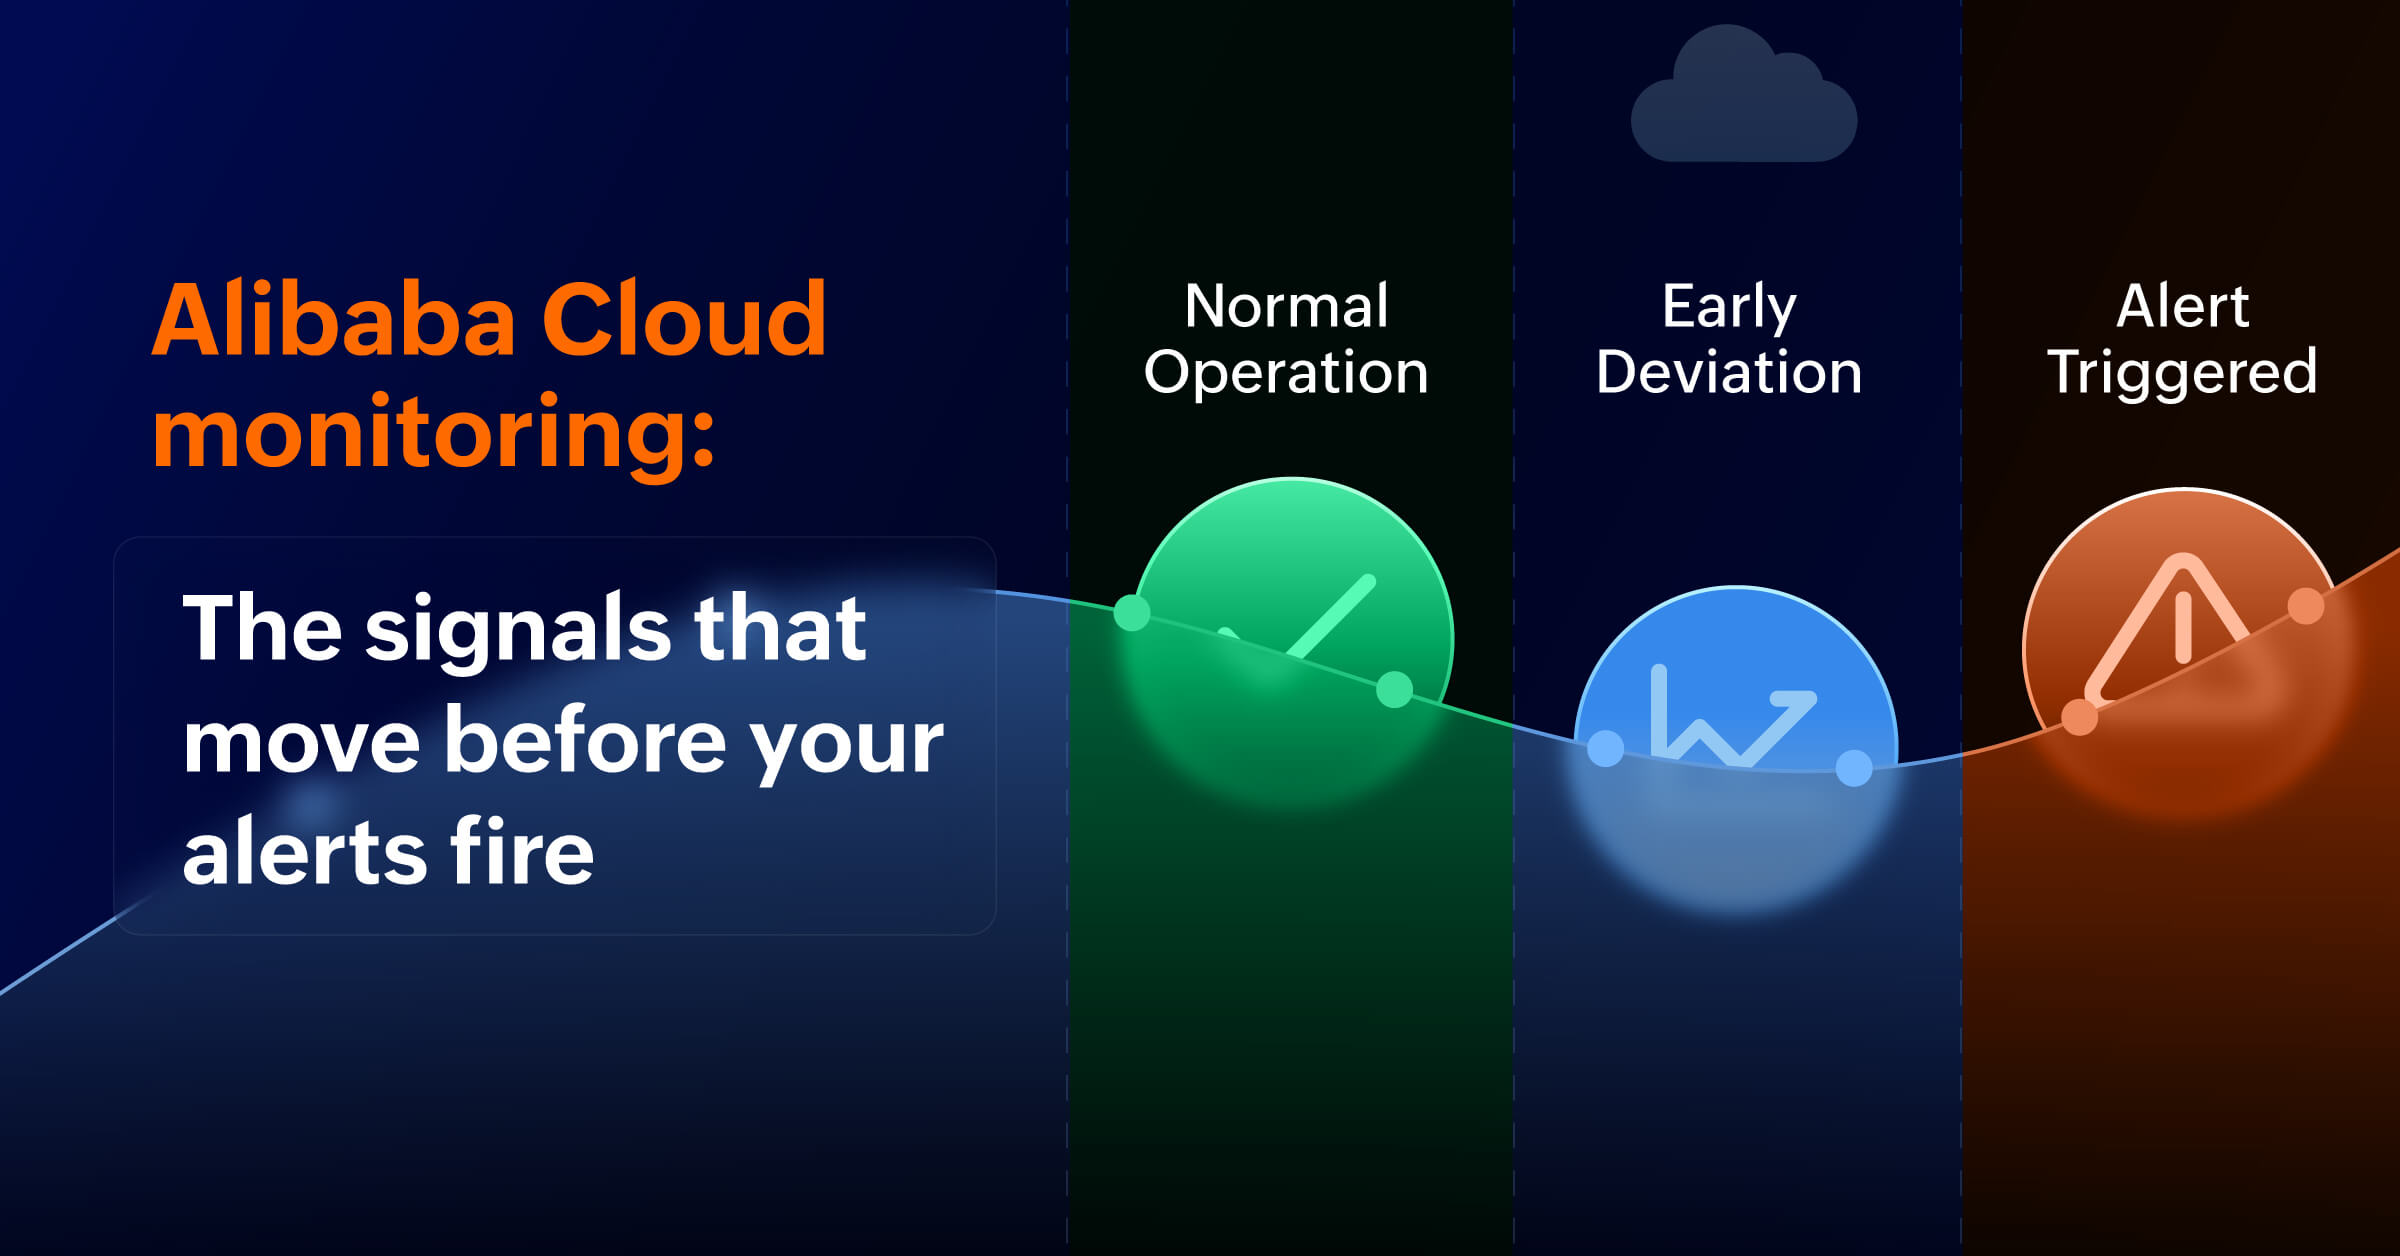
Alibaba Cloud monitoring: What changes when scale, speed, and cost collide
Alibaba Cloud monitoring isn't AWS or Azure monitoring with a different logo. The way its services scale, absorb load, and send early warning signals follows its own logic and if you're watching the wrong things, you'll find out too late.
Cloud monitoring conversations often follow patterns set by AWS and Azure. The metrics are familiar, dashboards look the same, and operational playbooks are built around expected infrastructure behavior. Alibaba Cloud sits slightly outside that pattern, not because it behaves erratically but because it’s optimized with a different set of goals in mind.
Alibaba Cloud environments are built for large-scale transactions, strong regional distribution, and cost-conscious operations, and they respond to load in ways that can feel unfamiliar if you're applying the usual assumptions. Alibaba Cloud monitoring is not just about adding more data points. It's about understanding which signals change first as the system begins to drift and which ones can quietly mislead if you interpret them the usual way.
Why Alibaba Cloud needs its own monitoring and observability lens
Treating Alibaba Cloud like a clone of AWS or Azure produces blind spots that compound over time. Its services, quotas, and scaling patterns reflect a distinct architectural philosophy: high-density workloads built for sharp traffic spikes, strong regional isolation models that affect how failures propagate, managed services that abstract infrastructure complexity but still fail in very specific ways, and cost optimization strategies that shape how resources are provisioned and reclaimed.
Alerts fire late because thresholds are calibrated for different scaling behavior. Capacity signals mislead because resource reclamation patterns aren't accounted for. Troubleshooting becomes reactive because the monitoring model doesn't reflect how Alibaba Cloud services actually interact under pressure.
Effective monitoring in these environments starts with behavioral awareness: understanding how Alibaba Cloud services behave under load before defining what to watch and when to act.
This is where a platform like OpManager Nexus becomes useful: not just for collecting Alibaba Cloud metrics but for modeling how those services behave under load so your alerts and dashboards reflect reality, not assumptions.
Reading Alibaba Cloud signals before they become incidents
Alibaba Cloud environments rarely fail in isolation. Issues span compute, networking, databases, storage, and managed platform services simultaneously—and the challenge is rarely a lack of data. The challenge is understanding how signals from multiple services converge during an incident, and which signal moved first.
In practice, early warning signs in Alibaba Cloud environments tend to surface in a few consistent patterns:
Elastic Compute Service (ECS) compute pressure: Memory pressure, disk I/O queue depth, and network interrupt rates often move before CPU. In high-density workloads with sharp traffic spikes, a monitoring model that treats CPU as the primary ECS health signal will consistently lag behind what the infrastructure is actually experiencing. Pay attention to metrics such as memory utilization, disk I/O queue length, and network interrupt and error rates.
ApsaraDB RDS coupling: Increased query latency is frequently a downstream effect of connection pool exhaustion at the application or ECS layer, not a primary database failure. Before scaling ApsaraDB RDS instances in response to latency, first validate application connection pool behavior and ECS resource pressure. Scaling the database to mask upstream connection exhaustion adds cost without eliminating the root cause.
Server load balancer (SLB) load distribution: Back-end health check behavior, response time distribution across back-end nodes, and connection persistence settings interact in ways that affect how load is distributed across ECS instances. A common hidden issue in Alibaba Cloud setups is uneven load distribution: Some ECS instances end up doing more work than others, but looking only at aggregate SLB metrics, everything may appear balanced. That can be a complete mirage—the imbalance hides in plain sight and shows up only as inconsistent performance across instances.
Virtual private cloud (VPC) network behavior: Bandwidth saturation, packet loss, and routing asymmetry at the VPC layer affect every service running inside it. VPC issues often surface as intermittent timeouts, inconsistent latency between seemingly identical ECS instances, or unexplained SLB behavior. Yet because VPC issues don't produce obvious service-level alerts, they're consistently underweighed in monitoring configurations until a major incident forces attention to the network layer.
Monitoring at scale without losing control
Alibaba Cloud is often chosen specifically for its ability to run large-scale workloads cost-efficiently. But as environments grow, operational complexity grows faster than resource usage. The number of services to track increases. The dependencies between them multiply. The cost of a missed signal grows.
At scale, monitoring becomes less about tracking individual metrics and more about understanding service relationships. Which services are contributing most to performance risk right now? Where are cascading failures likely to originate given current load patterns? How does degradation in one managed service propagate to downstream applications?
These questions require a view of infrastructure that spans service boundaries, one where ECS, SLB, ApsaraDB RDS, VPC, and the managed services running alongside them are visible together, not in separate per-service dashboards. Without that unified view, teams at scale spend most of their operational energy correlating data manually across tools rather than acting on what the data is telling them.
This kind of Alibaba Cloud observability also helps teams reduce mean time to resolve (MTTR) by correlating signals across ECS, SLB, ApsaraDB RDS, and VPC, and optimize cloud resource usage by exposing cost- and performance-related anomalies before they impact users.
The operational goal isn't more dashboards. It's fewer decisions made under uncertainty.
From metrics to operational decisions
Alibaba Cloud's cost optimization model introduces a monitoring challenge that AWS and Azure environments don't surface in the same way. Resource reclamation on preemptible ECS instances and aggressive auto-scaling behavior tied to cost thresholds can produce performance signals that look like infrastructure degradation but are actually scheduled or triggered resource events. Without visibility into when and why resources are being reclaimed, teams misread cost-driven behavior as failure and respond to the wrong layer.
The same applies to spot instance preemption. In AWS, preemption signals are explicit and well-documented in monitoring tooling. In Alibaba Cloud, the equivalent events are less consistently surfaced in standard metric streams, which means a workload disruption caused by preemption can appear as an unexplained ECS availability drop rather than an expected cost-optimization event.
This is the gap between metrics and operational decisions: not just knowing that a threshold was crossed, but knowing whether it was crossed because of load, failure, or a resource life cycle event that the platform initiated. Getting that distinction right determines whether the response is the right one.
OpManager Nexus
OpManager Nexus is designed exactly to deliver Alibaba Cloud observability at scale. It monitors more than 50 Alibaba Cloud service types, including ECS, SLB, ApsaraDB RDS, VPC, and managed platform services, in a single unified view. Infrastructure-aware anomaly detection surfaces early signals such as ECS memory pressure or VPC packet loss before they turn into user-visible incidents. And automated workflows reduce MTTR so teams spend less time triaging symptoms and more time resolving the actual root cause.
The outcome is straightforward: Alibaba Cloud monitoring that lets teams see problems earlier, understand them faster, and act on the right layer before the impact reaches users.
FAQ
What metrics should I monitor for Alibaba Cloud ECS health?
Memory utilization, disk I/O queue length, and network interrupt and error rates tend to move before CPU in high-density ECS workloads. A monitoring model built around CPU as the primary health signal will consistently lag behind what the infrastructure is actually experiencing. Tracking the full set of compute-layer signals, not just the most familiar ones, is what gives you early warning before pressure becomes visible at the service level.
Why does ApsaraDB RDS latency increase even when the database itself isn't the bottleneck?
Increased query latency in ApsaraDB RDS is frequently a downstream effect of connection pool exhaustion at the application or ECS layer. When upstream connection handling is saturated, queries queue before they reach the database, and the latency appears to originate there. Scaling the RDS instance in response adds cost without eliminating the root cause. Before acting on database latency, validate ECS resource pressure and application connection pool behavior first.
How does Alibaba Cloud SLB distribute traffic and what monitoring signals indicate imbalance?
SLB distributes traffic based on back-end health check results, response time distribution, and connection persistence settings. The hidden risk is uneven load distribution: Some ECS instances absorb more traffic than others while aggregate SLB metrics appear balanced. The imbalance only surfaces when you look at per-instance response times and connection counts alongside SLB-level data. Aggregate metrics alone can present a stable picture while individual back ends are already under disproportionate pressure.
What is ApsaraDB RDS, and how is it monitored?
ApsaraDB RDS is Alibaba Cloud's managed relational database service, supporting MySQL, PostgreSQL, SQL Server, and MariaDB. Monitoring it effectively means tracking query latency, connection count, slow query rate, and IOPS alongside upstream signals from the ECS and application layers. Because RDS performance is frequently affected by conditions outside the database itself, meaningful monitoring treats it as part of a coupled system rather than an isolated service.
How can I reduce MTTR for Alibaba Cloud incidents?
MTTR in Alibaba Cloud environments is typically high because signals from ECS, SLB, ApsaraDB RDS, and VPC arrive in separate dashboards with no shared timeline. By the time an incident is visible, the originating cause has often moved to a different layer. Reducing MTTR requires correlating signals across service boundaries so teams can identify which service moved first, rather than triaging the most visible symptom. Automated workflows that trigger on behavioral shifts before thresholds are crossed reduce the gap between detection and response further.
What are the early warning signs of degradation in an Alibaba Cloud VPC environment?
VPC issues typically surface as intermittent timeouts, inconsistent latency between seemingly identical ECS instances, or unexplained SLB behavior rather than explicit service-level alerts. Bandwidth saturation, packet loss, and routing asymmetry at the VPC layer affect every service running inside it, but because they don't produce obvious alerts, they are consistently underweighted in monitoring configurations. Tracking VPC-layer metrics alongside ECS and SLB signals is what makes it possible to identify network-layer degradation before it is misattributed to a service further up the stack.