From event correlation to autonomous IT: Why observability isn’t enough anymore

Most IT war rooms have plenty of data, but not enough time or clarity to find the real answer. Dashboards are crowded, alerts keep piling up, and the real issue gets lost in all the noise. Ever dealt with this situation? You’re not alone, and there’s a simpler way to deal with it. OpManager Nexus closes this gap by moving beyond visibility to help teams actually diagnose and fix problems faster.
According to EMA™'s 2025 Network Observability report, 71% of IT alerts are just noise. Visibility has never been greater, but the ability to act on what's seen hasn't kept pace. As infrastructure sprawls across hybrid, cloud, microservices, and distributed networks, the gap between we can see it and we can resolve it keeps widening. Observability tells you what happened, but it doesn't tell you why and certainly doesn't fix it.
With AIOps-driven diagnostics, event correlation, causal analysis, and automated actions, OpManager Nexus helps teams stop chasing alerts and start finding real root causes faster. Here's how it works.
Why observability demands autonomous intelligence
Modern IT systems generate enormous volumes of telemetry every second. When something breaks, traditional tools surface every symptom as a separate alert, even when they all trace back to a single underlying issue. This quickly leads to alert fatigue—teams spend more time triaging than fixing. Some tools try to help by summarizing data or grouping related alerts, but summarization isn't the same as understanding. Seeing that CPU spiked, latency climbed, and three services went down at the same time tells you what happened. It doesn't tell you why or which thread to pull first.
What teams really need is something that can reason through it all. Autonomous intelligence does exactly that. It filters noise, connects related events, traces the direction of failure, and drives action, so your team spends less time chasing alerts and more time resolving the actual problem.
Which alerts actually matter?
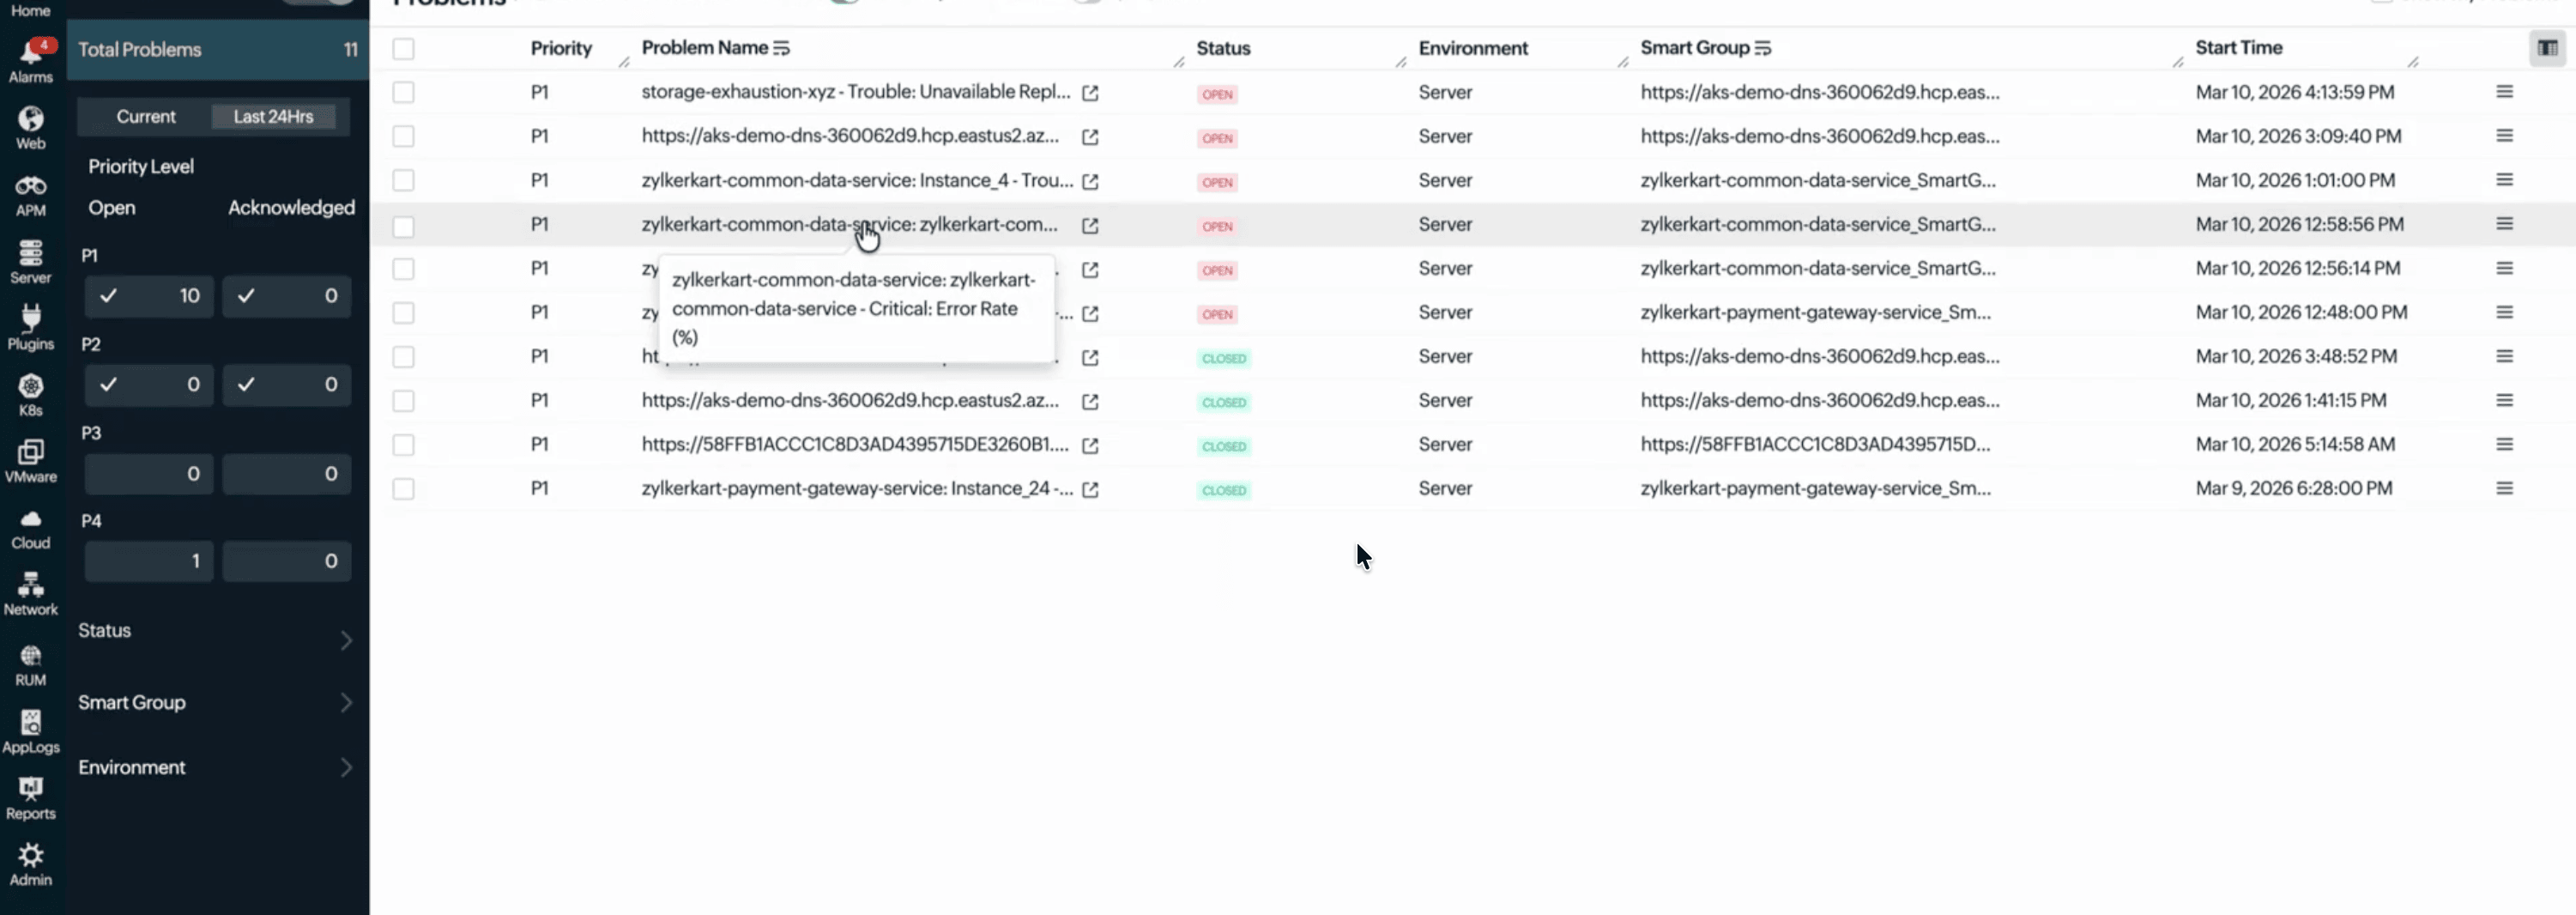
Raw alerts without context are just noise with timestamps. When a major incident hits, IT operators are flooded with thousands of concurrent alerts from across the stack. OpManager Nexus's AI-powered event correlation engine cuts through the chaos by converting that flood into a focused set of actionable problems through intelligent alert grouping—powered by two synergistic approaches:
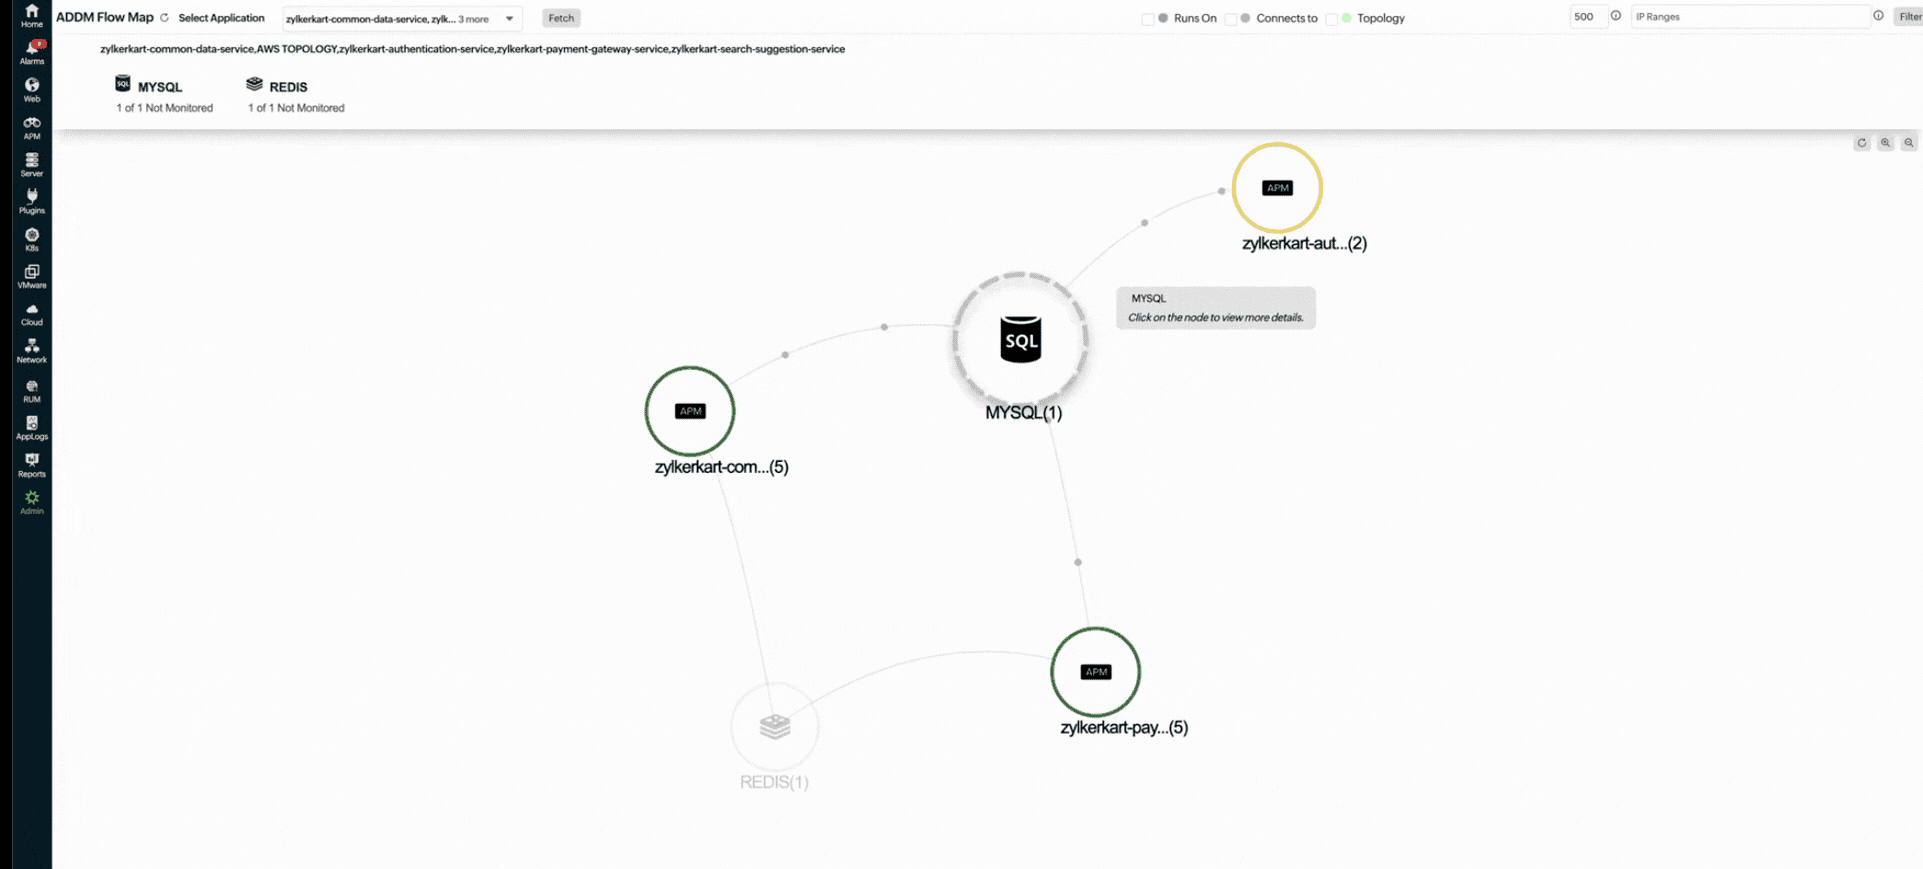
- Domain-aware correlation leverages Application Discovery and Dependency Mapping (ADDM) to automatically map your full IT topology. Alerts are grouped based on real structural dependencies
Machine learning-based correlation learns from your historical event patterns to group alerts that frequently occur together.
How do you go from assumptions to answers?
You know something broke. But the real question is why it happened. Most tools just show connected signals like CPU and latency, without explaining the cause. But did the CPU spike cause the slowdown, or did a runaway query cause the CPU spike? Guessing the direction wastes precious time.
OpManager Nexus's causal AI engine applies causal discovery techniques such as conditional dependency analysis on time-series data to infer cause and effect relationships and identify root causes across:
- Event level: Which infrastructure event triggered the anomaly?
- Transaction level: Which API call or database query caused the bottleneck?
- Exception level: Which specific error in the code threw the failure?
- Network level: Where did the latency or packet loss enter the picture?
The outcome is deterministic root cause identification. Your engineers fix the right thing the first time and mean time to repair (MTTR) drops dramatically.
What happens after the root cause is found?
Diagnosis without action is just a well-documented problem. OpManager Nexus's autonomous AI closes this loop by reasoning through operational data, summarizing the incident in plain language, and executing a precise remediation plan automatically. Through deep integration with Qntrl Circuits, Zoho's workflow and orchestration platform, these autonomous actions are fully governed and auditable. Common automated responses include:
- Clearing temporary files when disk space exhaustion is confirmed.
- Restarting hung services or virtual machines.
- Dynamically scaling Kubernetes clusters during traffic surges.
- Rerouting network traffic during a switch failure.
You choose your level of autonomy. For critical decisions, keep a human in the loop. For repetitive, low-risk issues, enable zero-touch, closed-loop remediation. Either way, compliance and stability remain firmly protected.
The ManageEngine difference
As AI becomes everyone's favorite buzzword, one question matters: Whose AI is handling your sensitive telemetry data?
When you hand over your infrastructure telemetry to an AI system, you should know exactly where it lives. With ManageEngine, that answer is simple: Your data stays in ManageEngine's own data centers. It doesn't train shared LLMs. It doesn't move across organizations. It's yours.
That same commitment to accountability extends to how Zia learns your environment. Rather than applying generic models out of the box, Zia builds baselines specific to your infrastructure from the moment monitoring begins, so what it flags as abnormal is genuinely abnormal for your systems, not for someone else's.
- Short-cycle baseline (two weeks): Zia compares each metric against the same hour's values from the past two weeks, capturing weekly seasonal patterns like weekend traffic drops or end-of-month processing spikes.
- Long-cycle baseline (four weeks): For correlated metrics, Zia uses four weeks of data and filters out the top five percent of extreme values before building the baseline, ensuring that transient spikes don't become the new normal.
Once both baselines are active, Zia flags deviations before they trip a static threshold, giving your team earlier warning with fewer false positives. And because enterprise IT cannot run on black-box decisions, every prediction, correlation, and causal finding comes with a transparent, human-readable explanation. You stay informed and in control—always.
Get ready to move beyond reactive IT
By now, it's easy to understand why observability alone isn't enough anymore. Seeing the problem was never the hard part. Finding its cause and fixing it before it costs you, is. OpManager Nexus gives your DevOps, SRE, and ITOps teams the autonomous intelligence they need to fix what matters—faster, smarter, and with far greater confidence. The shift from reactive to autonomous decision-making doesn't happen overnight, but it starts when the system already knows what broke, why, and what to do next. That's exactly where OpManager Nexus begins and where self-healing IT becomes less of an aspiration and more of a daily operational reality.
FAQs
1. What is the difference between event correlation and causal AI in AIOps?
Event correlation groups related alerts into a single problem based on topology and historical patterns. Causal AI goes further: It determines which event actually triggered the others so your team fixes the root cause, not just the symptoms.
2. What are autonomous IT operations?
Autonomous IT operations use AI to move from passive monitoring to active, self-managing systems that detect, analyze, and resolve issues with minimal human input. In OpManager Nexus, this operates in three layers:
- Detection: Zia’s anomaly detection identifies deviations from normal behavior across infrastructure, applications, and networks—often before threshold-based alerts trigger.
- Reasoning: Causal AI analyzes time-series dependencies to determine the root cause and understand why an issue occurred.
- Action: Zia Agents recommend and, upon approval, execute fixes via Qntrl Circuits, ensuring that all actions are governed, auditable, and traceable.
3. What types of problems can be auto-remediated without human approval?
Low-risk, well-understood actions are best suited for zero-touch remediation, such as restarting a hung service, clearing disk space, or scaling a Kubernetes cluster. Higher-stakes changes always require human approval in Qntrl Circuits before any action is taken.
4. How does OpManager Nexus determine the root cause of an incident?
Most AIOps tools only show related alerts. OpManager Nexus goes further by using causal AI to analyze the direction of failure across infrastructure, application, and network layers. It identifies the probable root cause so teams can fix the issue faster, instead of interpreting multiple symptoms.
5. Does OpManager Nexus need to be manually configured to understand how my infrastructure is connected?
No. OpManager Nexus automatically maps your infrastructure using ADDM, creating a live view of how components are connected. This helps event correlation group alerts based on real dependencies. ADDM requires the Full-Stack Agent and APM Insight agent.