Color-coded log monitoring for simplified log analysis
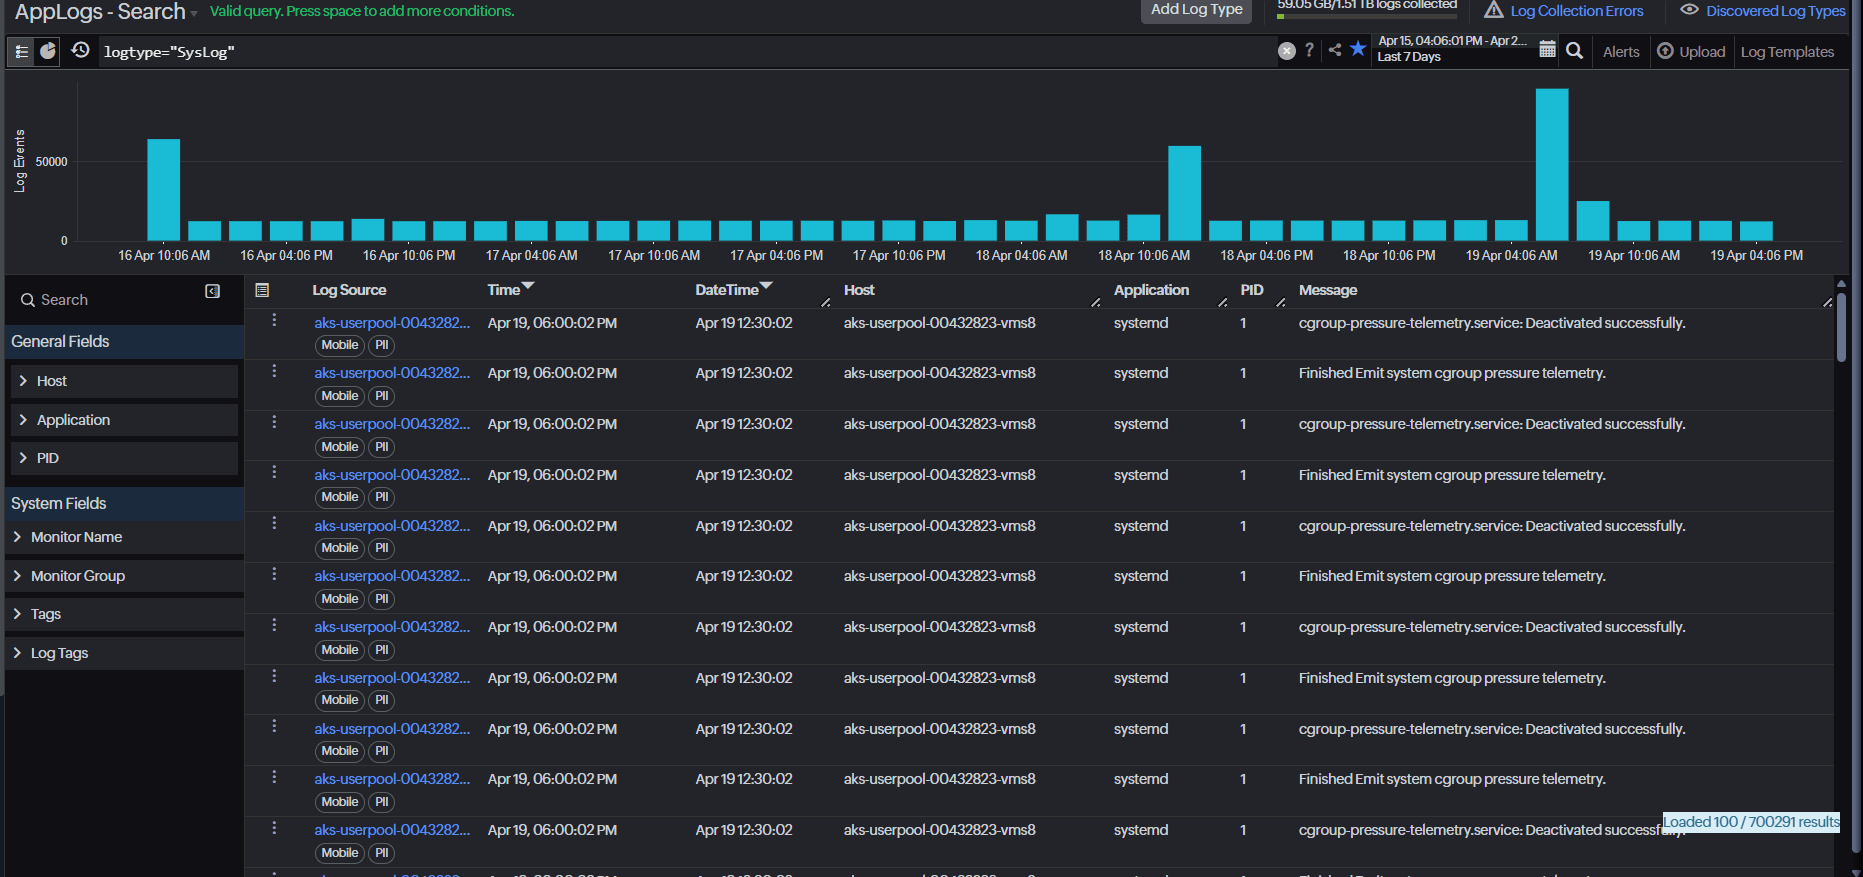
Modern production environments generate massive volumes of logs every day. As systems become more distributed and cloud-native, that volume only increases. The real challenge isn’t collecting logs—it’s identifying what matters fast enough to act using effective log visualization.
Most log views fail at this point. Every entry looks the same, forcing engineers to scan them manually and interpret lines under pressure.
Color conditions in Log Management solve exactly that problem by doing the sorting visually with log severity highlighting, making critical and high-priority log entries impossible to miss before you read a single line.
Why logs are harder to read than they should be
A newspaper doesn't present everything in the same font and size. It uses hierarchy: headlines, spacing, and layout to guide your attention before you read a single word.
Logs don't do that. They're flat, uniform, and dense. Every time you open a log stream, you have to:
Scan line by line, with no visual cues to anchor your attention.
Interpret context manually, relying on pattern recognition built over time.
Decide what's important on the fly, often under pressure.
During a live incident, this isn't just inefficient. It's risky.
What changes with color-coded log monitoring
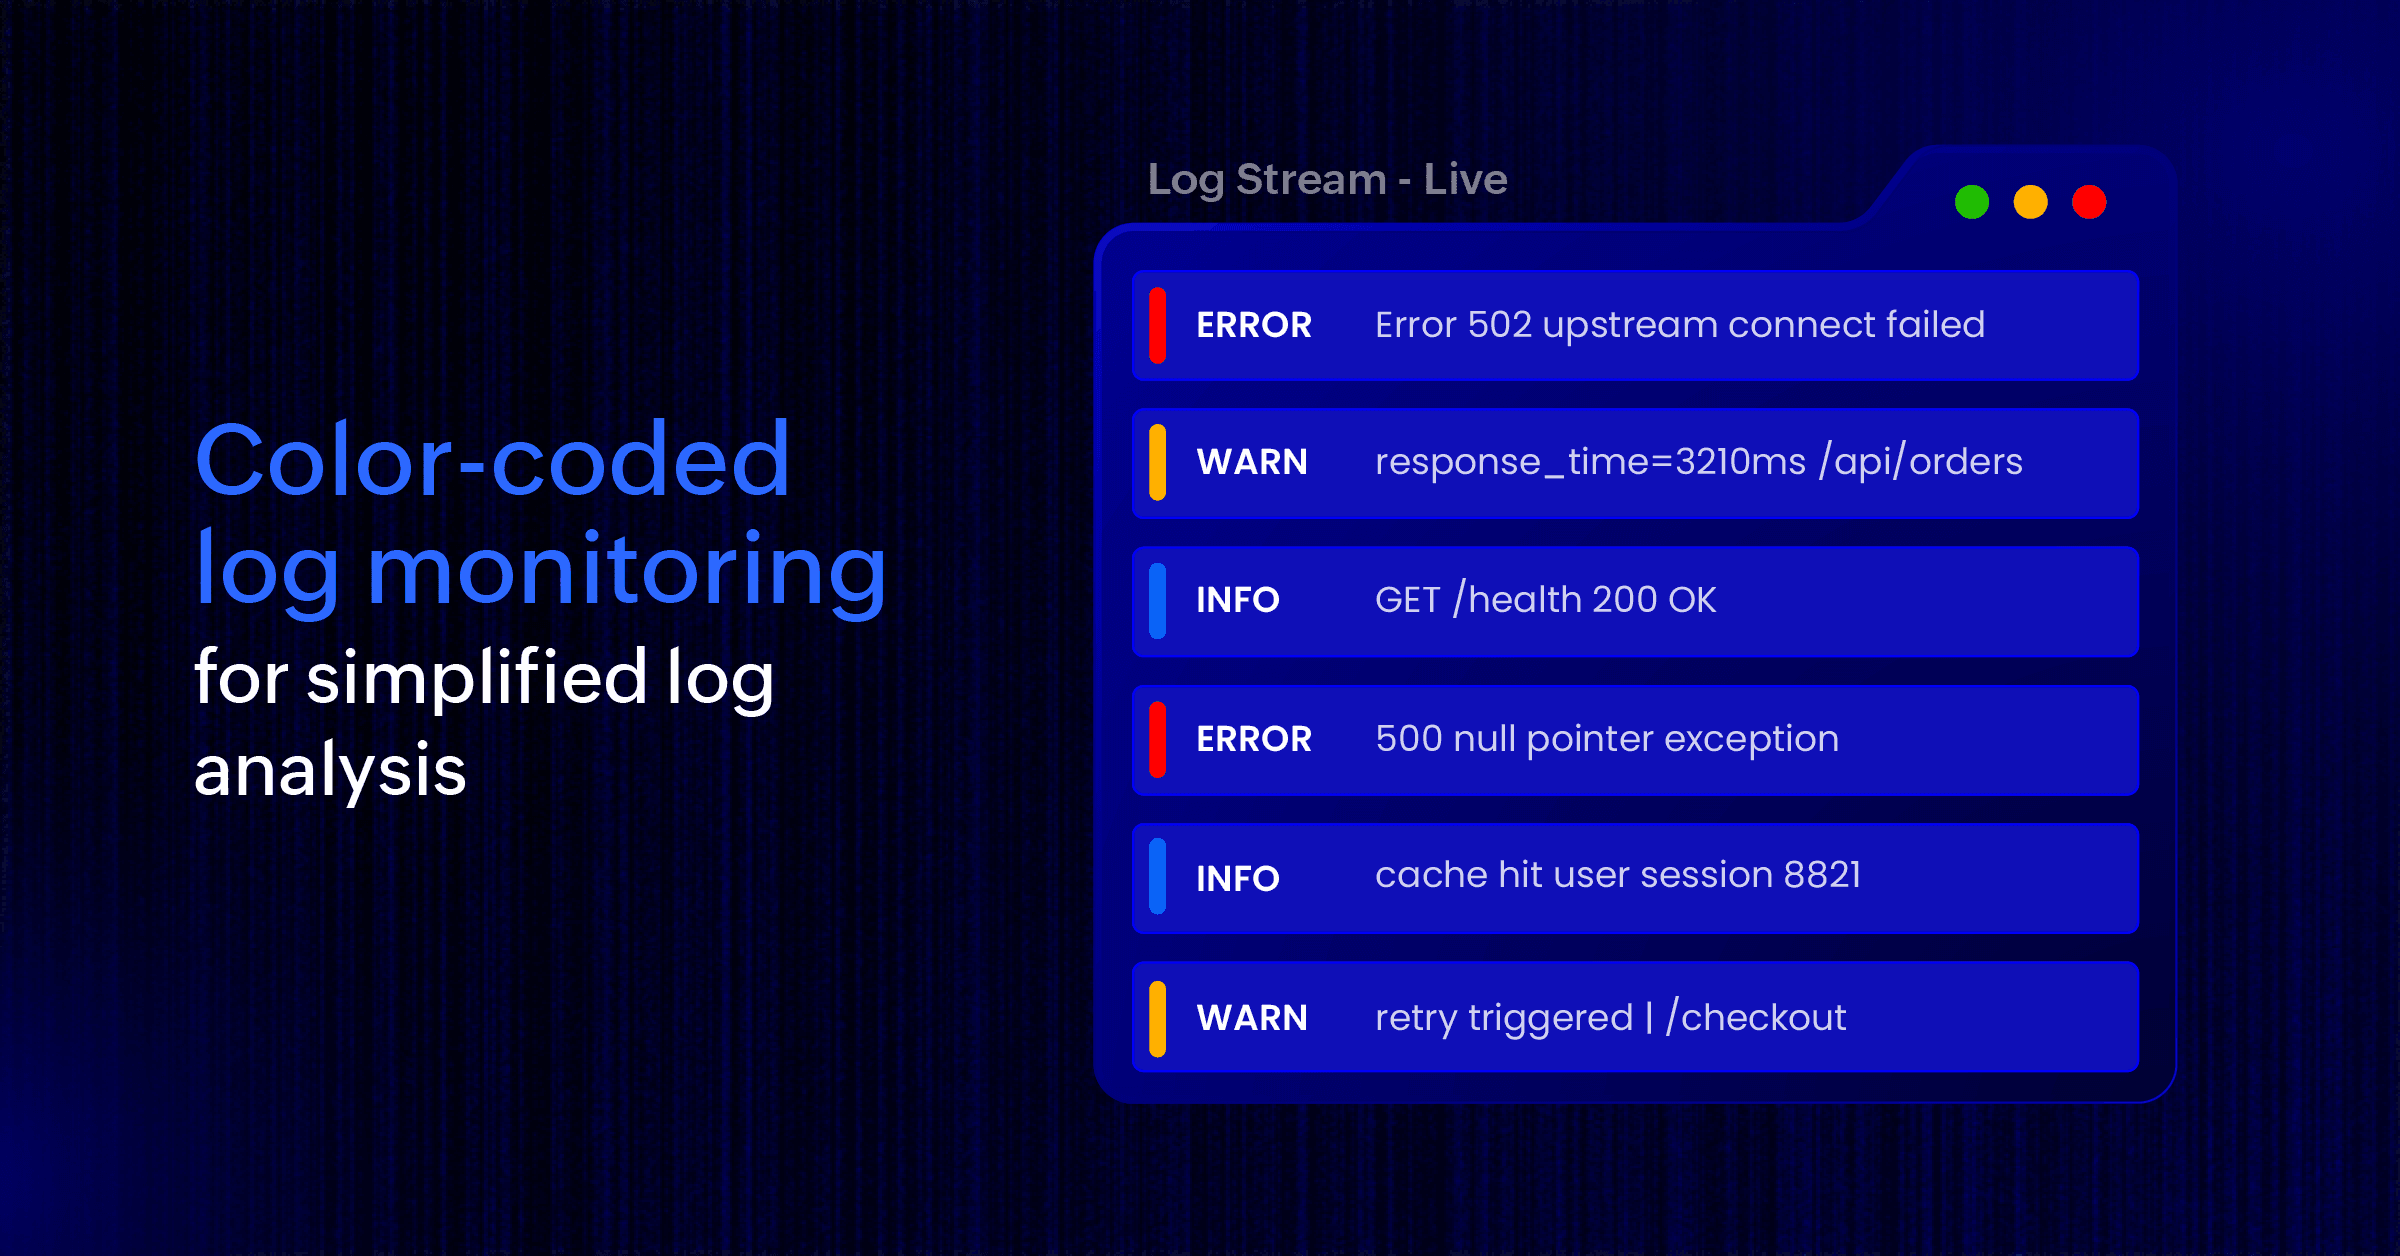
Now imagine the same log stream, but with visual cues built in. Errors stand out in red. Warnings appear in amber. Everything routine fades into the background. You don't need to search for problems anymore—they find you.
Instead of treating logs as raw text, color conditions turn them into a visually prioritized view through color-coded log monitoring. You define conditions based on your data, and matching log entries are automatically highlighted in the colors you choose. The result is immediate: your eyes go where they're needed most, without effort.
Beyond the default: Your rules
Color conditions are useful because of their flexibility. Default color conditions are already available for several log types based on severity levels and status codes. Beyond these defaults, you can also create custom conditions tailored to your environment.
You can configure conditions using matching text or regular expressions for specific fields such as log level, status code, application, or message content.
Specific error codes or HTTP status ranges.
Messages containing certain keywords.
Activity from a particular application, host, or service.
Any combination of fields that matter to you.
What counts as "critical" isn't decided by the tool. It's defined by your system.
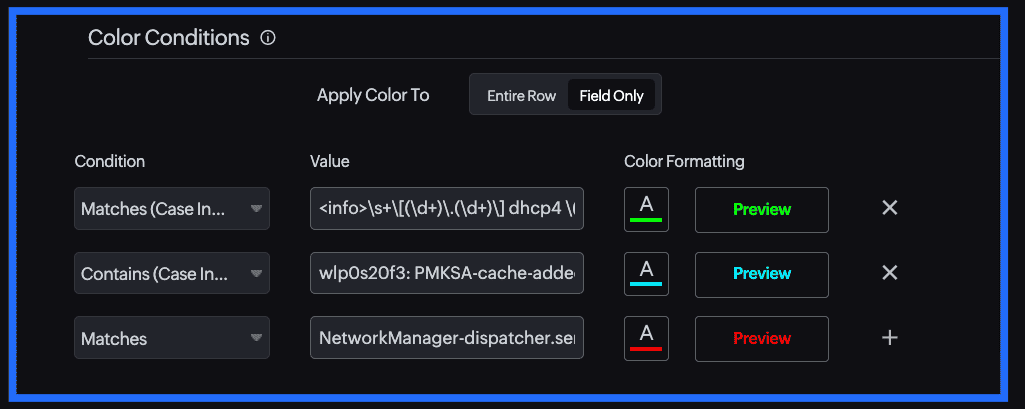
You can configure these conditions directly within your log type settings, keeping everything centralized and easy to manage. To configure a color condition:
Go to Log Type Settings and create a new color condition.
Add matching text or a regex pattern for the required log field.
Assign a highlight color and save it to automatically color-code matching logs in the search view.
From log stream to heat map
One condition is helpful. Multiple conditions change how you read logs entirely. Stack them, and your log view starts behaving less like a text stream and more like a heat map:
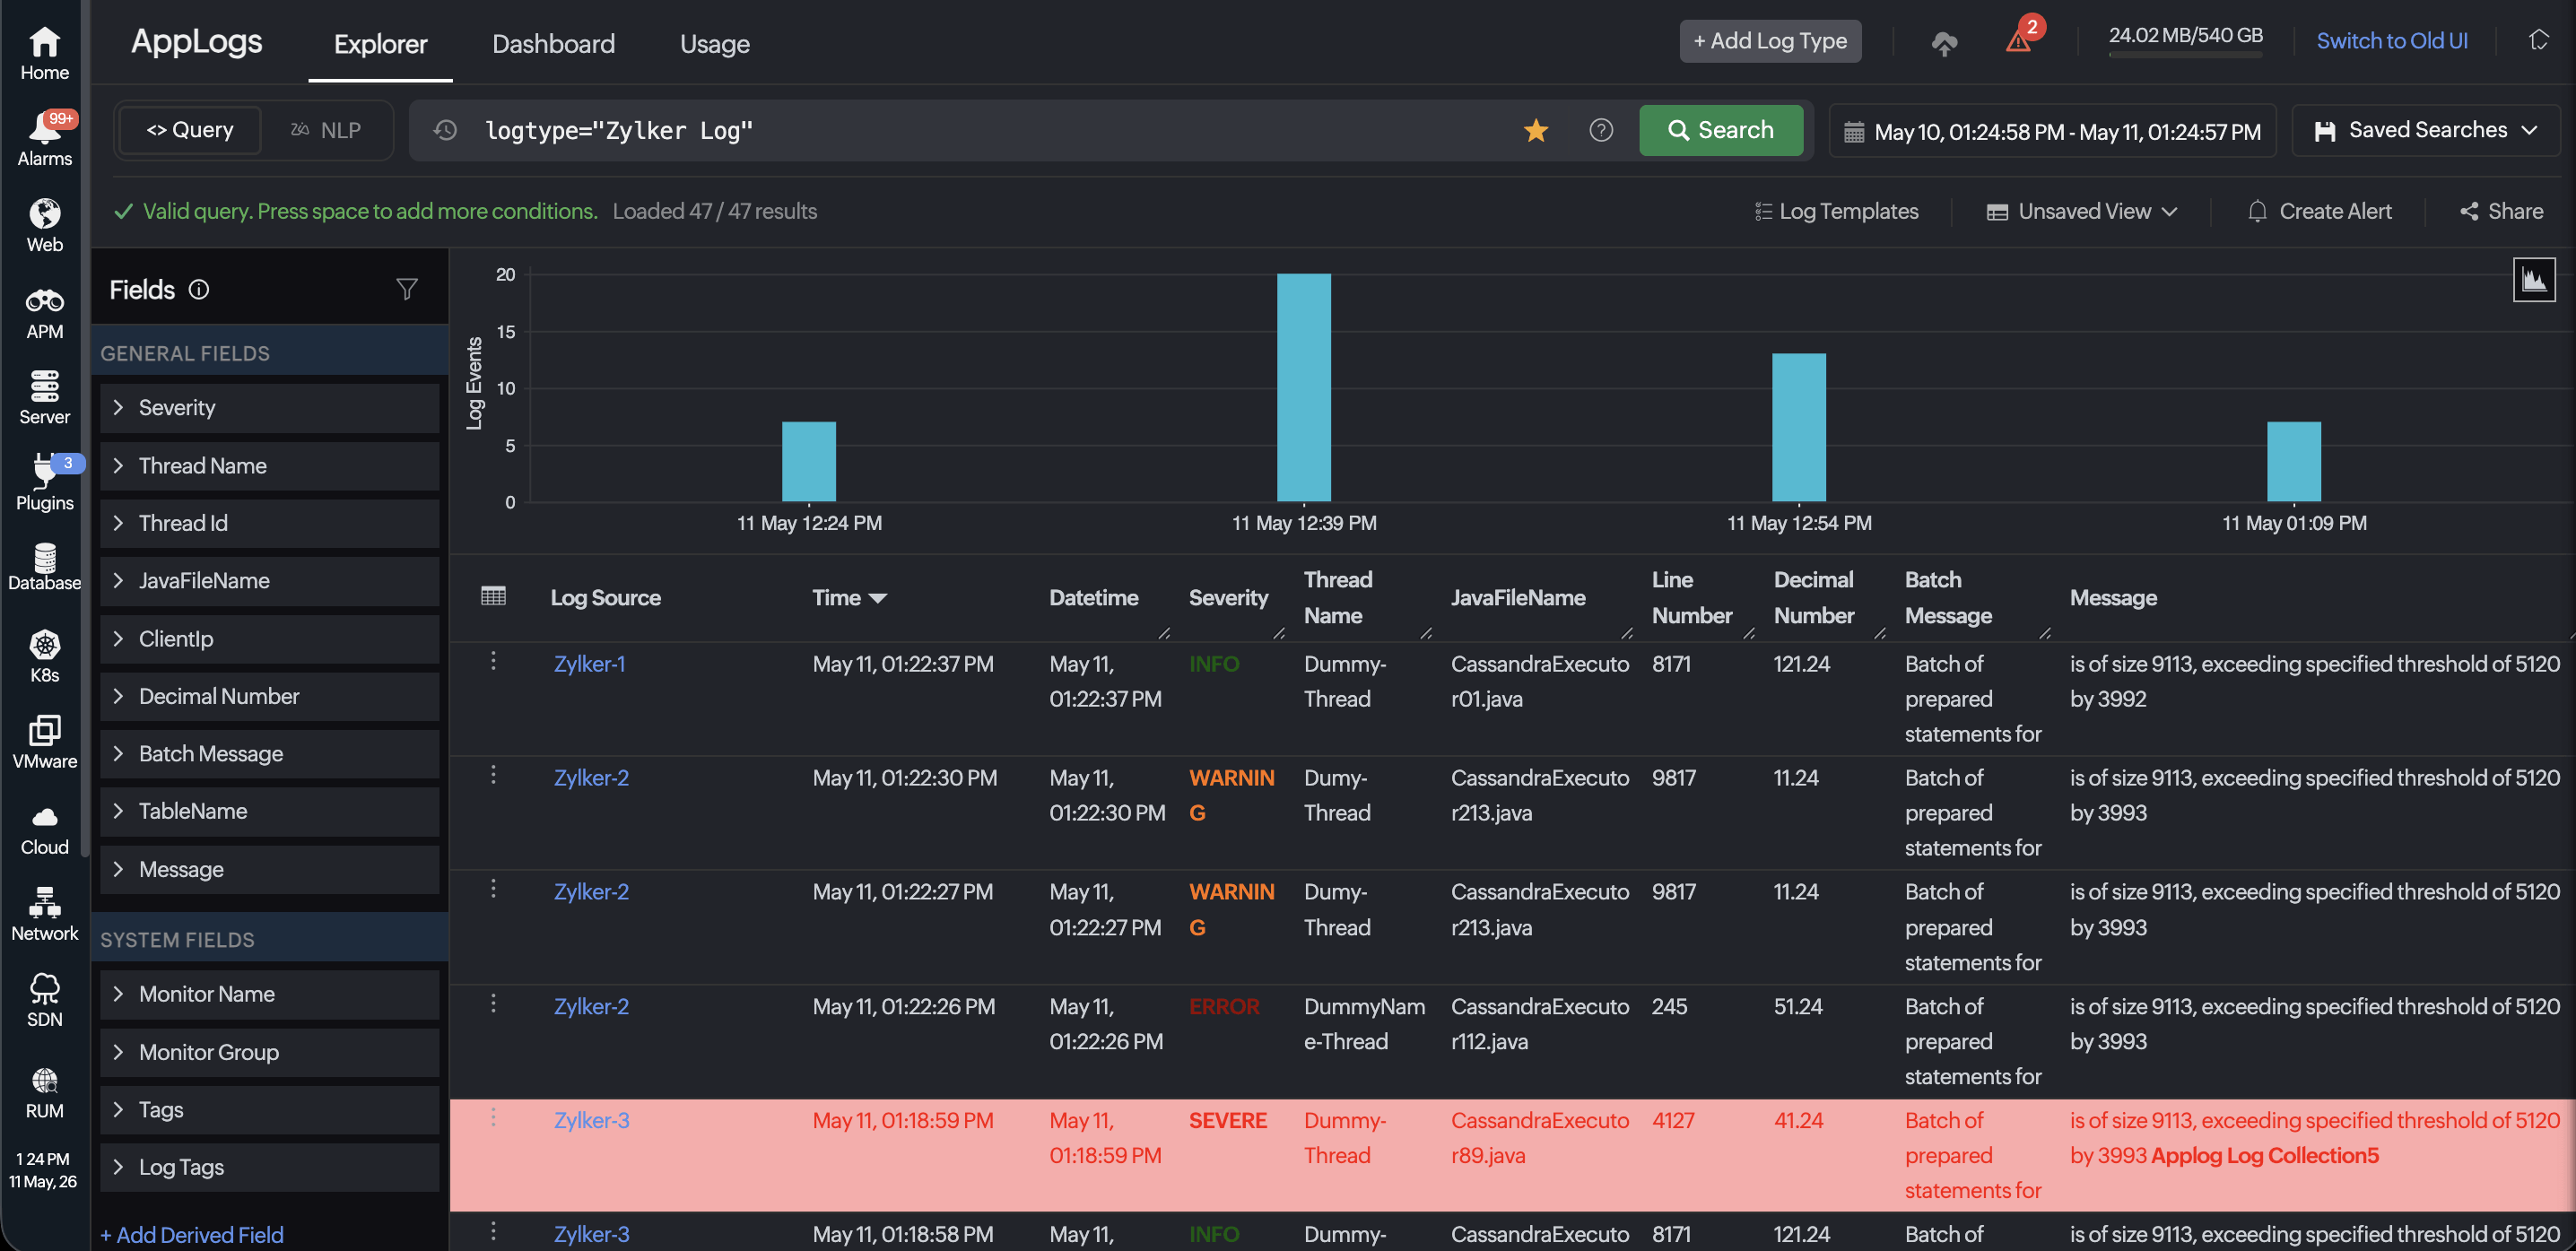
Critical errors are highlighted in red for immediate attention.
Warnings appear in amber to flag issues that need monitoring.
High-priority services are a distinct color so they never get lost.
For instance, if your team monitors an e-commerce platform, you could configure red for HTTP 5xx errors, amber for slow response times above your SLA threshold, and blue for traffic from a critical enterprise client. This layered view helps you spot patterns instantly using log pattern highlighting without needing to dig through raw logs.
A shared language for faster log triage automation
When logs are color-coded, interpretation becomes immediate and consistent. Everyone looking at the same dashboard sees the same priorities. No debate about whether something is urgent, no need to explain context in the middle of an incident. The color already tells the story.
And it tells it the same way, to everyone, in every situation.
New engineers who once spent their first on-call shift asking questions now get answers from red rows before anyone explains.
Teams that used to scan mid-incident now triage, because the dashboard has already done the work.
Shared dashboards that once needed a narrator now communicate severity the moment someone opens them.
Logs that speak before you read them
Monitoring isn't just about collecting data. It's about making that data usable in the moments that matter most. Color conditions in Log Management shift logs from passive records to active signals, reducing the effort required to interpret information and helping teams move from observation to action faster through log severity highlighting and log visualization.
Start with your noisiest services, define a few high-impact conditions, and let your logs guide your attention automatically.
Your logs have always contained the answers. Color conditions in OpManager Nexus make sure you can see them at a glance.