System utilization
Last updated on:
Overview
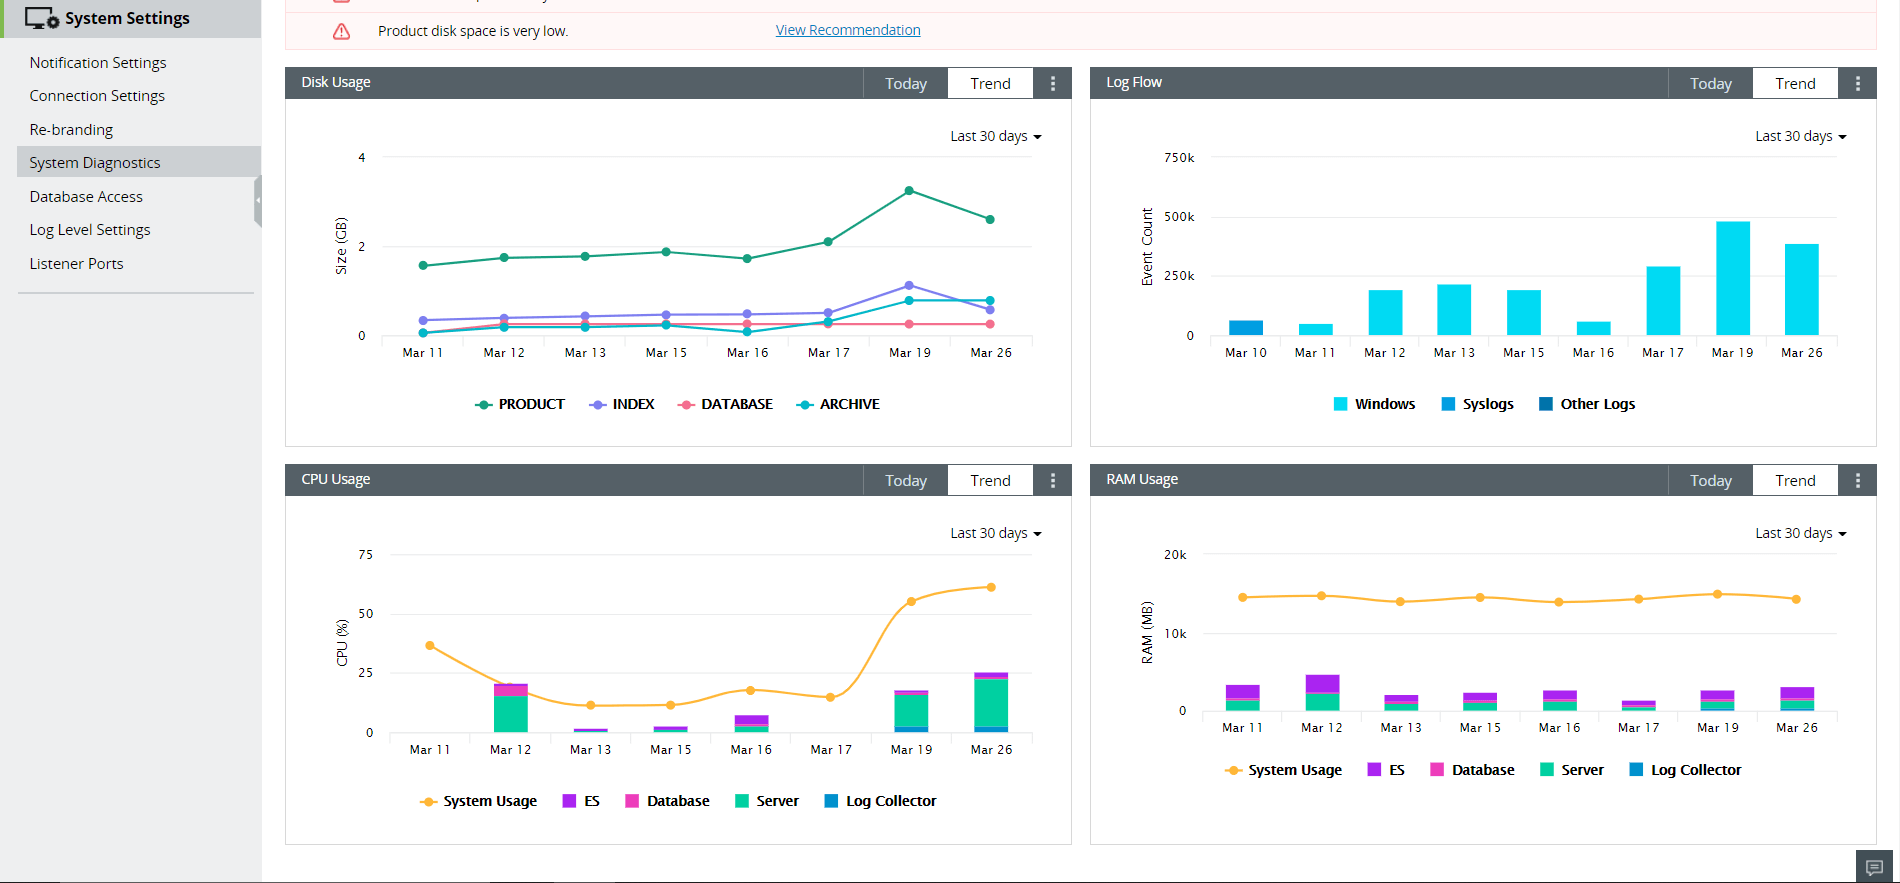
The System Utilization page provides an overview of how your Log360 deployment is performing in terms of storage and resource usage. It displays four key categories- Disk Usage, Log Flow, CPU Usage, and RAM Usage, to help you identify potential performance issues and optimize system resources.
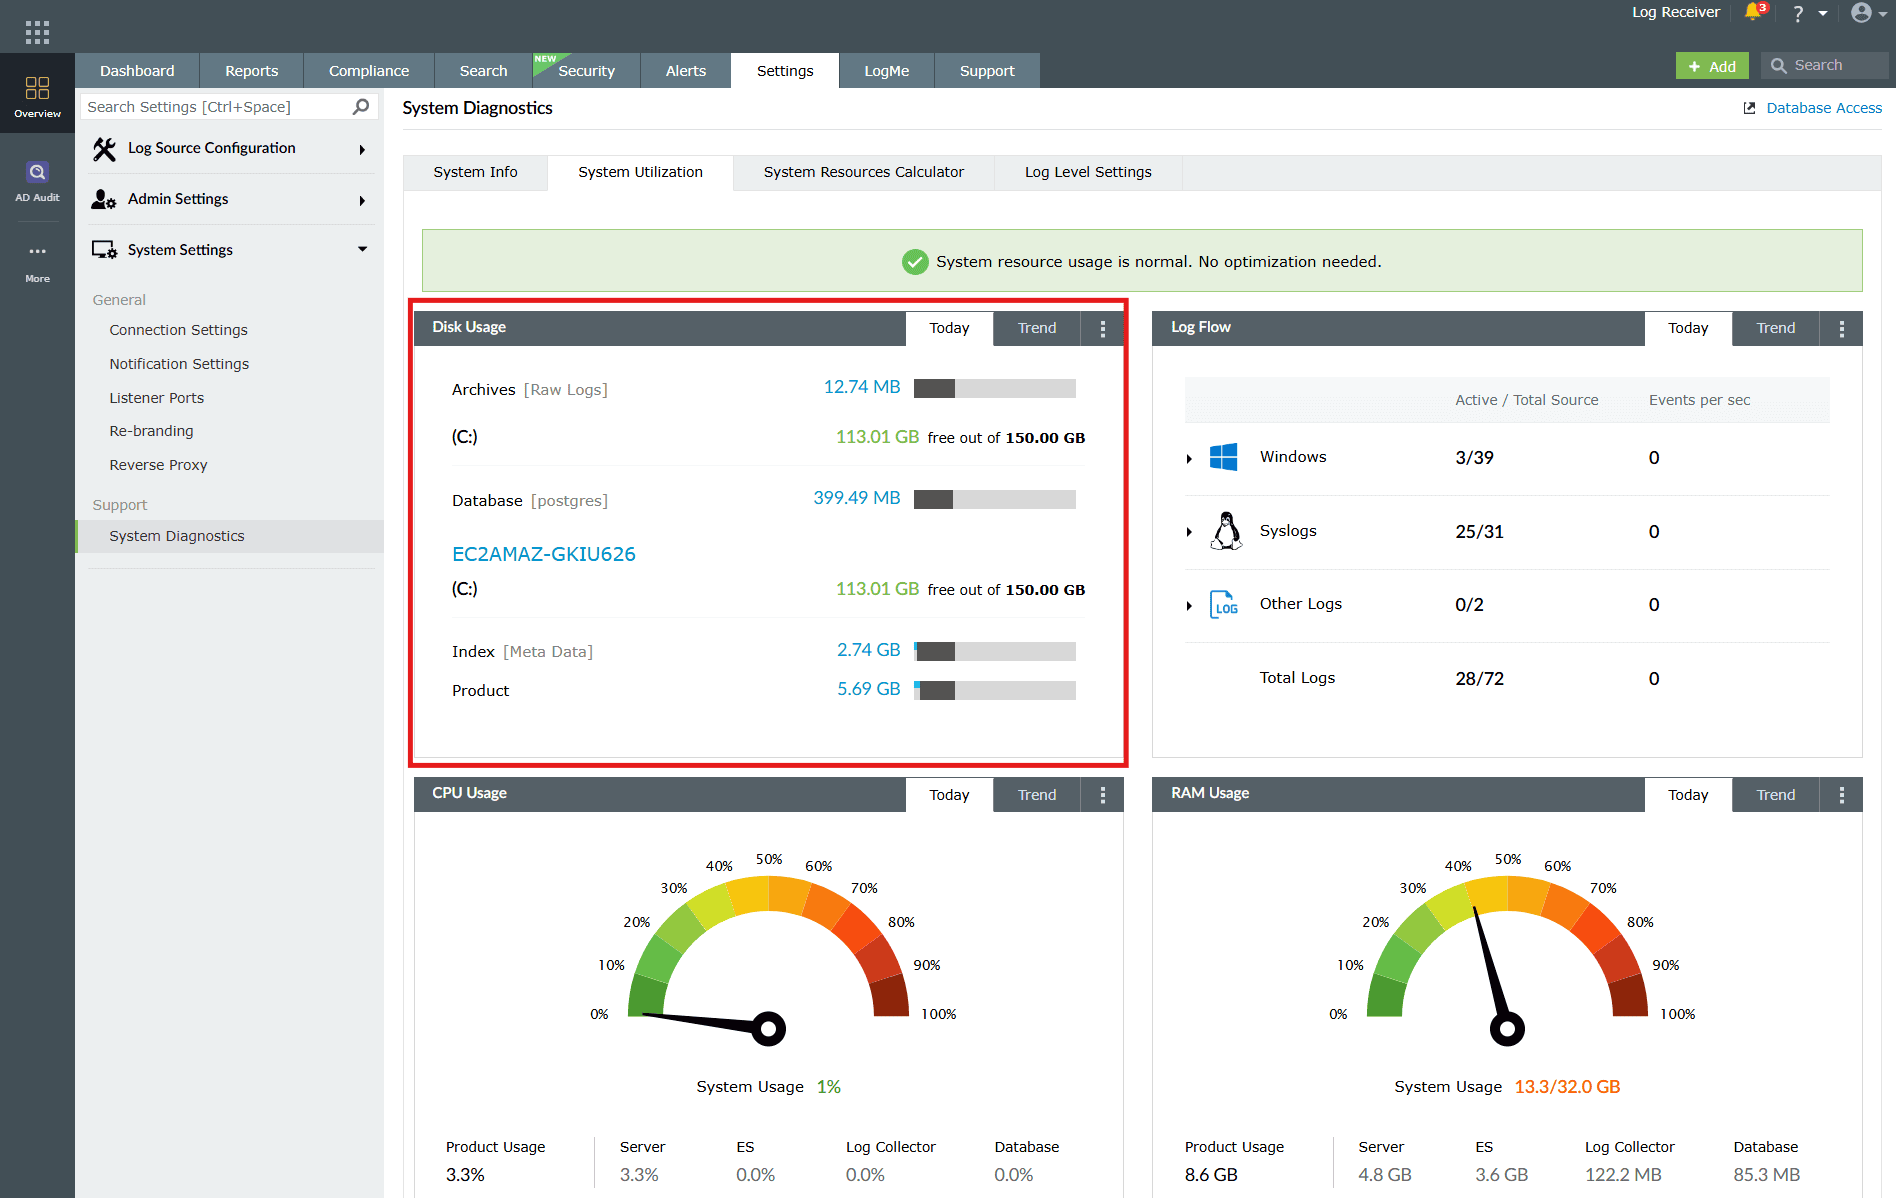
- Disk Usage shows how much storage is consumed by archives, indexes, databases, and product files.
- Log Flow helps track incoming log rates for Windows, Syslog, and other log sources.
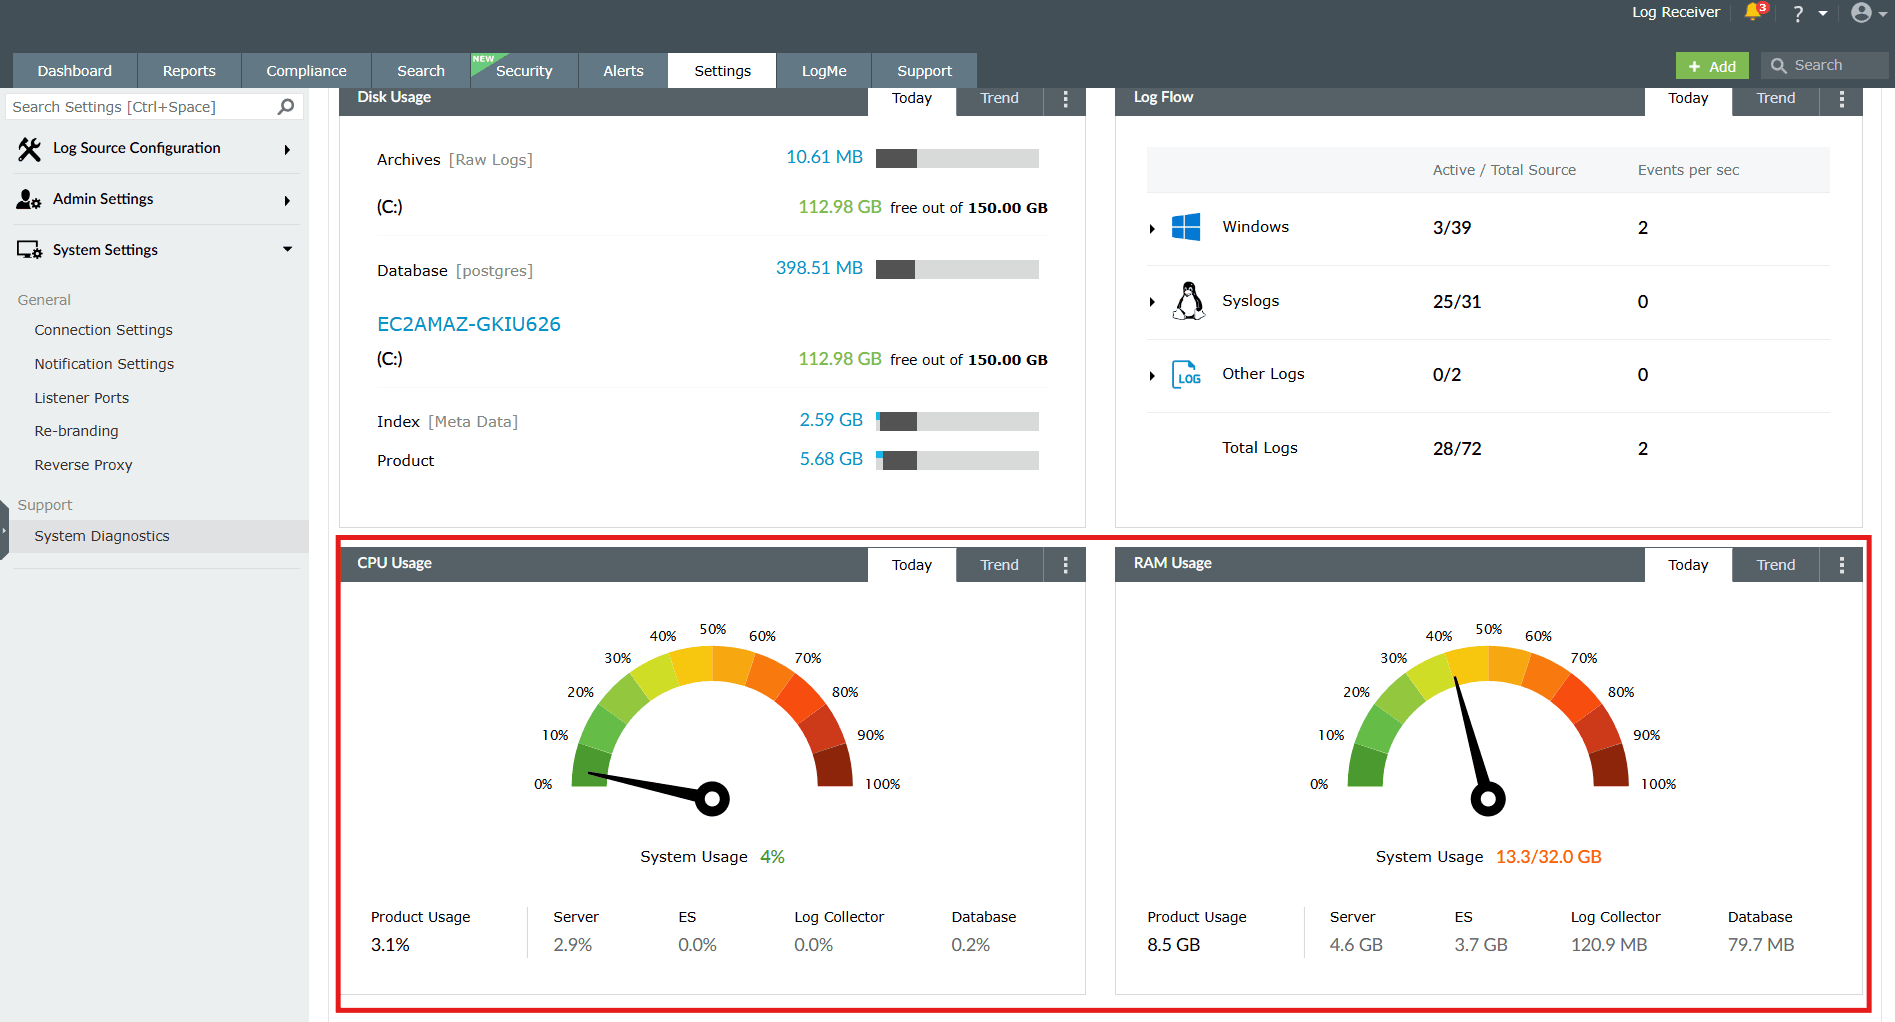
- CPU Usage indicates processor load from core product executables.
- RAM Usage reflects memory consumption by the server and product components.
By monitoring these metrics, administrators can proactively manage performance, avoid resource bottlenecks, and maintain continuous log collection.
Accessing system utilization tab:
- In the Settings tab, navigate to System Settings > System Diagnostics > System Utilization.
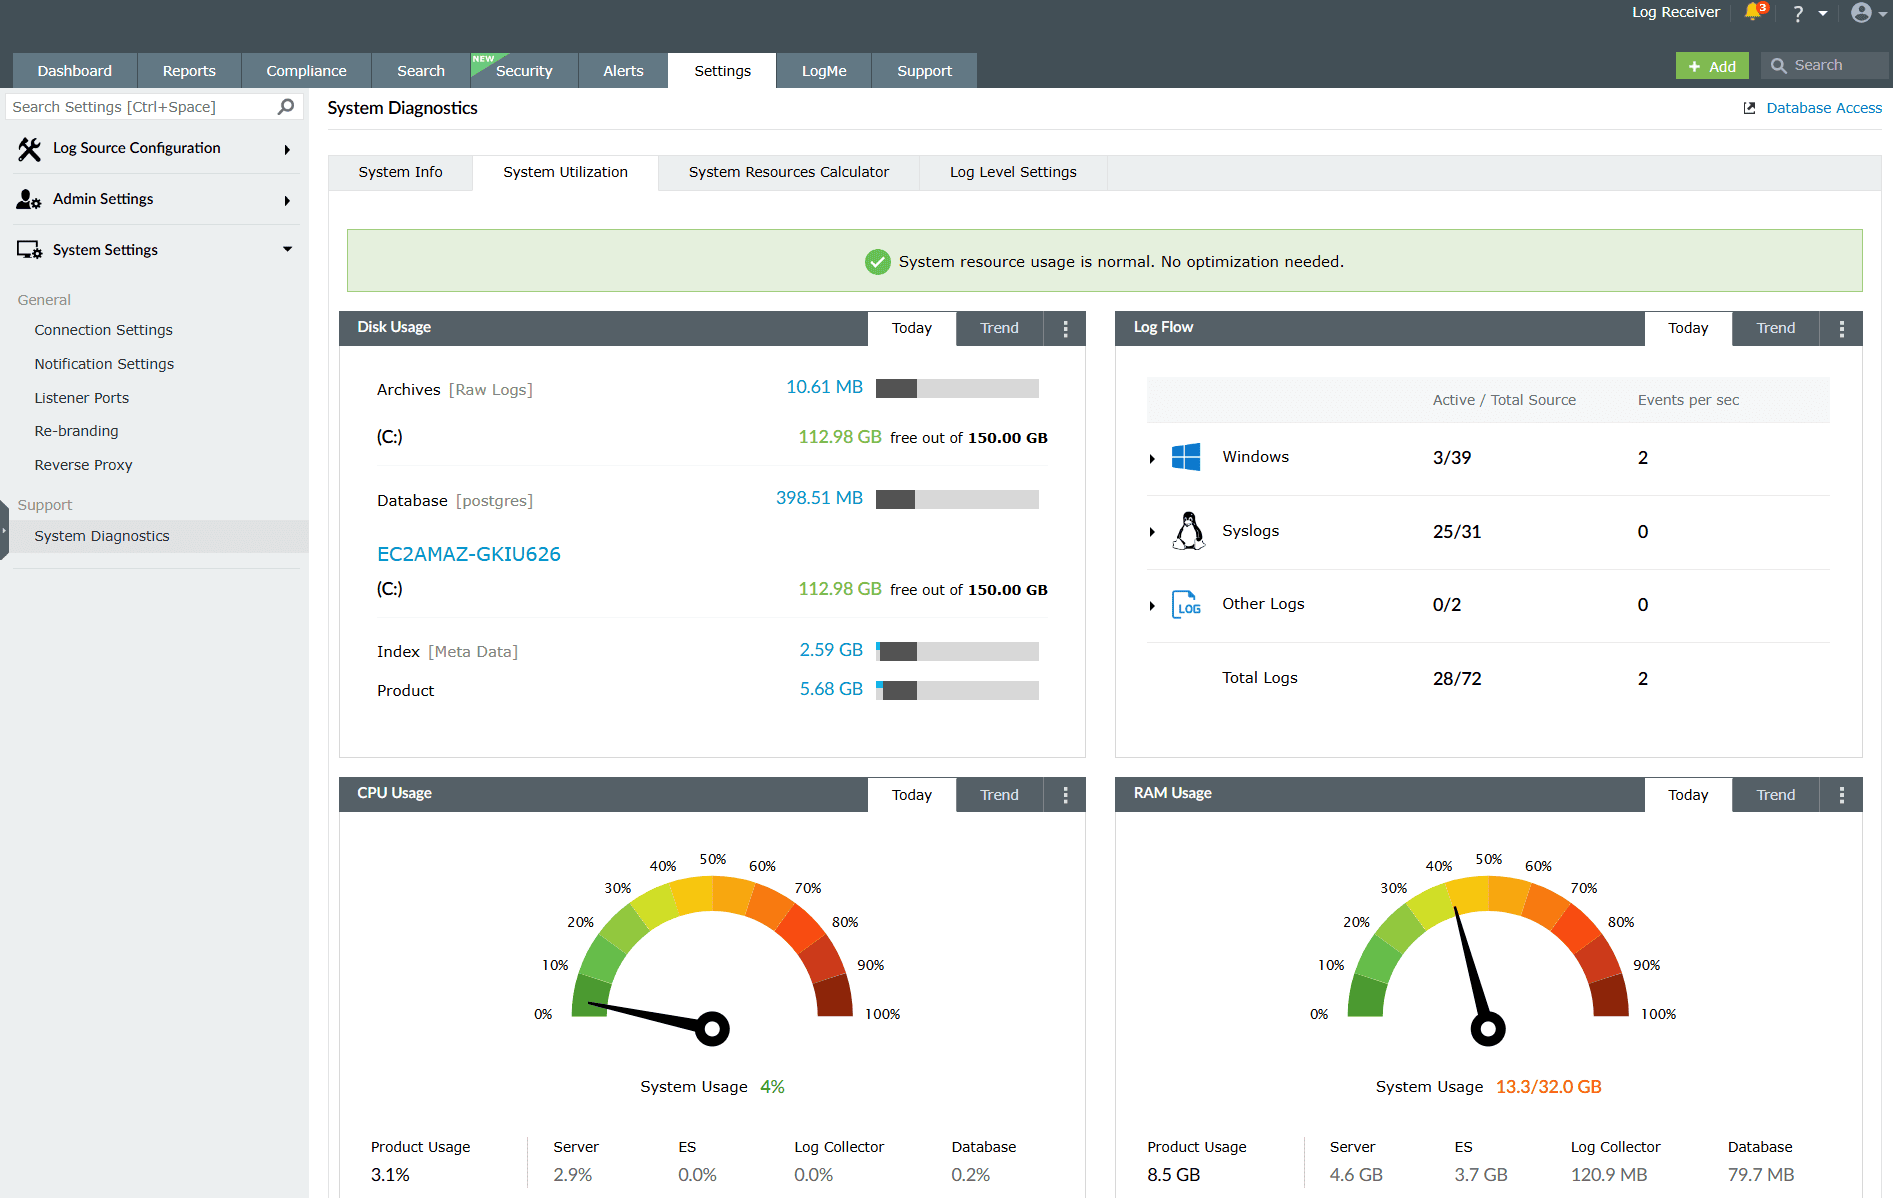
Image 1: System utilization tab under system diagnostics - The details of Disk Usage, Log Flow, CPU Usage, and RAM Usage of the product will be displayed here.
Disk Usage
For calculating the disk usage, we take four different modules into account, namely Archive, Index, Database, and Product disk space.
Recommendations
Below are some actions you can take for the following categories if any module's disk space is low:
- Archive disk usage
- Index disk usage
- Database disk usage
- Product disk usage
Archive disk usage
- Increase the disk space for the archive location.
- Reduce the archive zip creation interval so that the archive files will be zipped quicker and the disk usage will be reduced.
- Reduce the incoming log flow from the devices by collecting only the required logs. This helps avoid filling up disk space, and is accomplished using log collection filters.
- Decrease the archive retention period from the default of 90 days. If the archive retention period is set to "forever", it can cause an increase in disk usage.
Index disk usage
- Increase the disk space at the indexing location.
- Change the indexing location from the default directory to another directory. Refer to this documentation to learn how to change the index location.
- Reduce the retention period. The index retention period is similar to the database retention period. It can be changed in Settings > Admin Settings > Retention Settings > Current Storage size.
- Reduce the incoming log flow, using log collection filters to avoid filling up the disk space.
Database disk usage
- Increase the disk space at the database location.
- If the disk utilization for the database is abnormal, contact support and provide the following details:
- Database retention period
- Log inflow rate
Product disk usage
- Increase the disk space in the disk where the product is installed.
- If the product instance is installed in the same directory as Windows, please migrate the instance to some other directory.
- Contact support with these details about the folder that occupies the majority of the disk space:
- PRODUCT-HOME/ES /CachedRecord -> Number of entries
- (PRODUCT-HOME) /data/AlertDump -> Number of entries
Log Flow
Devices in a network generate huge quantities of logs, and this can slow down your system. Ensure that you collect only those logs that you require. Reducing the log flow can help optimize the usage of resources such as CPUs and servers, as it would require dealing with a lesser number of logs. A reduced log flow rate also reduces the load on databases and archives.
- Log Flow shows three different categories, namely Windows, Syslogs and Other logs.
- It displays the incoming log flow of all the devices based on log type.
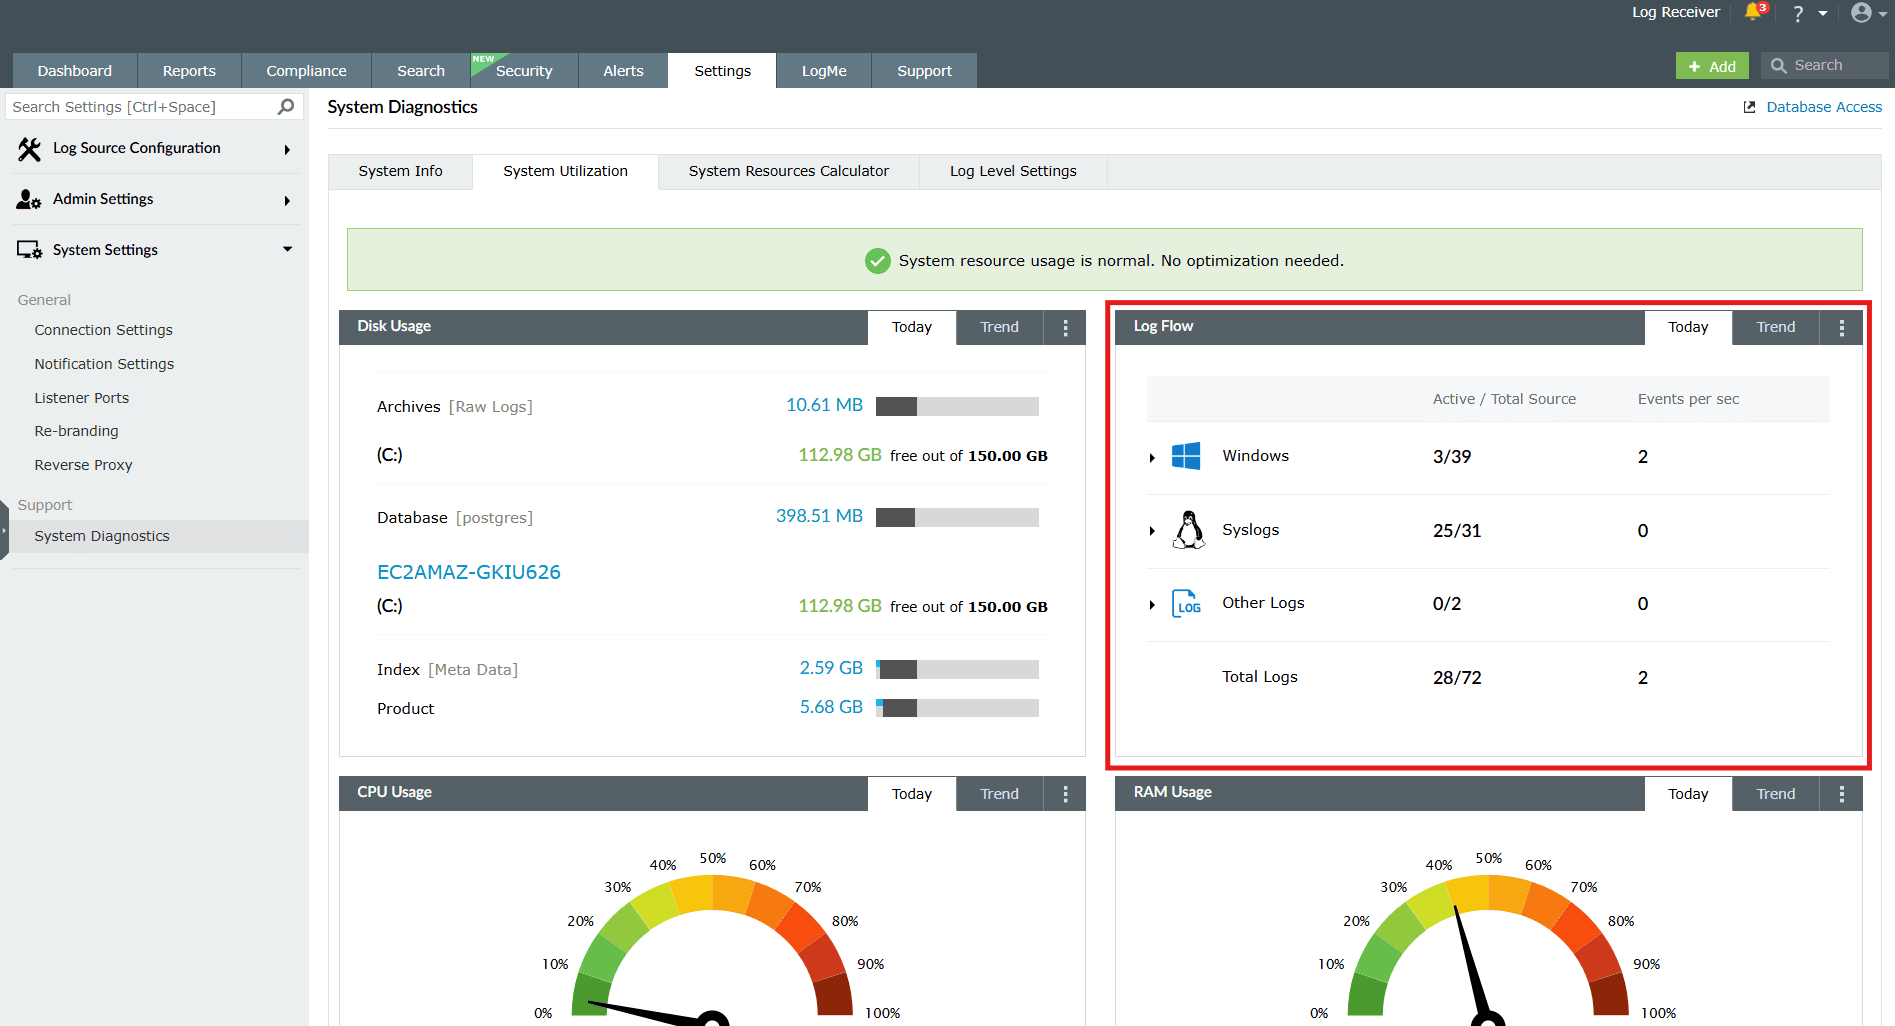
This dashboard allows you to monitor the log flow rate for the different types of logs and manage your resources accordingly. You can also check the Trends tab to get a better idea of the log flow rates in the recent past.
Resource Usage
CPU and RAM usage displays the resources being used by the product's executables and the total usage by the server hosting the product. Product executables include the server, Elasticsearch, the log collector, and the database.
Recommendations
Below are some actions that you can take to optimize the usage of resources:
CPU Usage
- Increase the number of CPU cores available.
- Check if there are any cached records being processed from ( PRODUCT-HOME )/ES/CachedRecord.
- Check if there is an alert dump in ( PRODUCT-HOME )/data/AlertDump.
- If the CPU usage is still high, contact support with the above details.
RAM Usage
- Increase the amount of RAM available.
- If the RAM usage is still high, contact support.
Trends
You can view the trends of the resources being utilized over a period of time. The Trends tab contains the data for each day the product is up and running, and can be viewed in three different formats:
- Last 7 days
- Last 14 days
- Last 30 days
Read also
This page explains how to assess system resource usage and trends to ensure uninterrupted performance. For more relevant system settings and configurations, refer to the below help documents: