System Info
Last updated on:
In this page
Overview
This page outlines the System Info module of Log360, which provides essential details on JVM usage, system environment, enabled features, and diagnostic tools. It helps you monitor performance, verify configurations, and a troubleshooting widget for faster issue resolution.
Accessing system information
- Navigate to Settings > System Settings > System Diagnostics.
- The System Info tab will be displayed as shown in the below image.
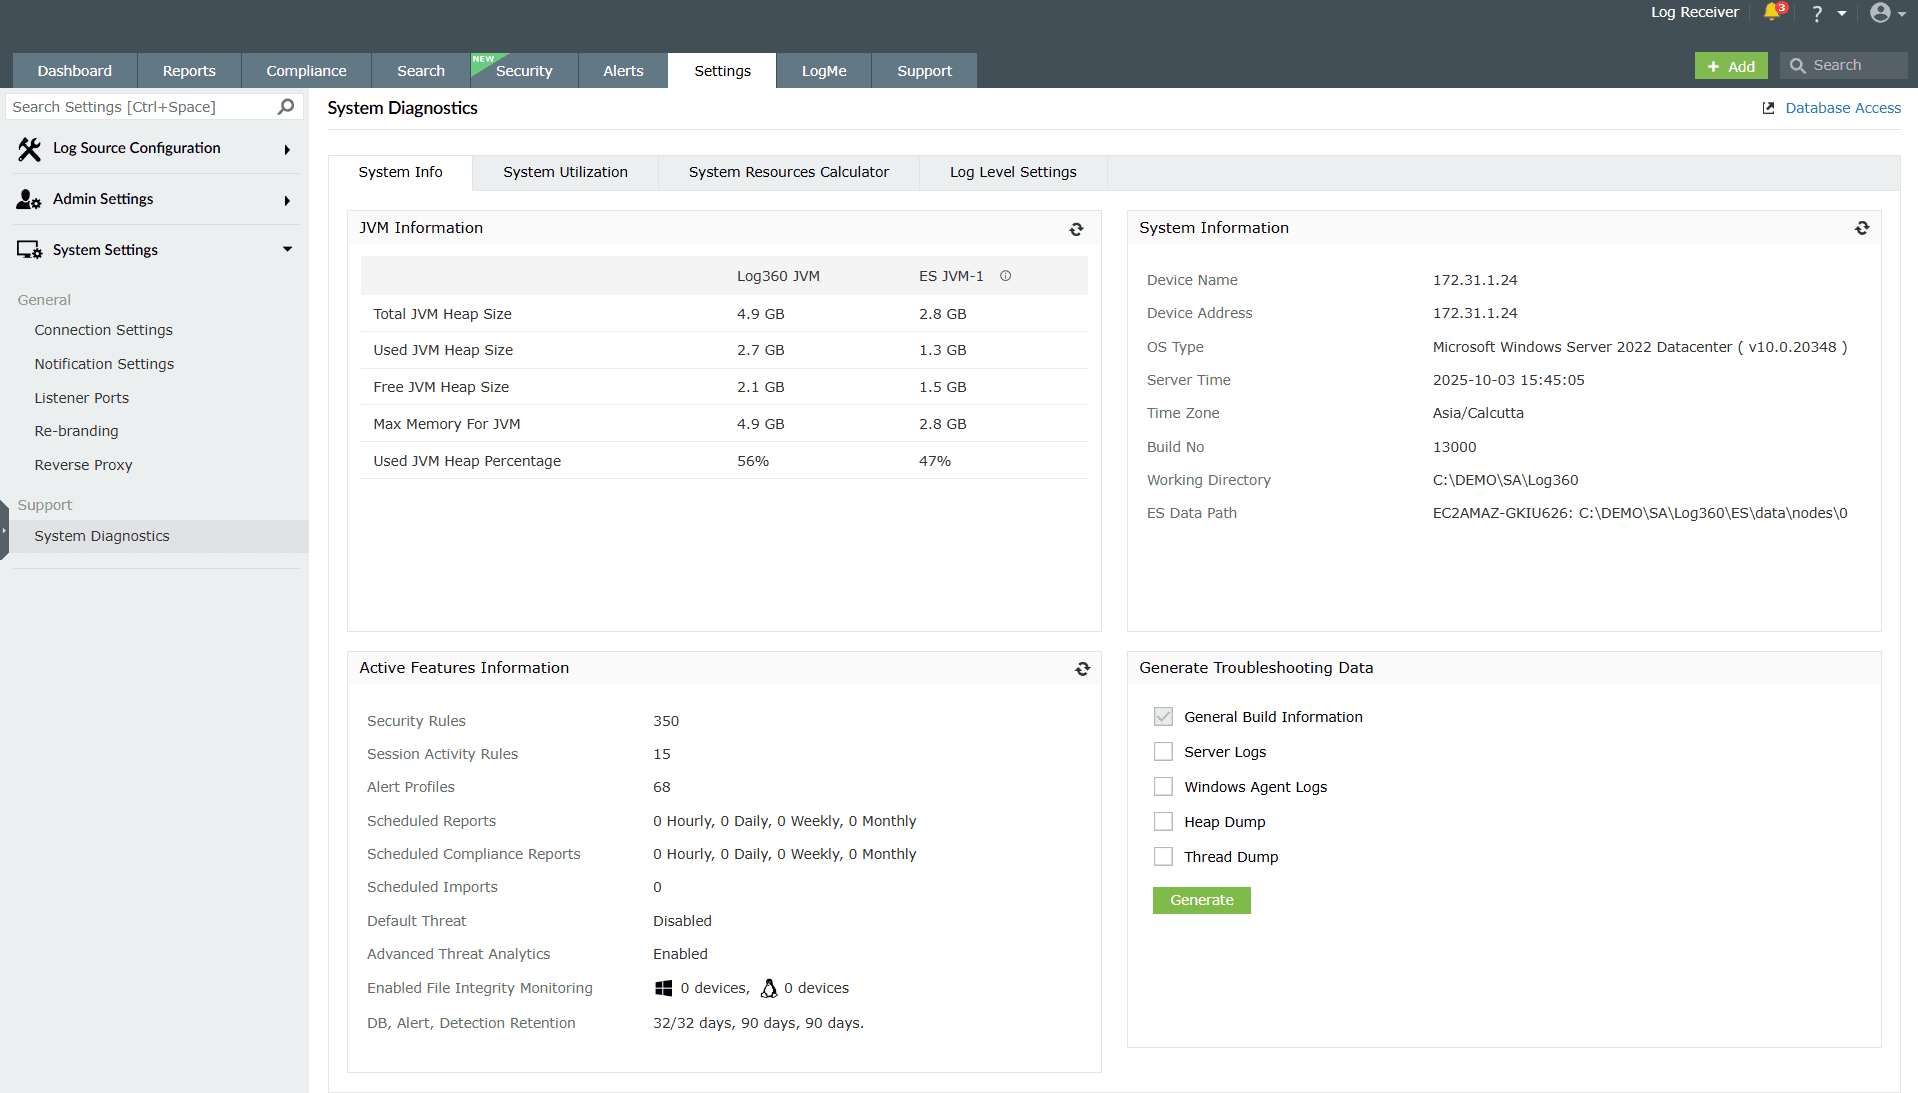
Image 1: System information tab in system diagnostics
JVM Information
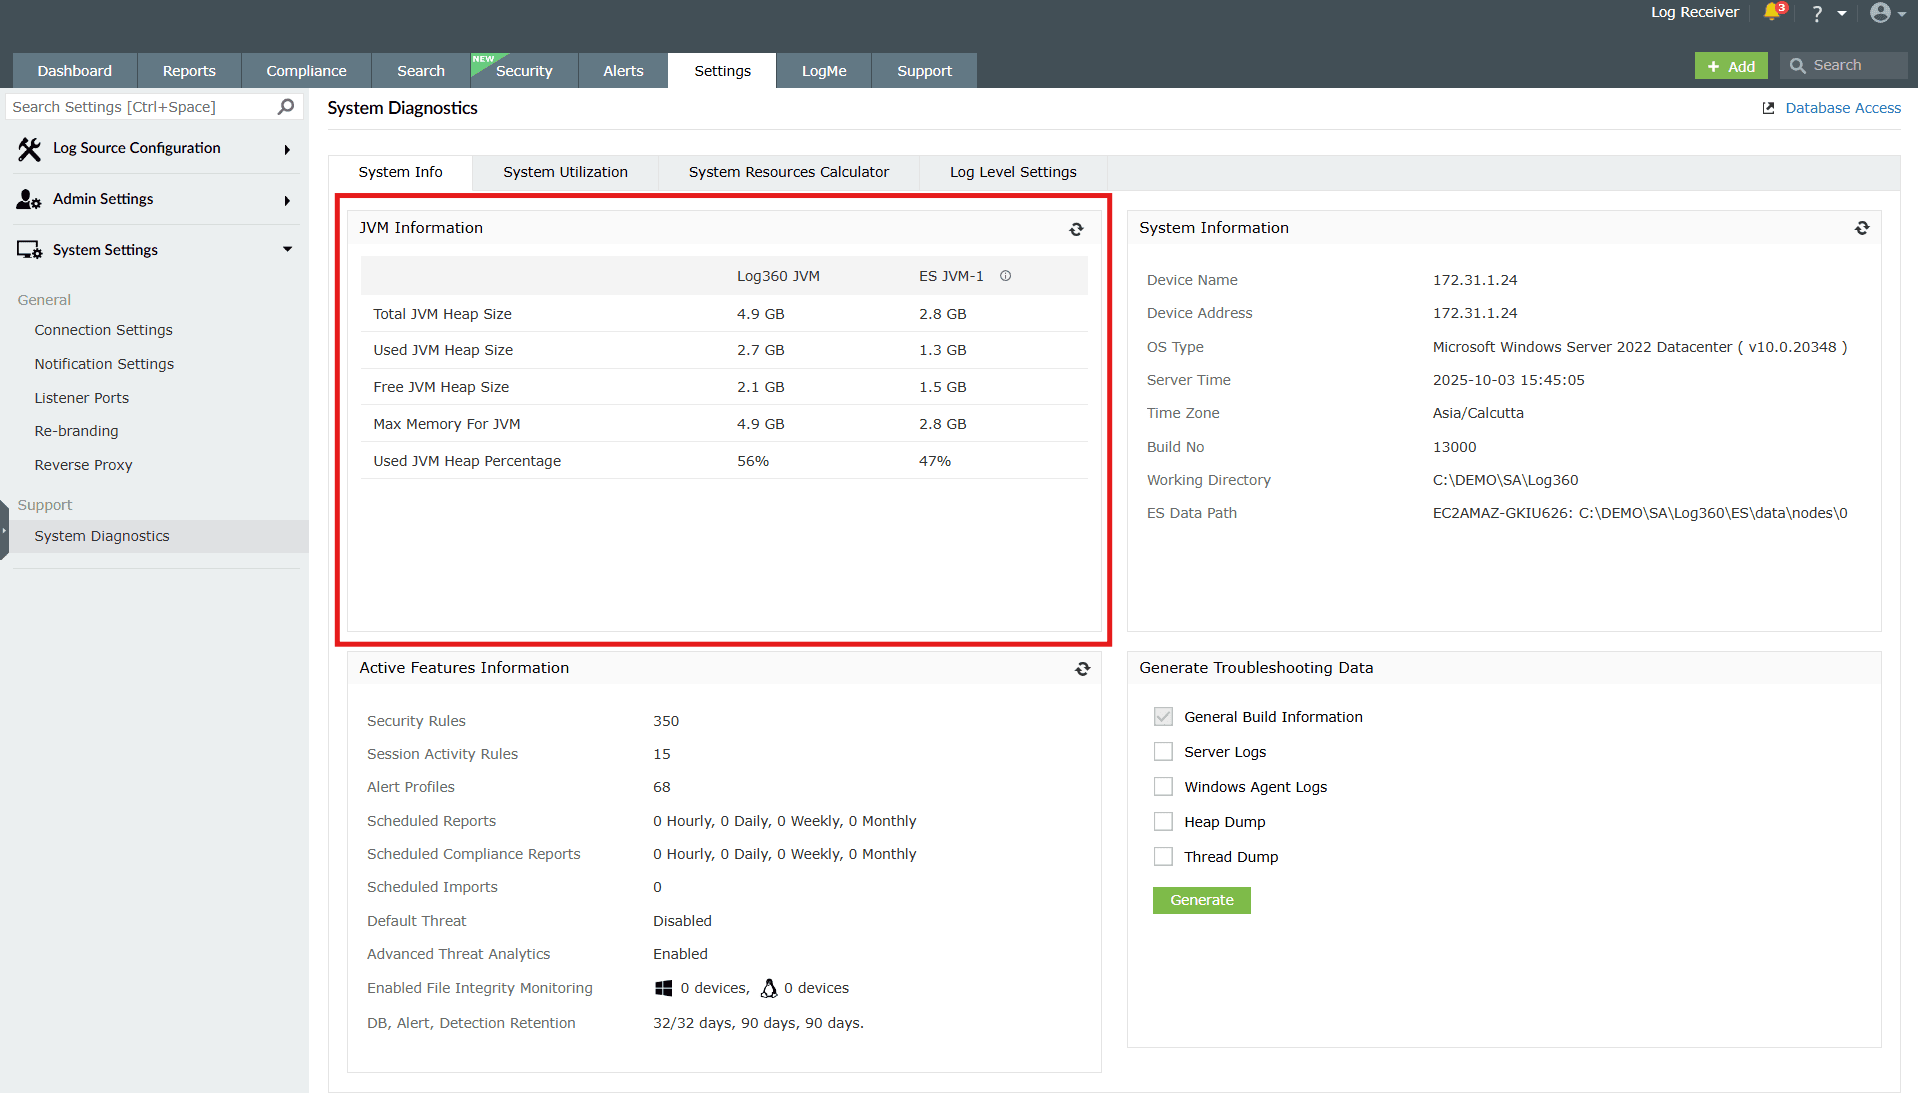
This section displays details about the Java Virtual Machine (JVM) used by the application. It shows the total heap size, memory in use, free memory available, and the percentage of memory consumed.
- What it means: JVM memory usage affects how smoothly the system runs.
- Why it matters: Monitoring heap usage helps you identify performance bottlenecks and avoid memory-related issues.
- What you can do: Use this information to tune memory allocation or investigate high JVM usage that may slow down processing.
System Information
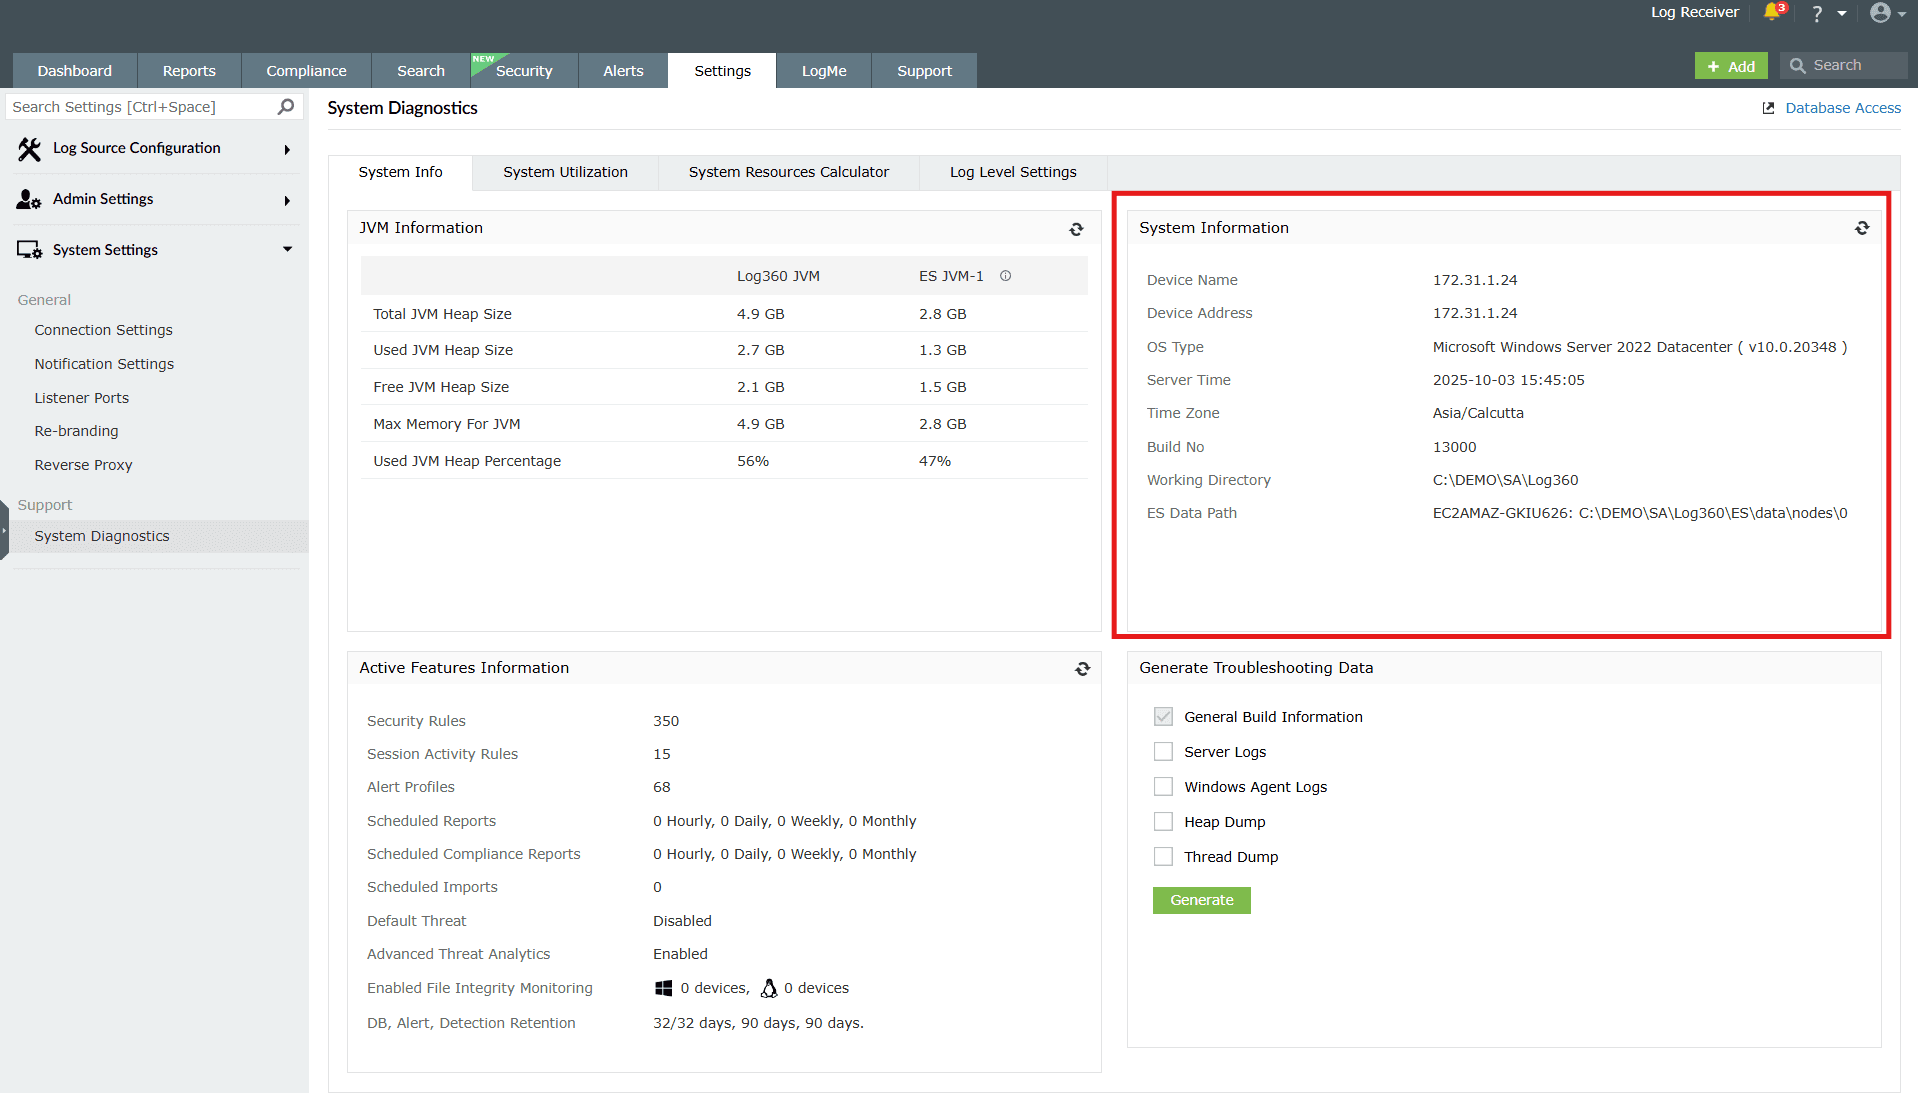
This section provides crucial system details about the host machine and environment like device name, OS type, and timezone details. It includes the device name, IP address, operating system, server time, build number, working directory, and data paths.
It also includes the product build number, product's working directory, and ES Data Path for comprehensive system insight.
- What it means: These details give you a quick snapshot of where the system is running and its current state.
- Why it matters: Helps you verify the environment, troubleshoot issues, and share accurate system information with support when needed.
- What you can do: Refer here whenever you need to confirm system versions, directories, or other environment settings.
Active Features Information
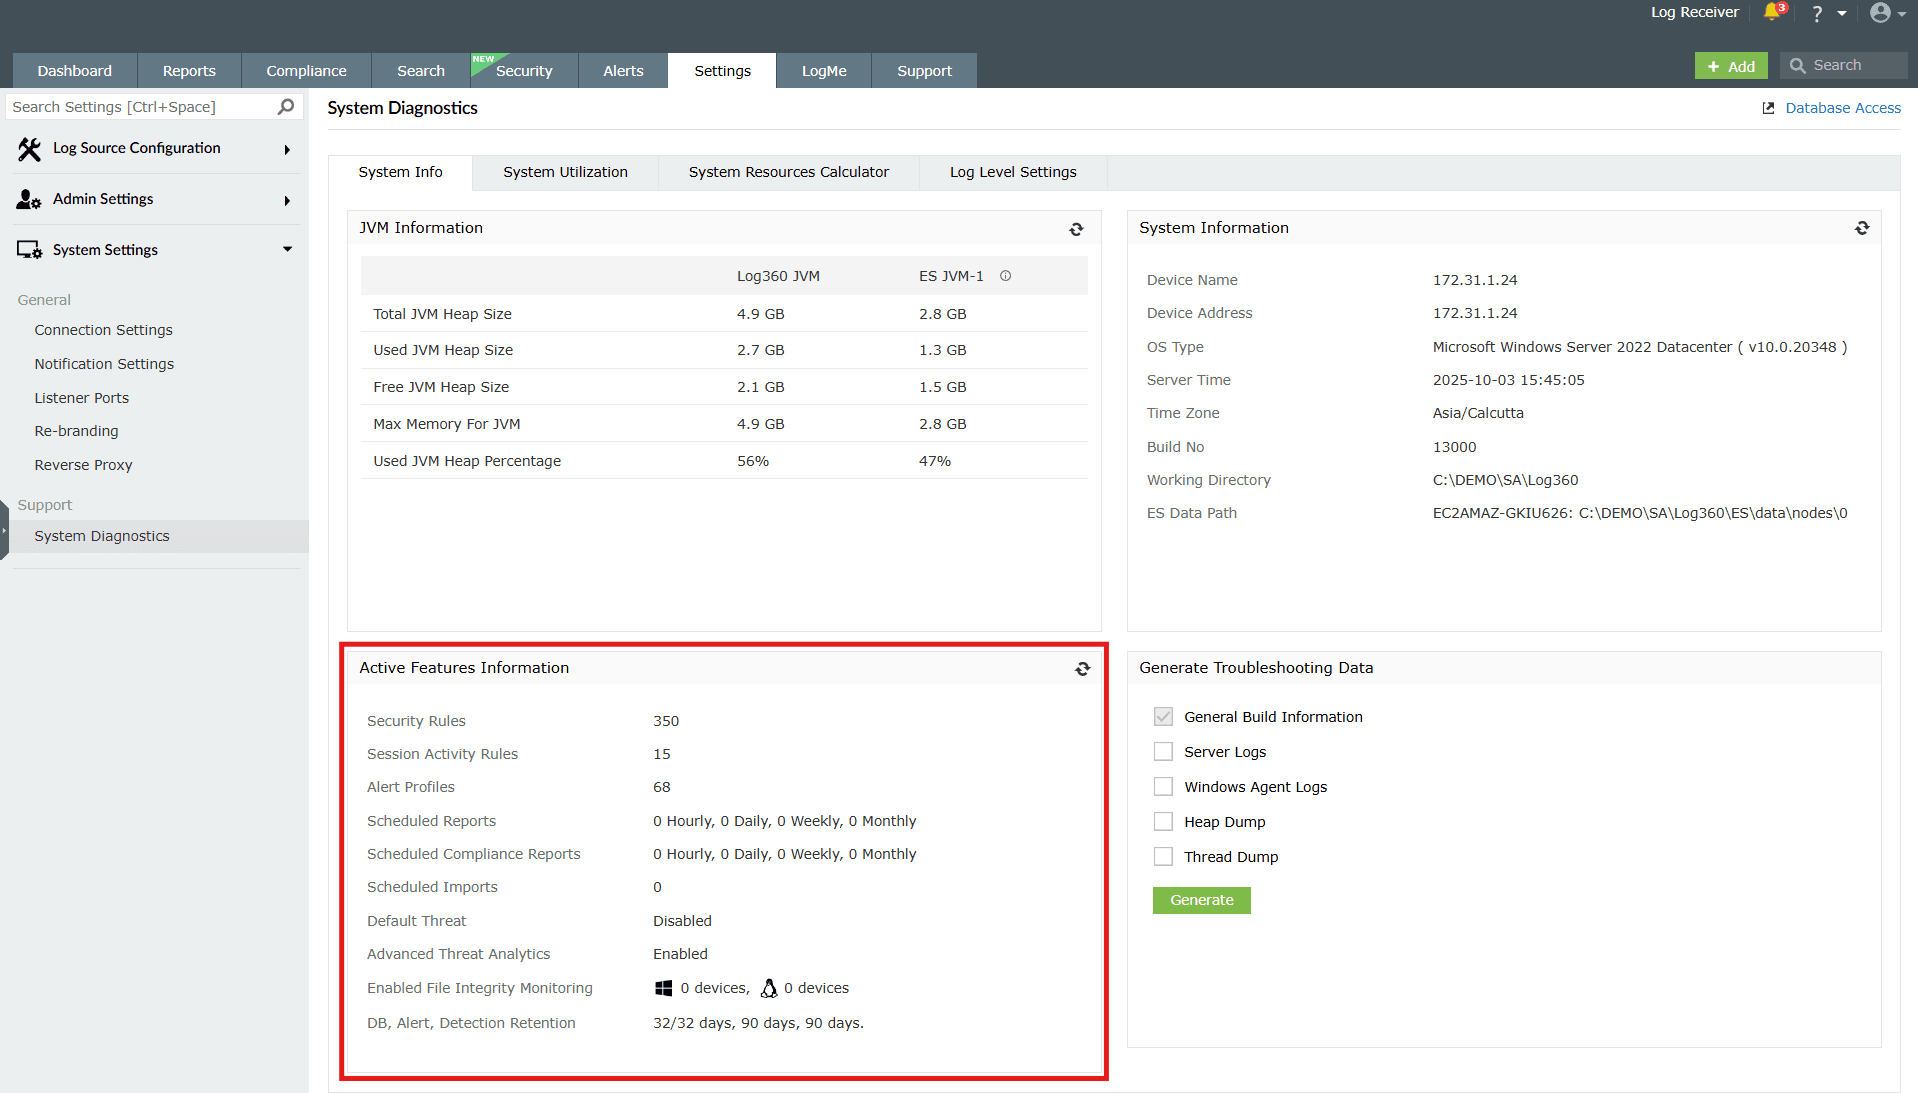
This section lists the number of active/enabled product configurations such as security rules, session activity rules, alert profiles, scheduled reports, compliance reports, imports, and advanced modules, providing a concise overview of operational settings.
- What it means: It’s a summary of all active configurations and enabled modules.
- Why it matters: Lets you quickly see what’s enabled, how many rules are active, and whether important features like threat analytics or file integrity monitoring are in use.
- What you can do: Use this to track whether all required features are active and to plan tuning or scaling when usage grows.
Generate Troubleshooting Information
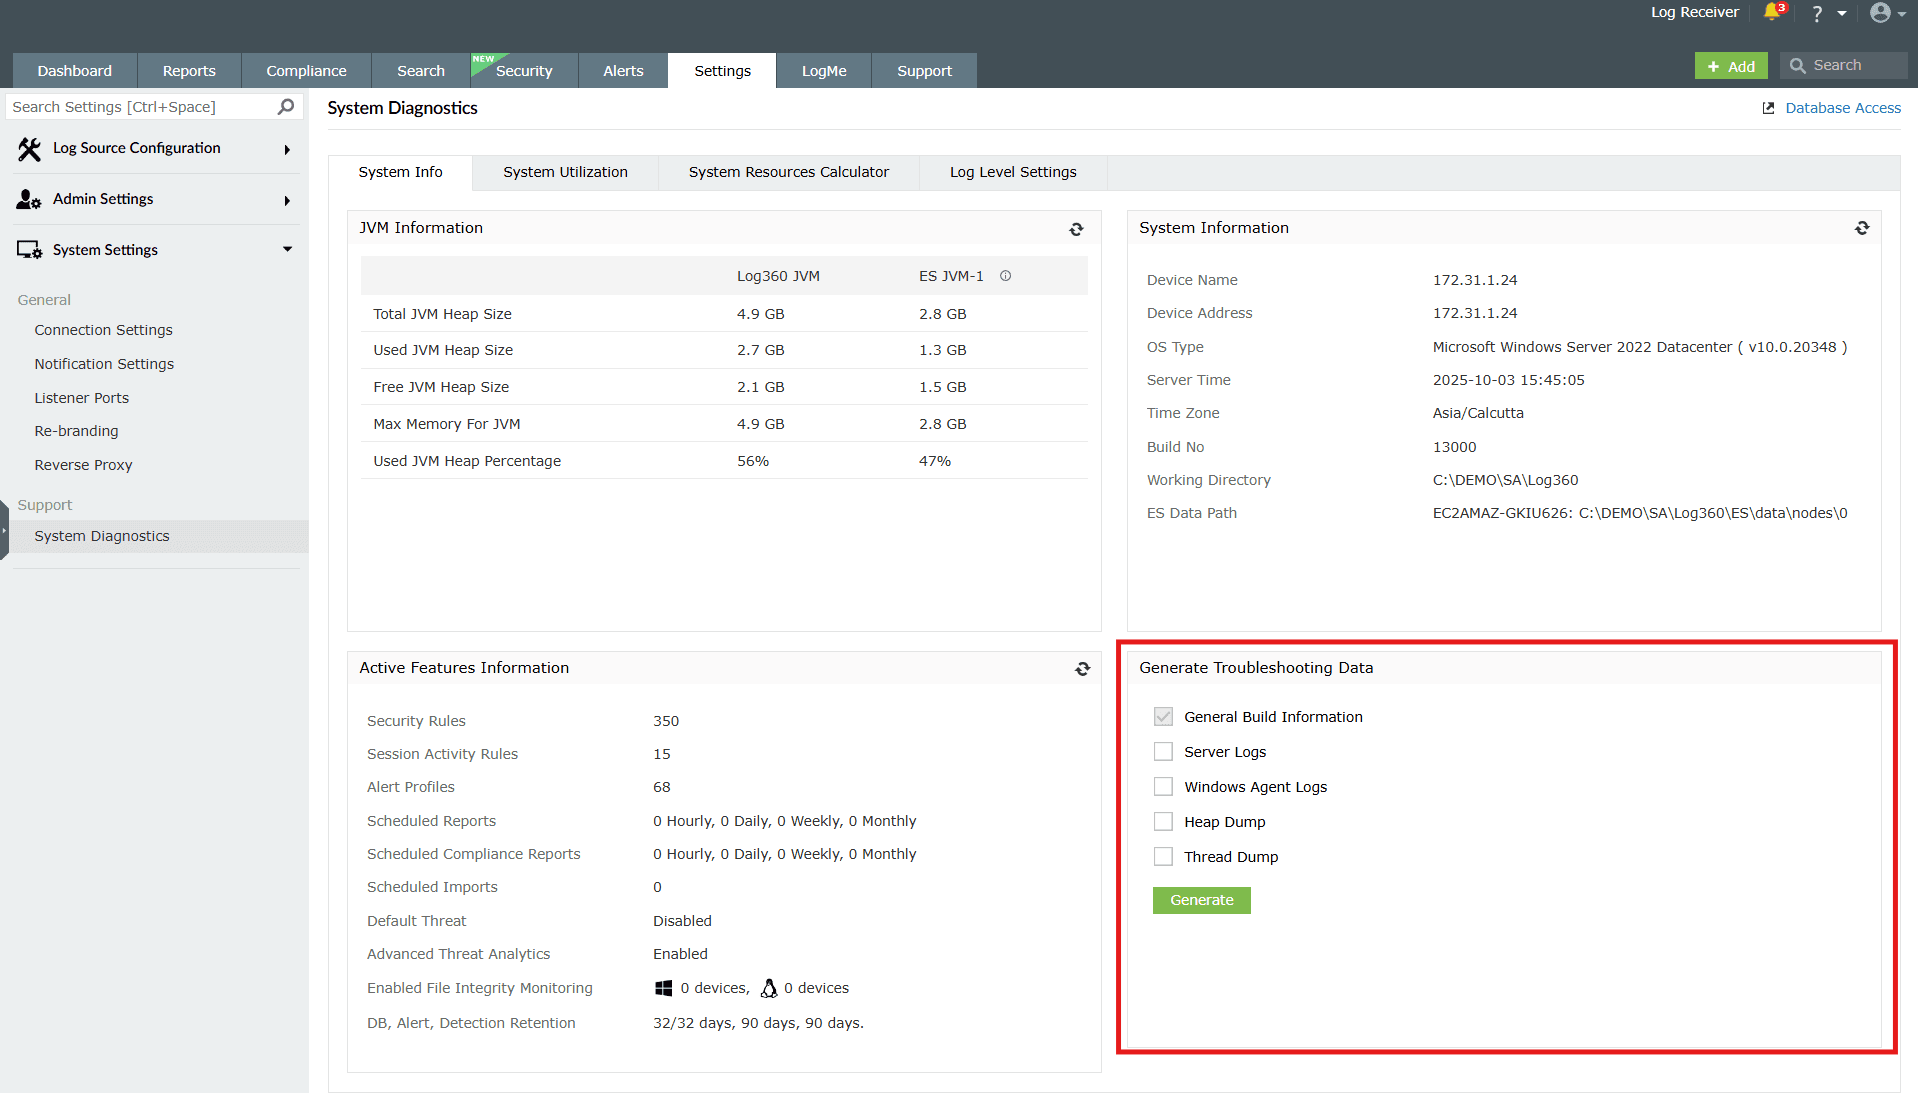
This section allows you to create diagnostic data bundles for analysis and also to select, compress, and upload logs for analysis by the support team. You can include general build information, server logs, agent logs, heap dumps, or thread dumps.
- What it means: This is a self-service option to package data required for troubleshooting.
- Why it matters: It saves time during support interactions by letting you generate and share relevant logs directly.
- What you can do: Select the type of information you want to capture, click Generate, and share the file with support for faster issue resolution.
The logs include:
- General Build Information: A text file containing all details available on this page.
- Server Logs: Including EventLog Analyzer/Log360 and ES logs.
- Windows Agent Logs: Agents logs can be collected, requiring credentials for installed agents. For manually installed agents, logs should be collected manually.
- Heap Dump
- Thread Dump
How to collect agent logs manually?
- Log into the agent-installed machine.
- Navigate to the installation folder of the agent (e.g., C:\Program Files (x86)\ EventLogAnalyzer_Agent ). This is applicable to both Log360 and EventLog Analyzer.
- Locate the logs folder.
- Collect the logs.
- Upload the logs to https://bonitas.zohocorp.com/.
Automated upload process:
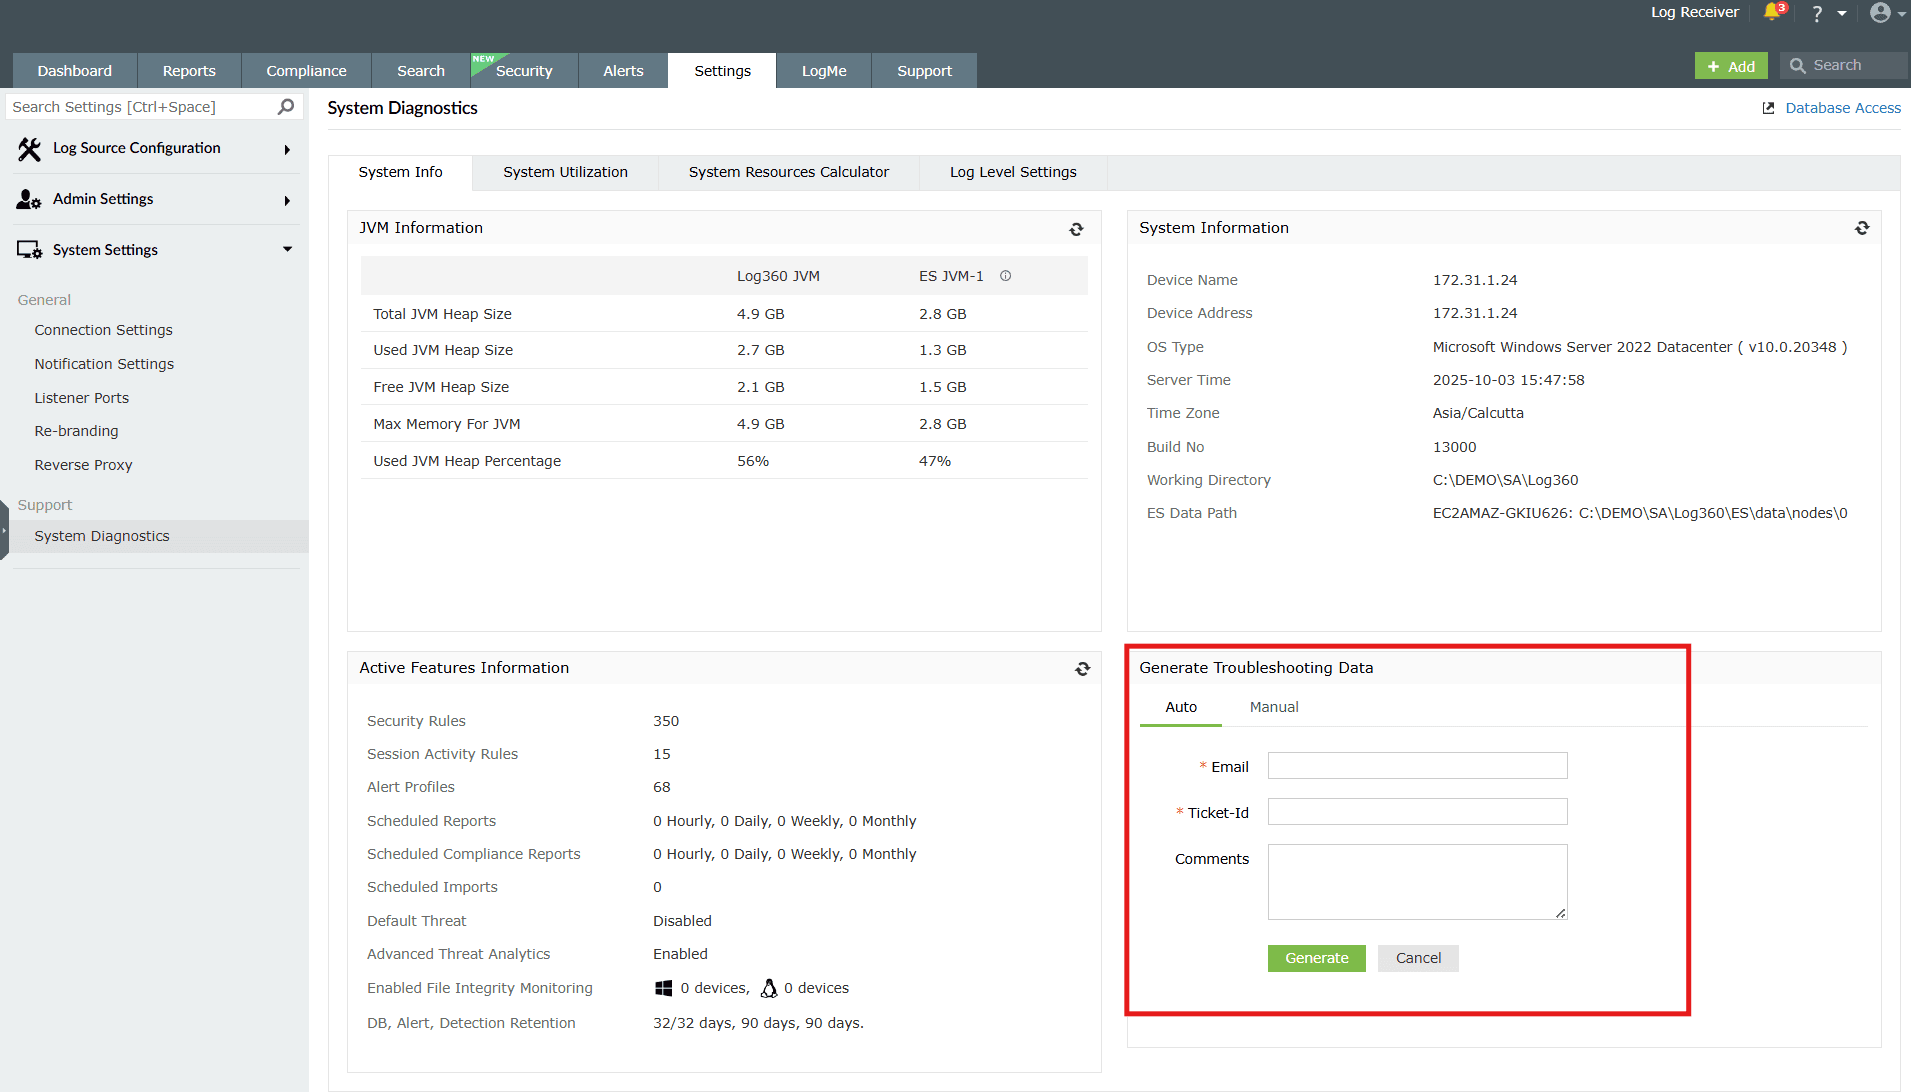
- Utilize the Auto option to compress and upload logs directly to the support server.
- Provide the necessary details, such as Email and Ticket-id and click on Generate.
- Upon uploading, an acknowledgment mail will be sent.
Manual upload process:
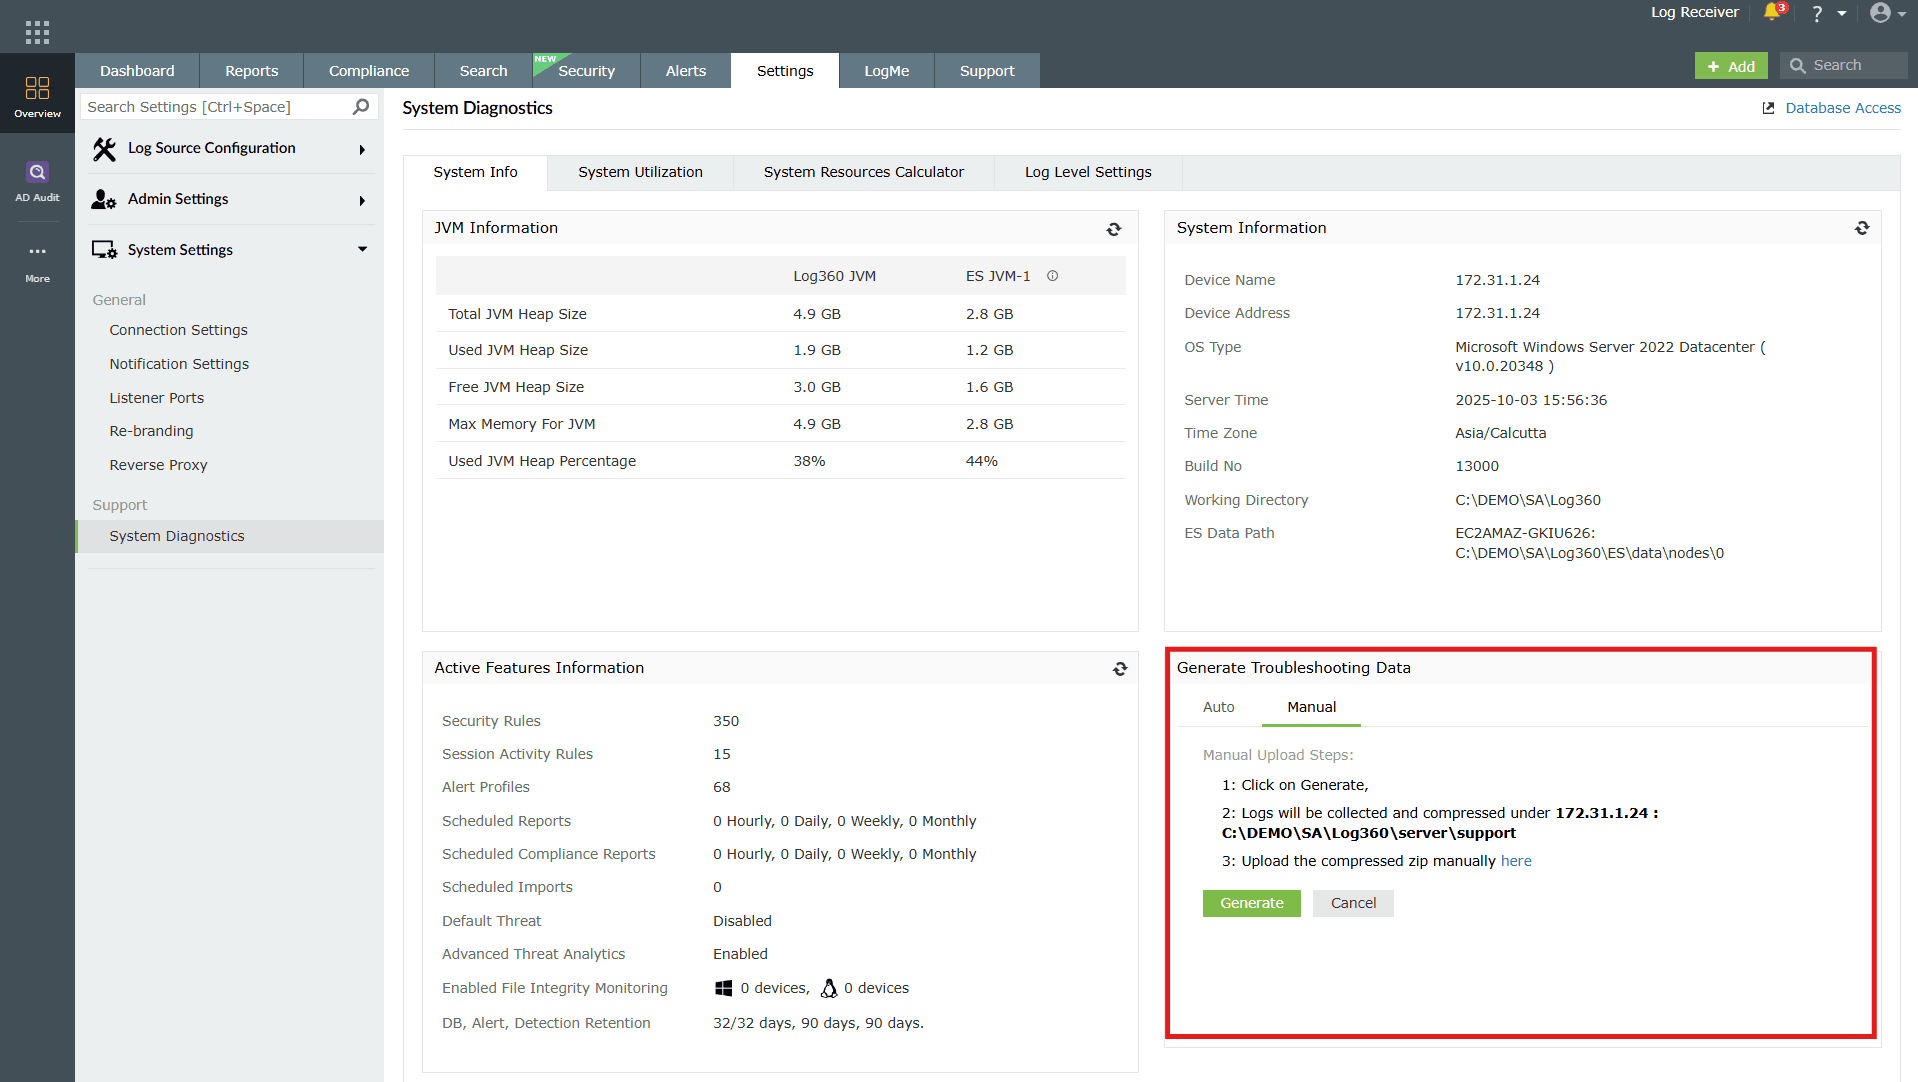
- Alternatively, compress the logs manually.
- Choose the Manual option for upload.
- Click on the Generate button to proceed with the manual upload to the server.
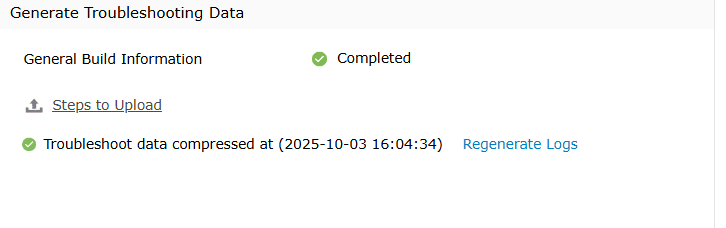
- Once the process finishes you will see Completed as status and an option to Regenerate Logs if you wish to do so.
Read also
This page elaborated on system diagnostics and monitoring. You can continue exploring related areas such as database settings, backup and restore, and connection configurations to get a complete understanding of system management.