Adding a Custom CLI Monitor in OpManager
OpManager includes built-in CLI monitoring to track the health and performance of CLI-based devices in real-time. However, if the default monitors don't meet your requirements, you can create custom CLI monitors tailored to your specific needs. These custom monitors allow you to collect performance metrics based on CLI commands you define.
Manage CLI Monitors in OpManager using these three main actions:
Steps to Configure a Custom CLI Monitor
1. CLI Command Details
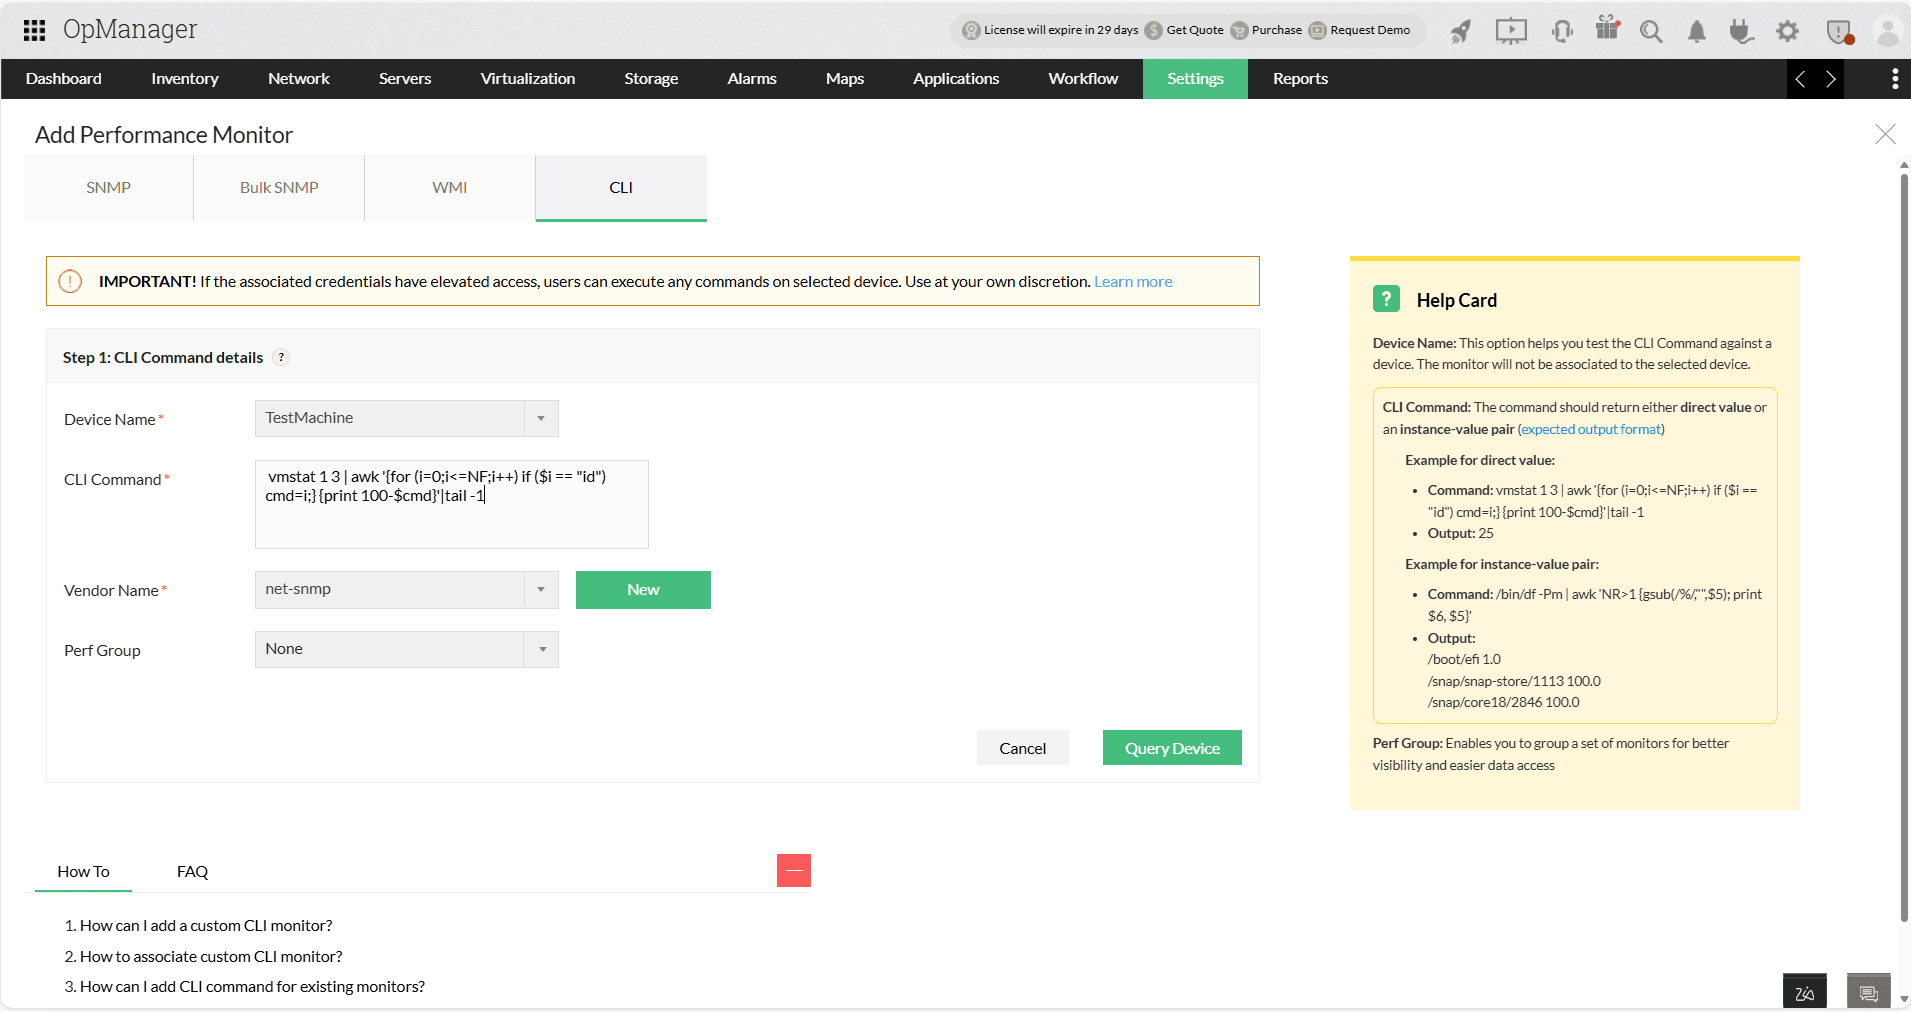
Start by entering the command and validating its output from a test device.
- Device Name: Choose a device to test the CLI command against. This selection is only for testing and does not associate the monitor with the device.
- CLI Command: Enter the CLI command you want to use.
- Vendor Name: Select a vendor from the dropdown list or create a new one by clicking New → Enter Vendor Name → Add.
- Perf Group: Group similar monitors for improved organization and accessibility.
- Use the Query Device option to verify the command's response format. If the output isn’t as expected, use the CLI Query Tool to adjust the command.

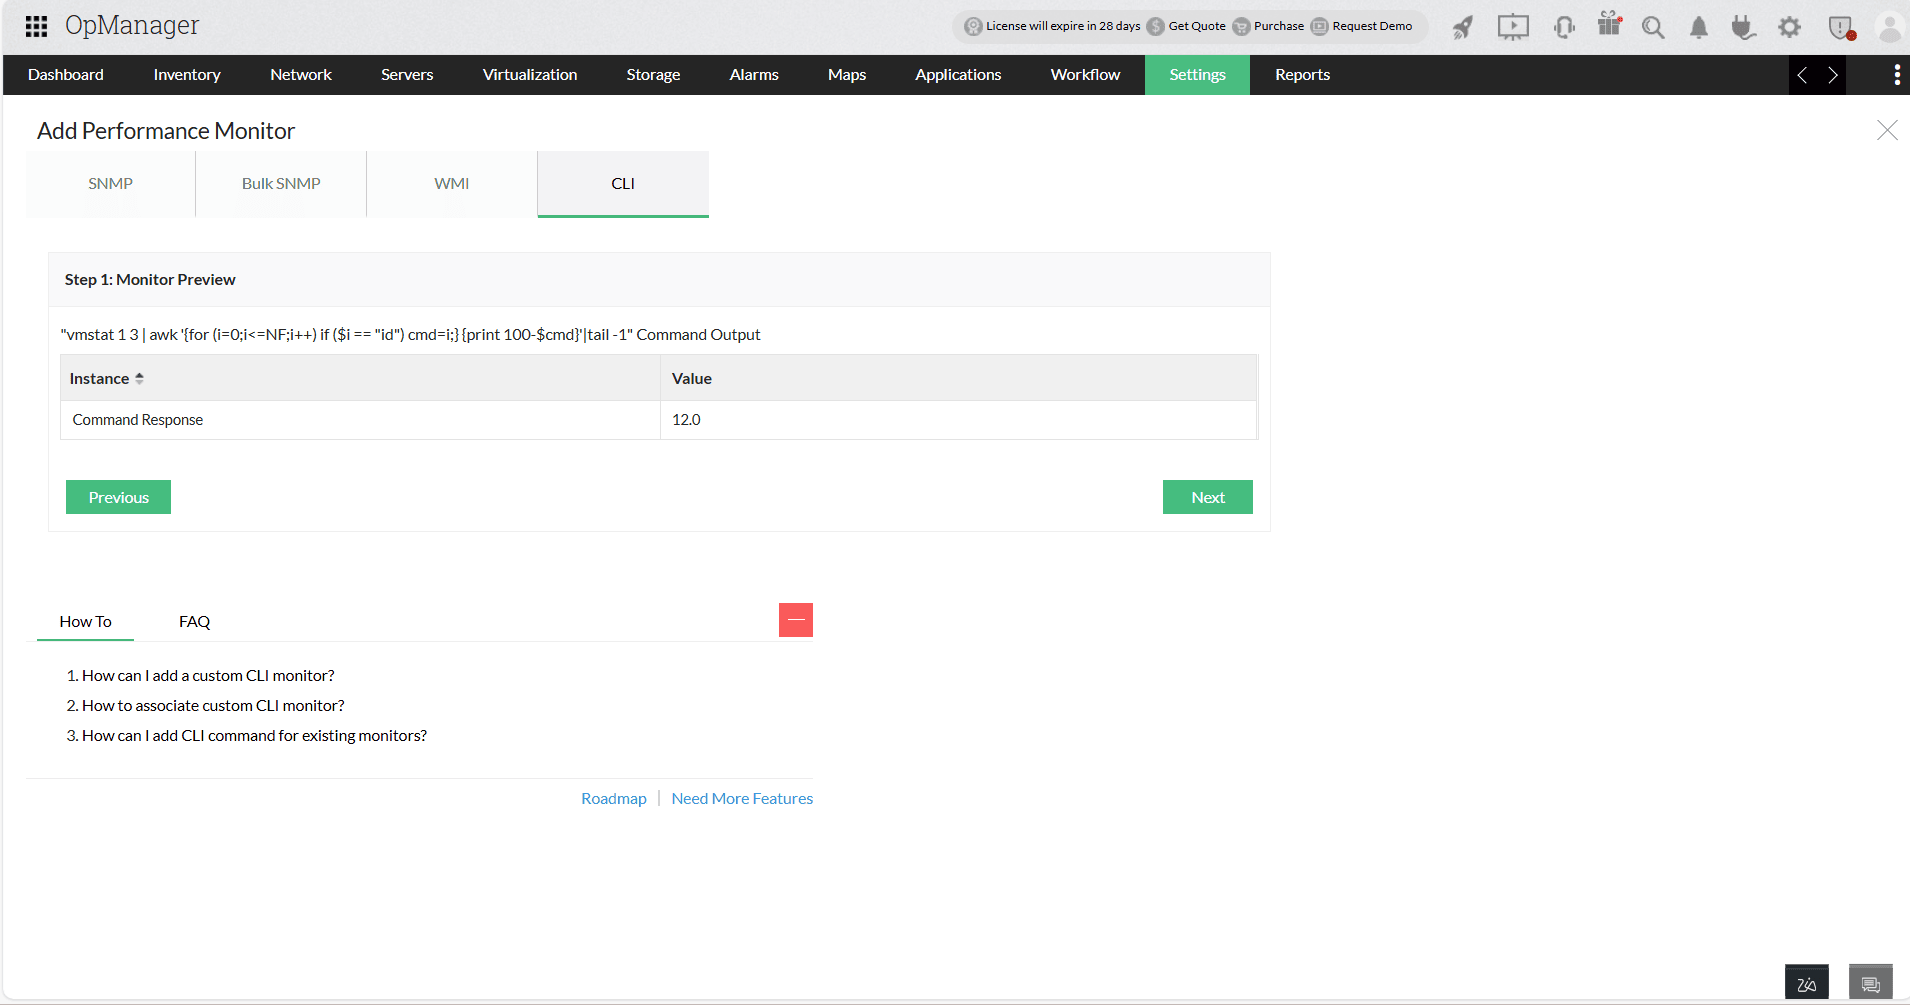
Monitor Preview
Once the command is executed successfully, the response will be displayed in a tabular format with instance names and values.

2. Monitor Details
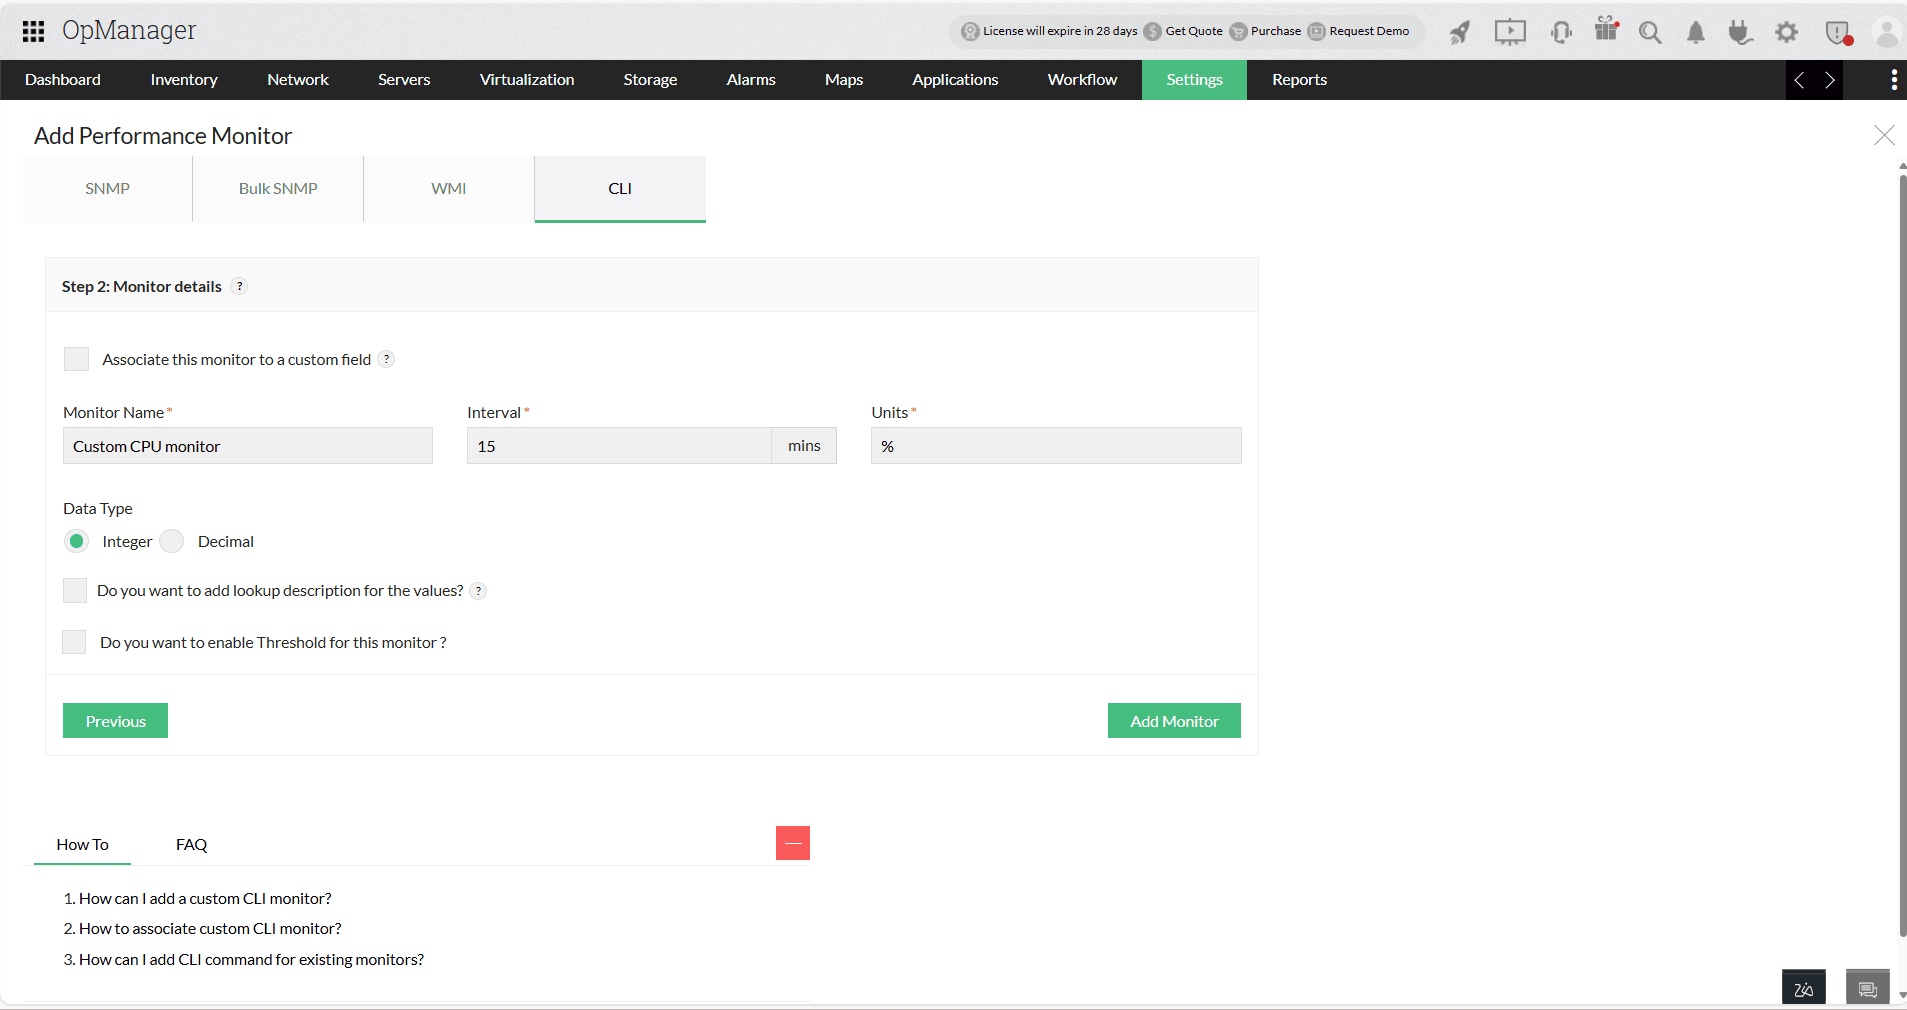
Provide configuration details for the monitor:
- Monitor Name: Specify a descriptive name for the monitor.
- Interval (Mins): Define how often (in minutes) the monitor should poll for values.
- Units: Specify the unit of measurement (e.g., %, ms, MB).
- Data Type: Select either Integer or Decimal based on the metric.

3.Optional Settings:
- Lookup Description: Map string values to integers for easier interpretation and database storage.
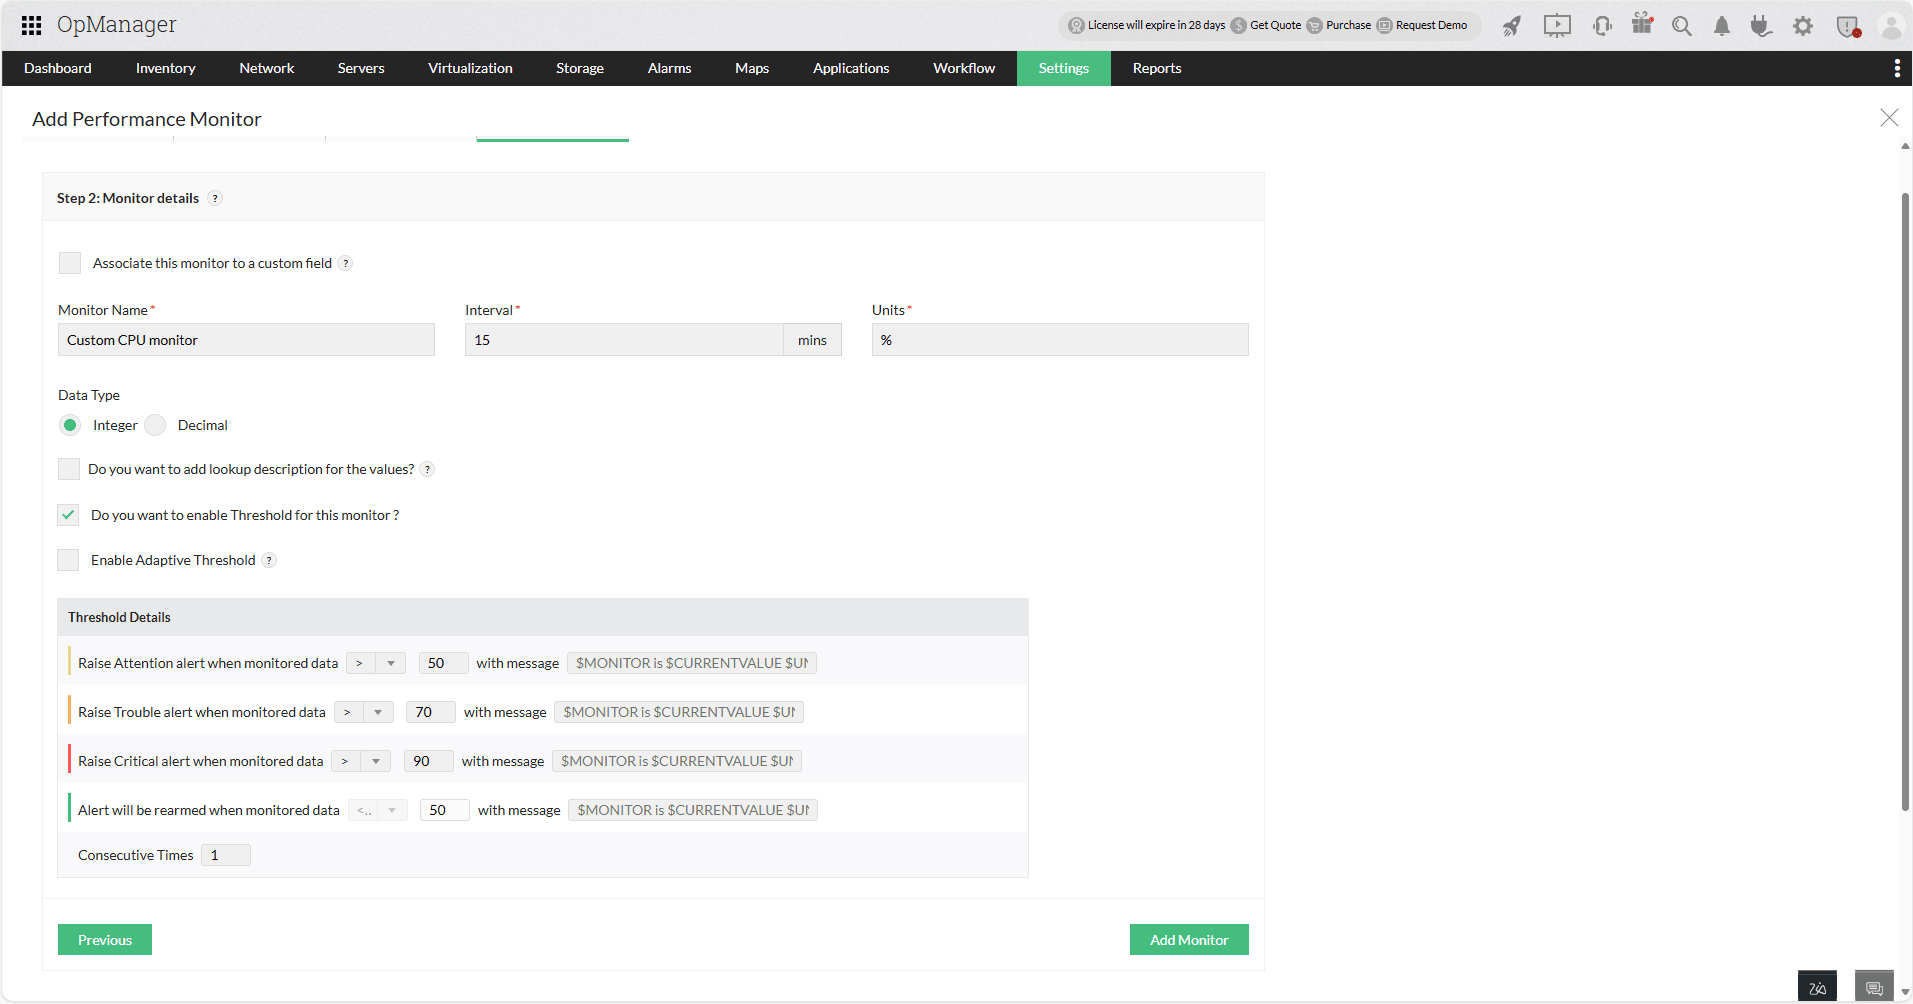
- Threshold Configuration:
- Enable alerts by setting threshold values for Attention, Trouble, and Critical.
- Choose a condition (
>, <, =, !=) and set the respective values.
- Rearm Value: Set a value that resets the alert state when the metric returns to normal. This value should logically complement the threshold (e.g., be less than or greater depending on the condition).
- Consecutive Times: Define how many consecutive threshold breaches must occur before an alert is triggered.

Click Add Monitor to complete setup.
Note:
When a monitor is created via Settings → Monitoring → Performance Monitors, it is saved as a reusable template.
When created from the Device Snapshot page, it will be saved as a template, but it will additionally be automatically linked to that specific device.
Ways to Add a Custom CLI Monitor
You can add your custom CLI monitor from the following locations:
- Settings → Monitoring → Performance Monitors → Add Monitor
- Device Snapshot Page → Monitors → Performance Monitors → Actions → Add CLI Monitor
- Settings → Configuration → Device Templates
- Select a CLI-based template
- Under Associated Monitors, click Add → Choose CLI from the category list
Supported Device Templates
Custom CLI monitors can be added to the following device templates:
Linux, Solaris, HP-UX, IBM AIX, Linux FreeBSD, Mac OS, Ubuntu, Debian, Fedora, Red Hat Enterprise Linux, CentOS, openSUSE, Arch Linux, Linux Mint, Manjaro, Kali Linux
Additionally, If the template contains any CLI-based device identifiers, then you can add custom CLI monitors to those device templates. Learn how to add CLI device identifiers.
Thank you for your feedback!
