End User Monitoring in OpManager aims at visualizing the entire bandwidth data of every user in your network. This helps to respond quickly to any performance issues or wireless network congestions that might otherwise affect the quality of user experience.
OpManager correlates the data obtained through Firewall Analyzer add ons, to provide detailed insights on the user's bandwidth consumption, top accessed sites and Applications and the location of the user.
To enable end user monitoring, the device details/IP addresses are imported from the Active Directory
To import Users via Active directory,
Note: The device details can also be added manually. Click here to know how to change the user password
To configure manually,
Once the import is done, the details can be viewed under the People tab of the End User Monitoring module.
The user snapshot lists user details. It contains
To identify the bandwidth consumed or to identify top accessed Applications and URLs, or firewall logs have to be enabled in OpManager.
OpManager helps to identify the users connected to your network. It also lists the number of devices, recently connected users and the top 3 Access points.
These user connections can be monitored by fetching details from a wireless controller device(WLC)
To add a WLC device,
Note: OpManager supports Aruba wireless LAN controller at present. More models will be included with further releases.
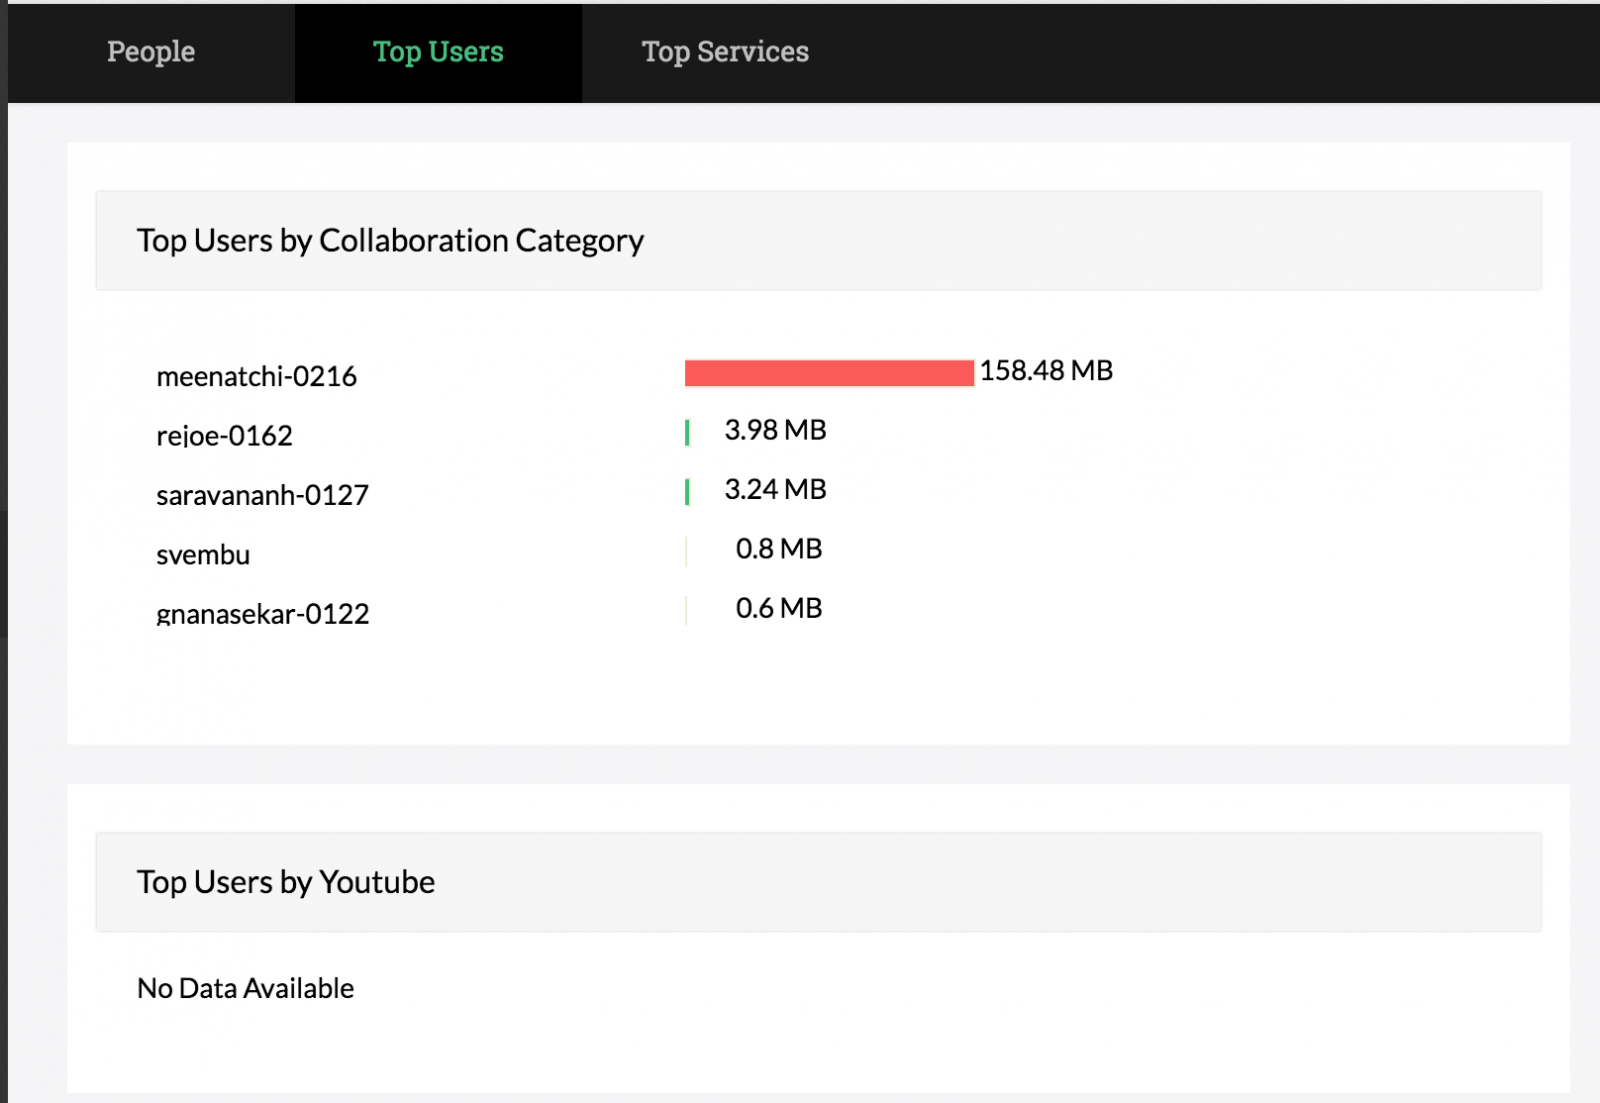
OpManager allows to identify the top users of every application. It lists the amount of data used by the top users of various Applications.
OpManager currently includes around 100 Applications to identify the top user of every application. More Applications would be added in further releases.

OpManager allows you to identify top services category wise. It lists the total data used by top Applications.
OpManager includes 25 categories, that helps in listing the top data consuming Applications in the required categories.
Thank you for your feedback!