Choosing the right PostgreSQL monitoring tool
Category: Database
Published on: Nov 24, 2025
6 minutes
PostgreSQL is a powerful database, but keeping it fast and reliable requires the right monitoring approach. As applications grow, queries become more complex, data volume increases, and workloads shift throughout the day. Without a good monitoring tool, teams often spend more time reacting to issues than preventing them.
Choosing the right PostgreSQL monitoring tool is not about picking the most feature packed platform. It is about selecting a solution that helps you understand what is happening inside your database, why it is happening and how to respond with confidence.

Why choosing the right tool matters
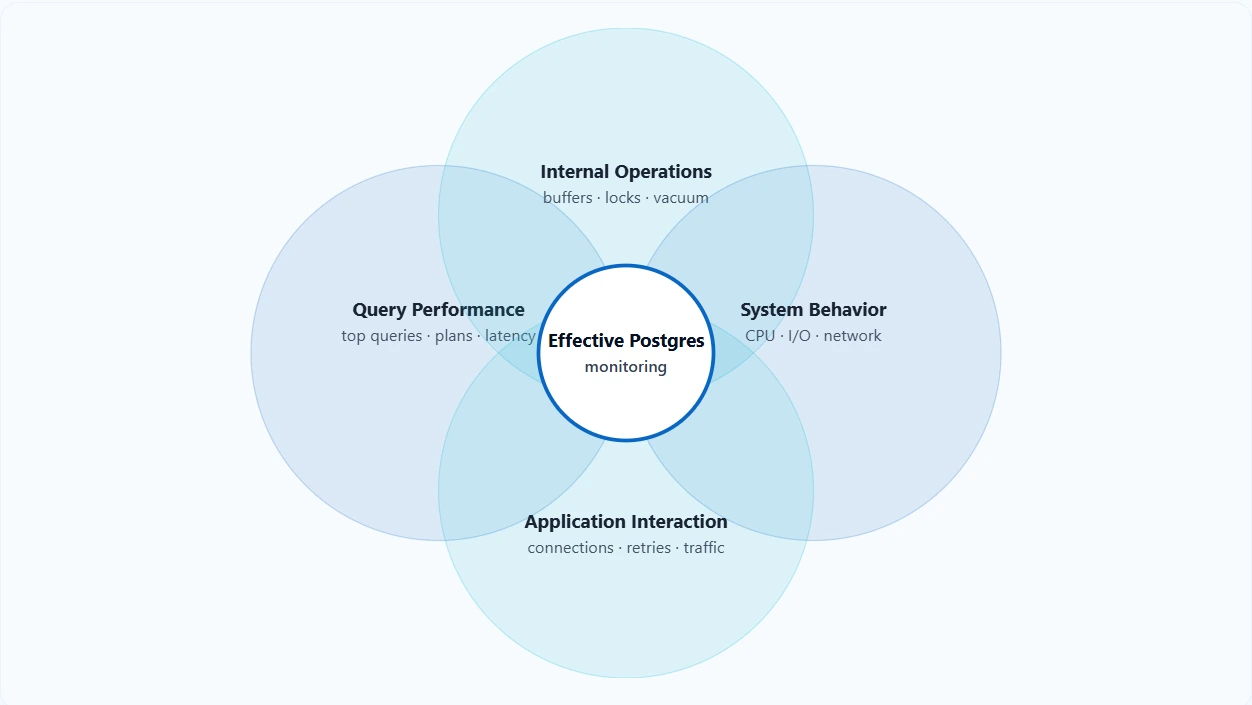
There are many tools that collect metrics from PostgreSQL, but effective monitoring requires more than numbers on a dashboard. You need visibility into query performance, internal database processes, resource usage patterns and the way your application interacts with the database. If the tool cannot bring these elements together, you will often see symptoms without understanding the cause.
A strong PostgreSQL monitoring solution should help you:
- Detect performance changes early
- Identify slow queries and the relationships behind them
- Understand how database activity aligns with system performance
- Track internal operations like vacuum, checkpoints and replication
- Reduce time spent troubleshooting through clear diagnostics
With these elements in place, teams can maintain stability even as their PostgreSQL environment changes.
Key capabilities to look for in a PostgreSQL monitoring tool
Below are the most important capabilities any PostgreSQL monitoring tool should provide, along with how Applications Manager addresses them.
1. Visibility into queries and session activity
Query performance is one of the most important indicators of database health. A monitoring tool should make it easy to see which queries consume the most resources, how execution time trends evolve and which sessions are contributing to activity.
What Applications Manager provides
Applications Manager offers visibility into long running queries, top queries by CPU and execution time history. You can quickly identify slow operations and understand how they relate to ongoing sessions. This makes troubleshooting faster and gives teams a clearer view of how the workload behaves from moment to moment.
2. Metrics that capture internal PostgreSQL behavior
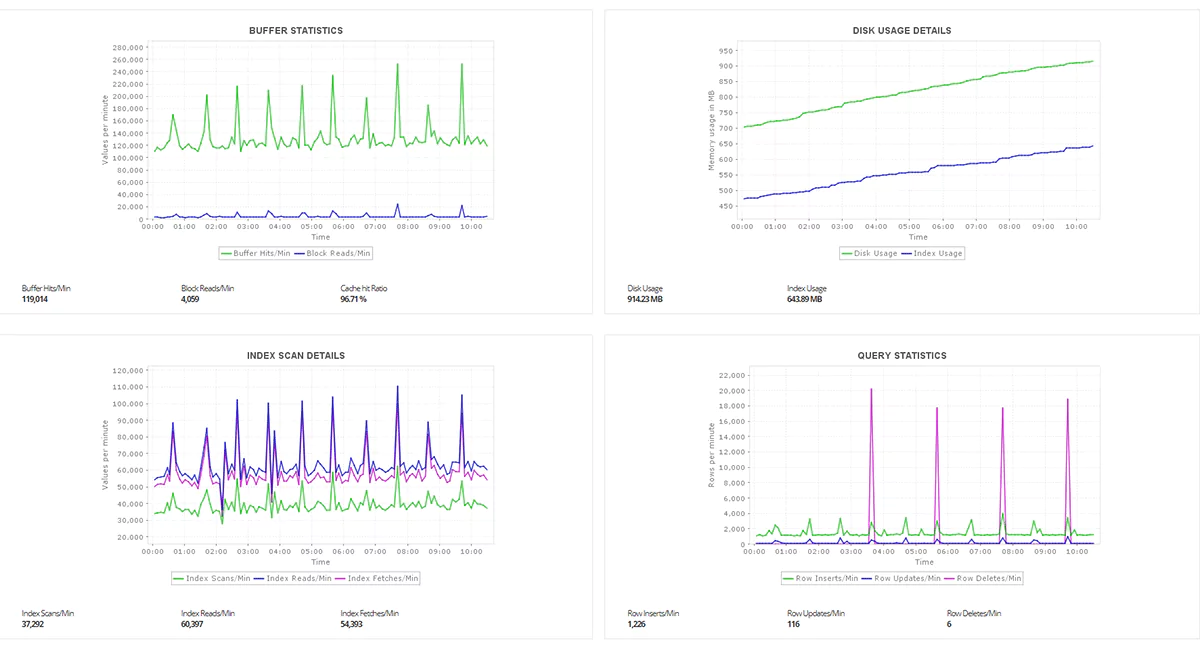
PostgreSQL performance depends heavily on operations that are not immediately obvious from the outside. Buffer reads, index scans, lock waits, transactions per second and dead tuples all influence performance and reliability.
What Applications Manager provides
Applications Manager monitors key PostgreSQL internal metrics, including:
- buffer hit ratio
- table and index scan patterns
- lock statistics
- tuple reads and tuple writes
- days since last vacuum
- dead tuples
- connection statistics
- WAL and checkpoint related activity
These metrics help surface performance issues that may not be visible at the query layer alone. By tracking them consistently, teams can detect problems such as index inefficiency, vacuum lag or excessive locking before they escalate.

3. Clear correlation between database and system performance
Database issues often appear when something outside the database changes. Storage latency, memory pressure, spikes in CPU usage or increased application traffic can all affect PostgreSQL behavior. Without seeing these factors together, troubleshooting becomes time consuming.
What Applications Manager provides
Because Applications Manager is a full stack monitoring solution, it correlates PostgreSQL performance with server level metrics. You can view CPU, memory, disk and network activity alongside query performance and database activity. This makes it easier to understand whether a slowdown originated in PostgreSQL or in the underlying infrastructure.
4. Reliable and meaningful alerting
An effective monitoring tool should alert only when something important changes. Alerts that trigger too often train teams to ignore them, while alerts that trigger too late leave you scrambling during incidents.
What Applications Manager provides
Applications Manager supports threshold based alerting for all PostgreSQL performance metrics. You can set thresholds that reflect your environment and prevent unnecessary noise. It also supports notifications through email, SMS, Slack and other channels, helping you stay informed in a way that fits your workflow.
5. Easy to set up and manage across environments
Most organizations run PostgreSQL across mixed environments, including virtual machines, cloud platforms, containers and physical servers. A monitoring tool should be easy to deploy at scale without complex configuration.
What Applications Manager provides
Applications Manager offers straightforward onboarding. You can add a PostgreSQL monitor by specifying the host, port and authentication details. Once configured, the tool automatically begins tracking performance metrics and generating insights. It supports monitoring across on premises and cloud environments, making it suitable for growing teams.
6. Historical data and trend insights
Performance issues are easier to diagnose when you have access to long term data. A monitoring tool should help teams track changes in behavior over time, such as gradual query slowdowns, rising lock contention or increasing resource consumption.
What Applications Manager provides
Applications Manager retains performance data over time and presents it in easy to interpret charts. This allows you to identify patterns, plan capacity and spot early signs of drift. Long term insights also help teams measure the impact of schema changes, application updates or infrastructure modifications.
How to choose the right PostgreSQL monitoring solution for your environment
The best tool for your team will depend on your goals, your environment and your workload. Here are a few practical steps you can use to evaluate any tool you are considering.
1. Test with a real workload
If possible, run the tool against a staging environment that mirrors your production workload. Look for:
- Whether slow queries are easy to identify
- Whether session behavior is clearly visible
- Whether internal metrics such as locks and buffers are easy to understand
2. Compare peak and normal usage
A good tool should let you see how performance changes during peak traffic. If everything looks identical during both workloads, the tool may not be capturing the right level of signal.
3. Evaluate alert usefulness
Trigger a small test condition and check whether the alert includes meaningful details. Good alerts tell you what happened and what you should investigate next.
4. Check how simple it is to set up
If onboarding requires complex steps or extensive configuration, it may slow down adoption. A clean setup experience is important for smooth rollout.
Choosing a tool that supports your team, not just your database
Selecting the right PostgreSQL monitoring solution is ultimately about empowering the people who keep your systems running. A good tool should simplify troubleshooting, highlight meaningful patterns and reduce the time spent interpreting raw data. It should make performance issues easier to anticipate, not harder to decode.
When your monitoring tool provides clear visibility into queries, internal database behavior and system performance, your team gains the confidence to act quickly and accurately. Applications Manager offers this balance by giving teams a practical way to monitor PostgreSQL across environments, understand performance changes and maintain stability as workloads grow. Explore now by downloading a 30-day, free-trial now!

