Anomaly Detection
Overview
Anomaly detection helps you know if there is gradual performance degradation by defining Anomaly Profiles on performance metrics. By creating Anomaly profiles, you can define rules wherein the current data is compared with previously reported best data.
For eg., if the load on the server increases over a period of time, response time will gradually be affected. By using Anomaly detection, you would be able to detect this performance problem.
How does Anomaly Detection Work?
Anomaly profiles can be created based on:
Anomaly Dashboard: This dashboard facilitates viewing through all the performance metrics and helps in easy troubleshooting.
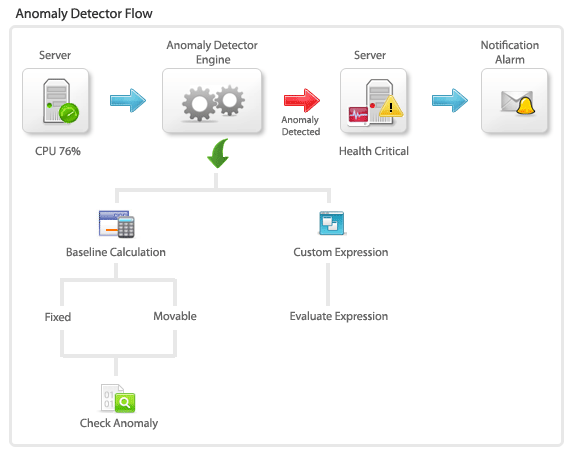
Baseline Values
Anomaly happens when the current set of values don't conform to the baseline range values. Current Attribute values are compared against the reported data in a particular week [baseline week].
- Define baseline- Baseline week can be calculated based on
- Fixed Value: The week where the system has performed very well [there has been less number of alarms] will be chosen as reference/ baseline data range. After choosing the week for baseline comparison, then each day's value will be compared with the corresponding day of the baseline week. For eg. If you choose week 1 of August as baseline week, then every Monday's data will be compared with August week1's Monday values. Another usecase can be for festive time load. Anomaly profiles can be created for Christmas Holiday weekend and the performance metrics can be compared to know how effectively the system has performed.
- Moving Value: Instead of fixing a baseline week, Previous week's reported data can be selected for comparison. Here, the baseline value will be changing according to the previous week's data.
- Specify the anomaly criteria - Set the upper limit and lower limit range to compare the current data with the baseline values.
Baseline data range will be formed based on the upper limit and lower limit values .These values can be used as % or as hard coded values. Eg, if the baseline value is 70 and if you had provided 10% as criteria for both upper and lower limits then the base line range will be between 64 to 77. Likewise if you had provided the criteria as 10 then the range will be between 60 to 80. - Working- After comparing with the baseline data, if the current hour value does not come between the upper limit and lower limit configured, then alarms will be generated.
- Lets set Aug 1st week of 2009 as the baseline data range.
- Anomaly range is defined as 10% upper limit and 10% lower limit.
- The deviation is calculated based on hourly values. So at 11 A.M, Tuesday of the Second Week, the Memory Utilization value will be compared with the values present at 11 AM, Tuesday of the Ist week. If the value deviates from the upper limit or lower limit, then an alarm will be generated.
- After creating Anomaly profile, you have to associate the anomaly profile to the concerned attributes.
To create Anomaly Profile based on baseline values:
- Click on Anomaly Profile link. Click on New Profile
- In the Anomaly profile page, Give the Name for the new Anomaly profile you want to create.
- For baseline calculation, select the Baseline data range: You can choose between fixed baseline value [the appropriate week] or moving baseline value which is based on previous week's data.
- Define the allowed deviation from baseline. Alarms can be generated either based on percentage of upper limit, lower limit value or straightaway on hard coded comparison values. The generated Alarm will be cleared if the value falls in the baseline range [that is checked every hour]. Alarm can be critical or warning.
- Select the comparison method.
- The recommended method would be to Compare last hour value directly with baseline value. Here, While comparing, hourly value will be taken into consideration and compared with the baseline value directly.For eg: Say if current time is 10:00 AM , Monday and if baseline date range is week 2. Then week 2 , Monday 10:00 AM value will be taken for comparison and upper and lower limits will be applied as per the user configuration.
- The other method would be to Compare values based on the corresponding difference with the previous hour. While comparing, the corresponding difference in hourly values would be taken into consideration.
For eg: If current time is 10:00 AM, we will take the difference between the values at 10:00 AM and 9:00 AM for comparison. A similar approach will be used for getting the baseline values.
- Finally, click 'Create Anomaly profile'.
Custom Expressions
Anomaly is detected when current data doesn't conform to the user defined rules [based on system variables]. For eg., you can create a rule like Anomaly is to be detected when the current Last Hour Average Value is greater than twice the Six Hours Moving Average Value. Critical and Warning alarms can be set accordingly.
The system variables that can be used for forming custom expressions are:
| Expressions | Meaning |
|---|---|
| $10D_MVA | Ten Days Moving Average |
| $LastHourValue | Last Hour Average |
| $6H_MVA | Six Hours Moving Average |
| $30D_MVA | Thirty Days Moving Average |
| $10H_MVA | Ten Hours Moving Average |
| $7D_MVA | Seven Days Moving Average |
To Create Anomaly Profile based on Custom Expressions:
- After choosing to create anomaly profile based on Custom Expressions, enter the profile name for the new anomaly profile.
- Critical Alarm : Create an expression like $LastHourValue > 10*$7D_MVA+(5+$30D_MVA). Then select the critical alarm from dropdown.
- Warning Alarm : Create an expression like $LastHourValue <= 25*$6H_MVA+(5+$10D_MVA). Then select the warning alarm from dropdown
- Save the Anomaly Profile.
Associating Anomaly Profile
To associate anomaly profile, follow the steps given below:
- Go to the respective monitor details page. Choose the attributes for which you want to configure alarms. Click on Configure Alarms link.
- Threshold Details and Anomaly Details will be listed. Click on Anomaly Details tab.
- From the drop down box, Choose the appropriate attributes and associate them to the corresponding anomaly profiles.
- Save the alarm configuration
- Anomaly profiles cannot be configured via Monitor Group templates or Type templates. They must be created and associated at the individual monitor level.
- A monitor's health will be marked as critical and an EMail notification will be sent only if the user has associated EMail action to the health of the dependant attribute.
Anomaly Dashboard
This dashboard facilitates viewing through all the performance metrics. It helps the user to intuitively scan through the hundreds of performance metrics with ease.
- If the health of any attribute / Monitor Group / Monitor has turned critical or if the availability is down, click on the icon for seeing the root cause analysis.
- Click onUse Anomaly Dashboard for troubleshooting to access the Anomaly Dashboard. You can access Anomaly Dashboard from Alarms tab too. In Alarms tab, all alarms whose health have turned critical are listed. Click on alarm message, it goes to Alarm Details page. In Alarm history table, you can find the Anomaly Dashboard icon
- In Anomaly Dashboard, You can choose to list only critical monitors or all monitors.
Note: Critical state is based on the Anomaly profile associated to the attribute of the monitor.
- Base Metrics shows response time details and all other metrics by using current time but you can customize it using the changelink. You can change the attribute and time.
Note: The chosen time is used in all other calculation such as last hour value, 12 hour average etc.
- Graphs: Last polled is last hour value. 12 hour is last 12 hour average values in graphical format [ SparkSeries]. 7day segmented hour is shown as bar graph [Sparkline]. You can click through the columns to view the detailed reports.
- After associating anomaly profile to an attribute of a monitor, if the profile rule is violated, the monitor becomes critical and background of 12 hour graph will be red in color. By clicking on the column, you can see the detailed report like when anomaly value was reached, etc.
See Also:
