Agent Diagnosis using Health Monitor tool
APM Insight .NET monitoring also features a diagnostics tool called Health Monitor which monitors the health of the agent running in the server. The Health monitor is a self diagnostic tool intended to provide a snapshot of the agent settings and is helpful in identifying and troubleshooting frequently-encountered configuration issues in the agent. It can be found in the start menu under APM Insight .NET Agent folder.
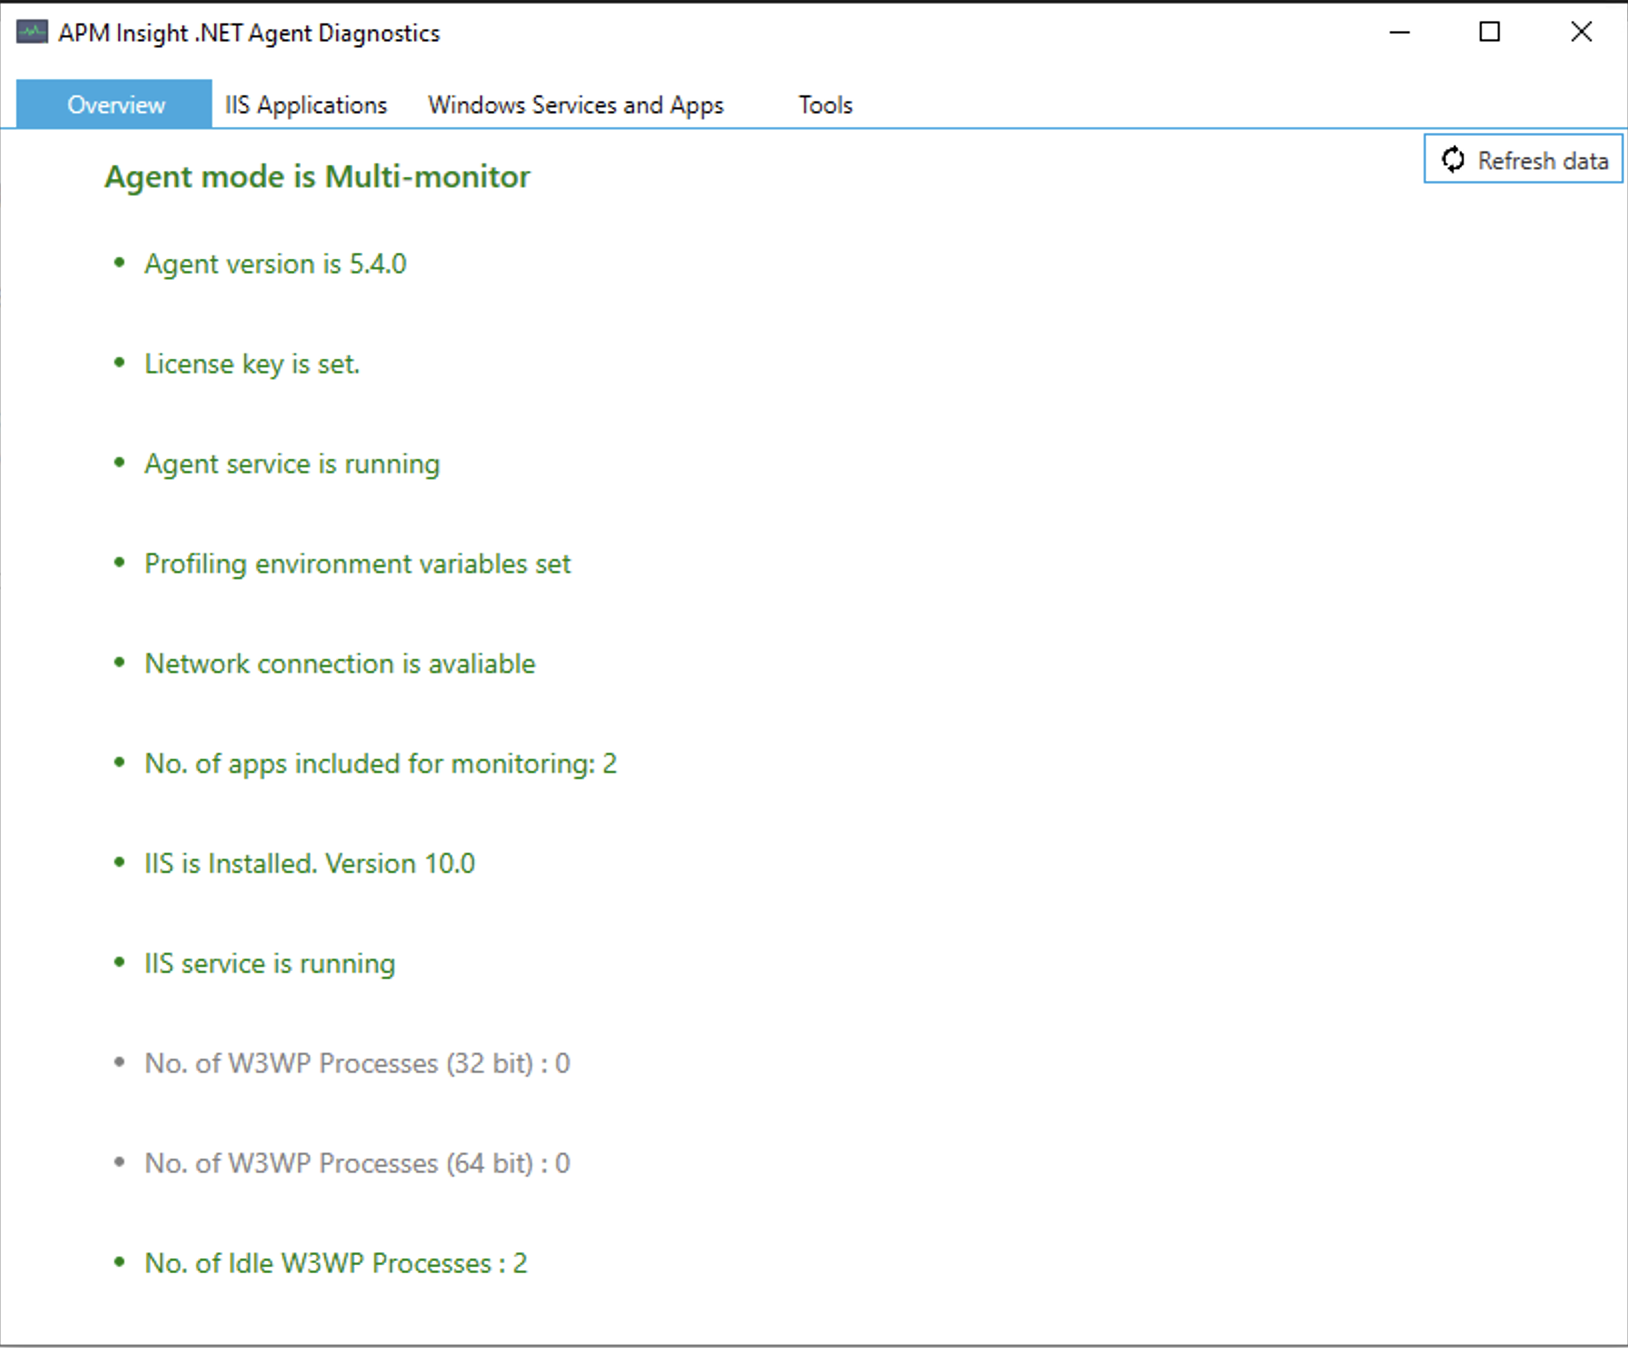
Overview
It helps to ensure that the basic settings such as license key, endpoint connectivity, and agent profiler are configured successfully.
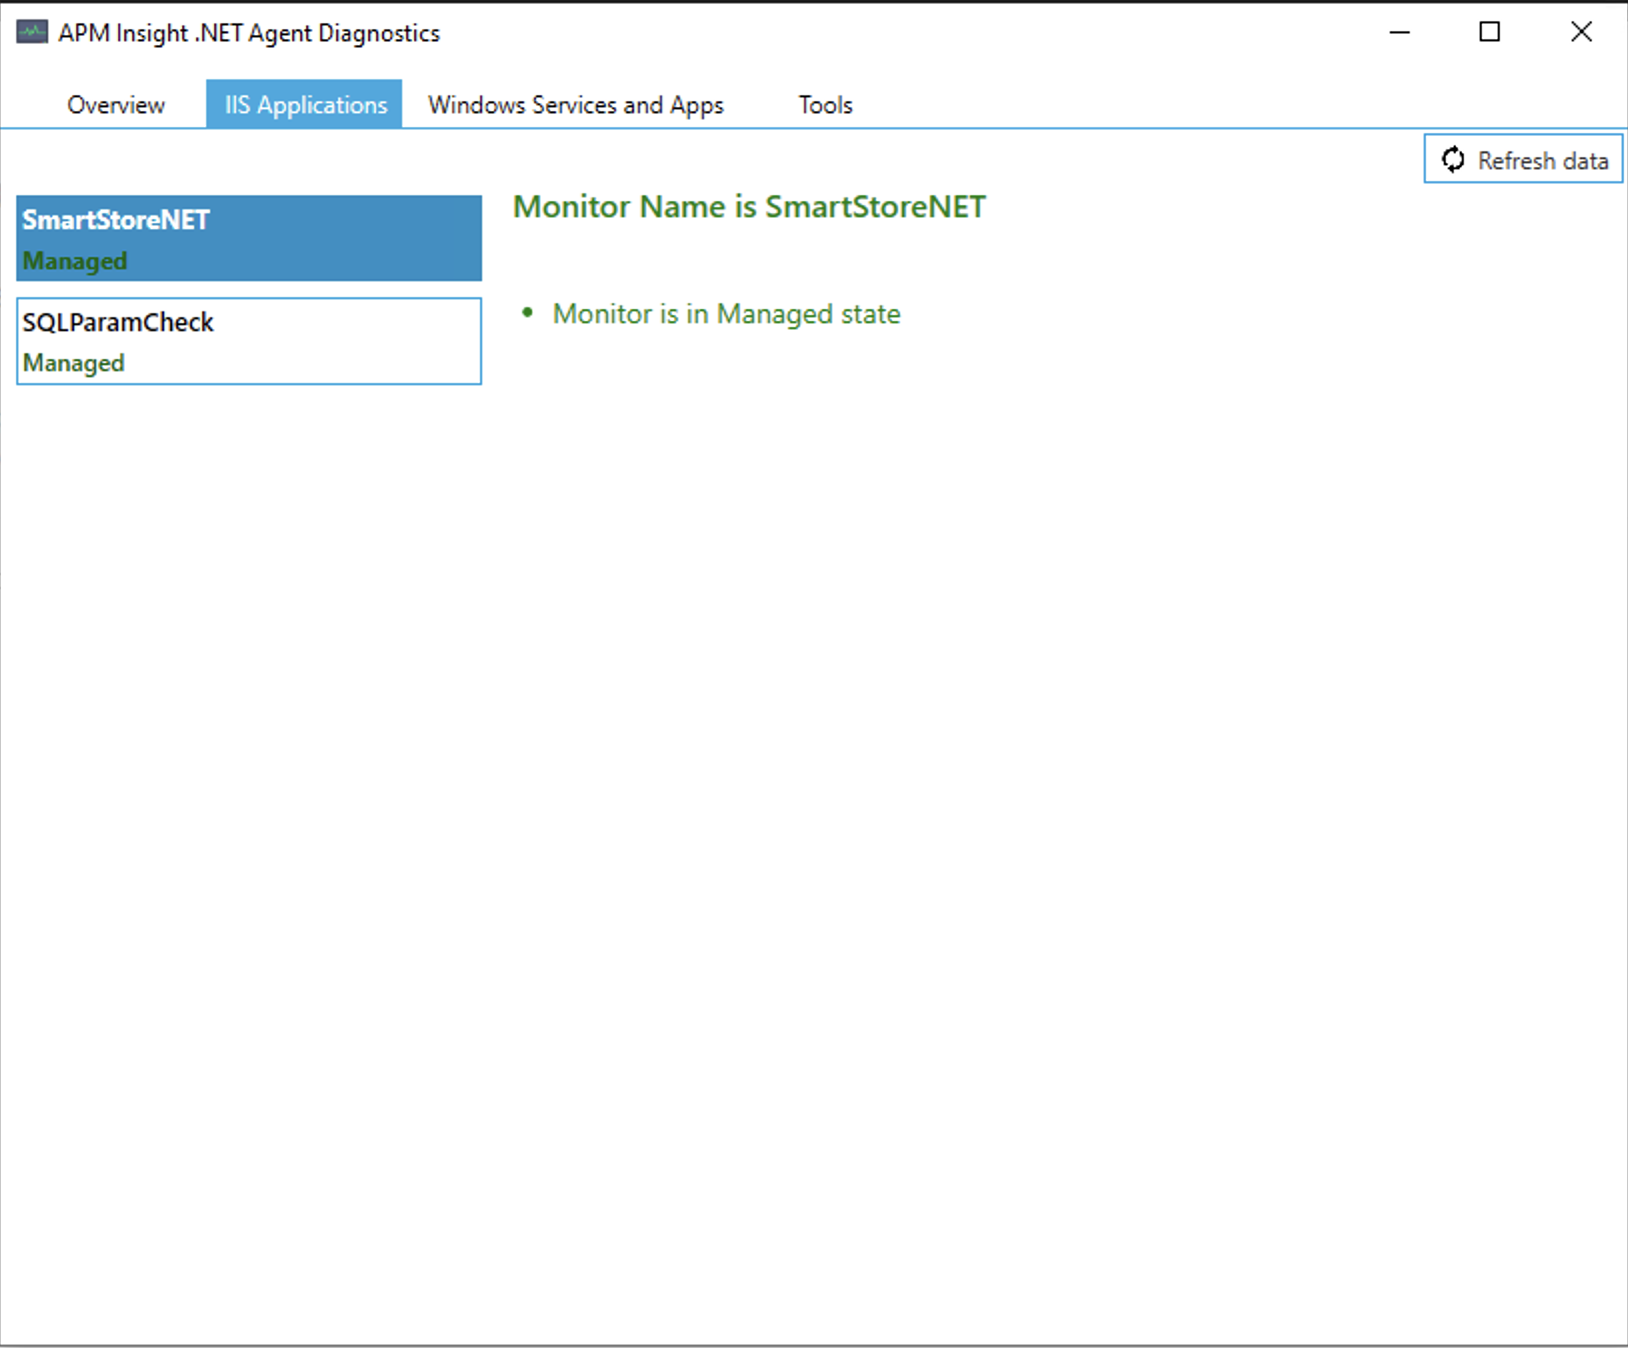
IIS Applications
It helps to verify the status of the IIS application monitor, whether it is active, suspended, deleted, or skipped.
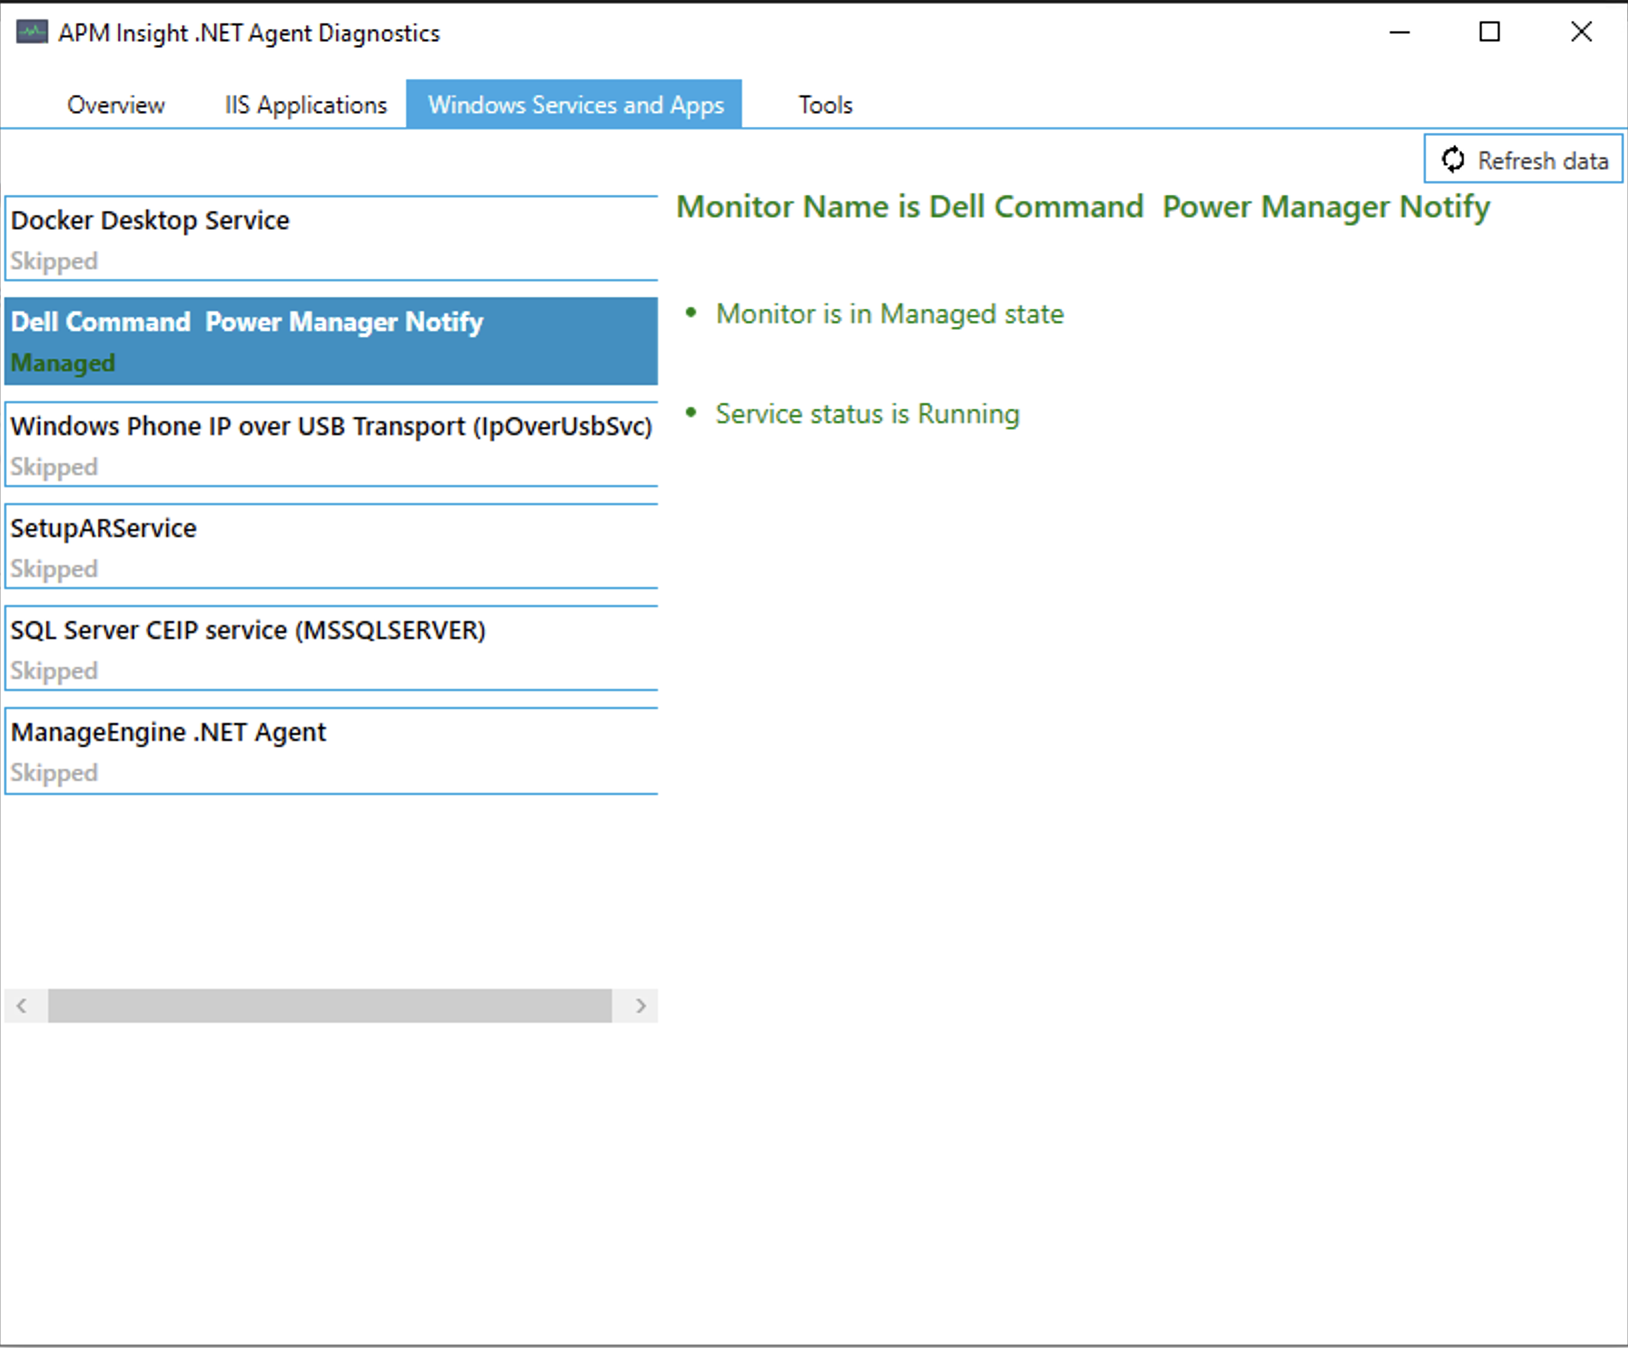
Windows Services and Apps
It helps to verify the status of a Windows service or a stand-alone application monitor is active, suspended, deleted, or skipped.
Tools
With the Health Monitor, you can:
- Create Diagnostic zip file - The Health Monitor captures all agent logs, and other system information, necessary to analyze the issue by the support team. Optionally, event log information could also be appended.
 Note: You can also create diagonstic zip file via command line. To do so, navigate to the health monitor directory (Default location: C:\Program Files (x86)\APM Insight\APM Insight .NET Agent\HealthMonitor) present in APM Insight .NET agent folder via command line and execute the following command:
HealthMonitor.exe -diag "<Mention_the_path_to_export_the_diagnostic_zip_file>" - View Service settings - The Agent service mode (i.e., single/multi-instance), APM agent service status (running/stopped) and log level.
- Check Network connectivity - For successful communication, the APM Insight agent must be able to connect to Applications Manager's servers. Verify if these ports are not blocked by firewall or anti-virus software. Health monitor will use the proxy configured in the agent for checking communication with Applications Manager server. If you have internet proxy in your server, configure it in agent configuration tool.
- Check Application filters - If application filters are applied, verify if the applications running are monitored. Refer Application Filters guide.
- Monitor worker processes - If no worker processes are shown as running, perform a transaction and retry.
Note: In agent below v2.3, if worker processes are still not counted, then it could be due to the bitness of the agent. APM Insight agent and the worker processes should have the same bit. (i.e., 32-bit agent for 32-bit applications, and 64-bit agent for 64-bit applications).
- Verify monitor status - The status of the monitor (i.e., Managed/UnManaged/Deleted/LicenseExpired, etc) will be displayed, under the monitor name. For a single instance, only one monitor will be listed. For multi-instance, all the monitors created by the agent would be listed.
- Verify profiler status - In order to successfully instrument the IIS applications, the profiler must be loaded into the worker process. If the loading fails, an IIS Reset must be performed to reload the profiler. Also, ensure that some other profiling agents are not installed in the same machine (i.e. there can be only one active profiler in a machine).
Note:
- In case of issues, please ensure that some transactions are done when the agent log level is "DEBUG" before creating the diagnostics zip. This would help us narrow down the issue quicker.
- To include event logs, along with the diagnostic zip, select the 'Event logs' check box below 'Create Diagnotics zip file' button. This requires administrative privileges.
