Monitoring with Java Agent API
In general, APM Insight Java Agent monitors commonly used frameworks and libraries. With Java Agent API, you can track custom metrics to monitor parameters that are specific to your application and thus obtain finest methods for Java monitoring. This helps in contextual debugging. The Java Agent API allows you to annotate methods that are to be monitored. Additionally, you can provide a custom name for your methods and components to make it easier to identify and troubleshoot them.
Requirements:
Before monitoring via the Java Agent API, make sure the following requirements are met:
- Java version 1.8 to v24.
- API JAR file (apminsight-javaagent-api.jar) which is bundled with the Java Agent zip file.
- The API Jar file is available in your application's build path and bundled with your application (Preferred location: WEB-INF/lib).
Usage:
You can use the Java Agent API for the following:
- In Custom Instrumentation
- To track Exceptions
- To monitor block of code
- To add custom parameters to trace
- To customize transaction name
Custom Instrumentation using the Java Agent API
Apart from default classes and methods defined in the application framework, you can monitor your own application specific methods and classes using custom instrumentation.
Custom instrumentation can be done either via the Java Agent API or by using the configuration file.
The Java Agent API provides you with annotations to instrument your methods and classes.
Note: To exclude packages from being instrumented, refer here.
Track exceptions using Java Agent API (version 3.5)
Although you can track exceptions with the help of the agent, the Java Agent API provides more visibility and customized options for monitoring/debugging purposes.
Normally, the agent captures exceptions that have been logged or uncaught. In most cases, developers tend to catch exceptions and handle them within the code without propagating them. These kind of exceptions can be tracked using this API. With the Java Agent API, you can provide a custom message and actual throwable exception object and track exceptions when they occur.
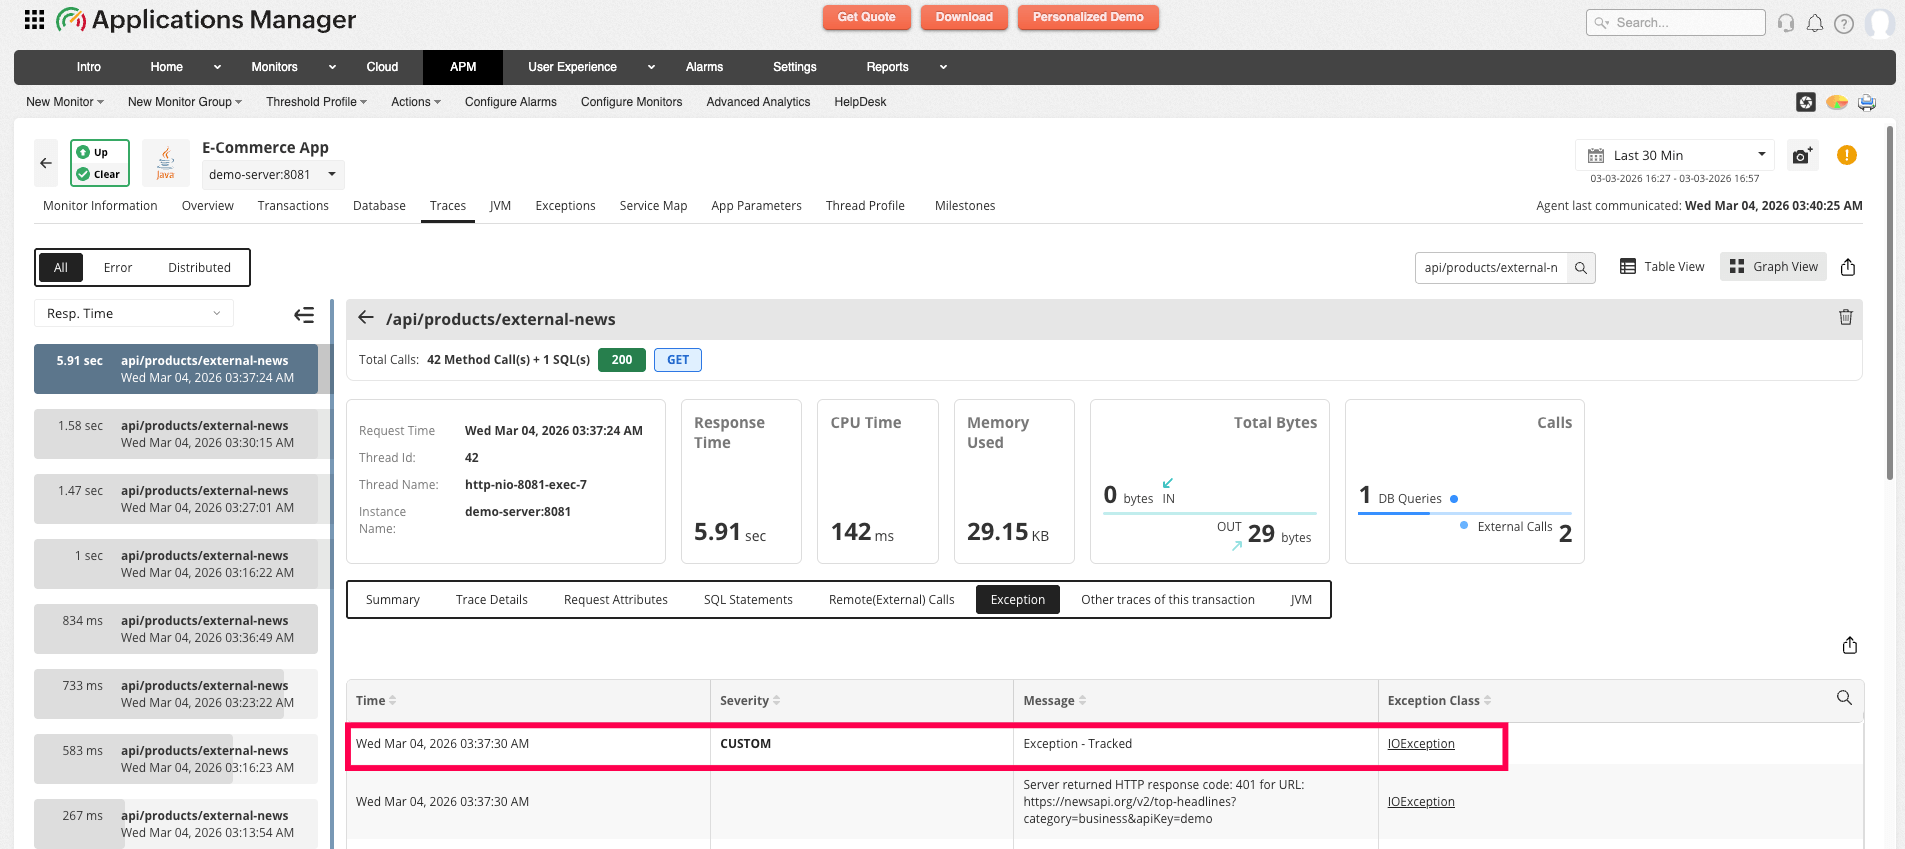
You can add the API in your application code to provide an error message and an exception. This is then tracked by the agent and associated with its respective transaction.
You can view these exceptions under the Exceptions tab of APM Insight.
Syntax:
CustomTracker.trackException(String message, Throwable throwable); CustomTracker.trackException(Throwable throwable);
Sample Input:
try { int number = 10/0; } catch(Exception e) { CustomTracker.trackException("Exception - Tracked", e); }
Sample Output:
Monitor a block of code
You can also use the Java Agent API to monitor specific blocks of code inside method levels. To monitor a block of code, enclose the block of code within the new object of the CustomTracker and stop method.
You can associate a name, component, and exception with the block. As of now, names only support spaces, hyphens, underscores, and alphanumeric characters. Block names can be up to 64 characters long, while component names are limited to 32 characters.
Creating a new CustomTracker object marks the start point of the block to be monitored; the end of the block is marked using the <trackerObj>.stop() method. If there are any exceptions in the block, the exception object can be passed to the stop method; this automatically associates the exception to the corresponding block and its transaction.
Syntax:
CustomTracker tracker = new CustomTracker("block__name"); CustomTracker tracker = new CustomTracker("block_name", "component_name"); tracker.stop(); tracker.stop(exceptionObj);
Sample Input:
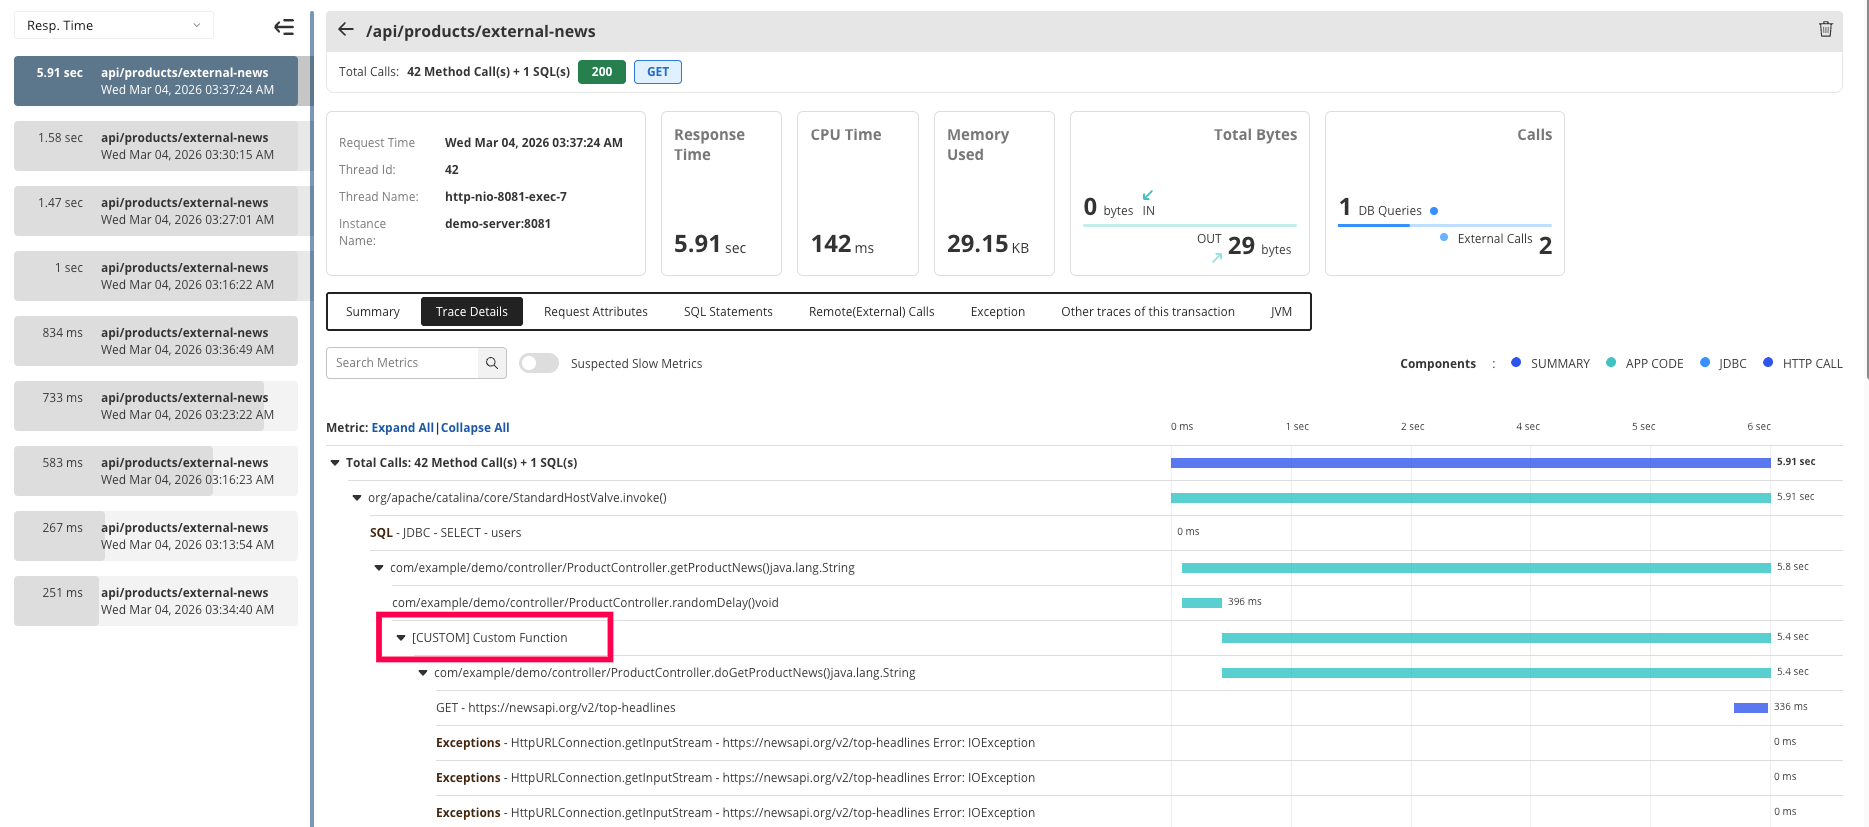
CustomTracker tracker = new CustomTracker("Custom Function"); try { // some operations tracker.stop(); } catch (NumberFormatException nfe) { tracker.stop(nfe); // some rescue operations }
Sample Output:
Add custom paramters to trace
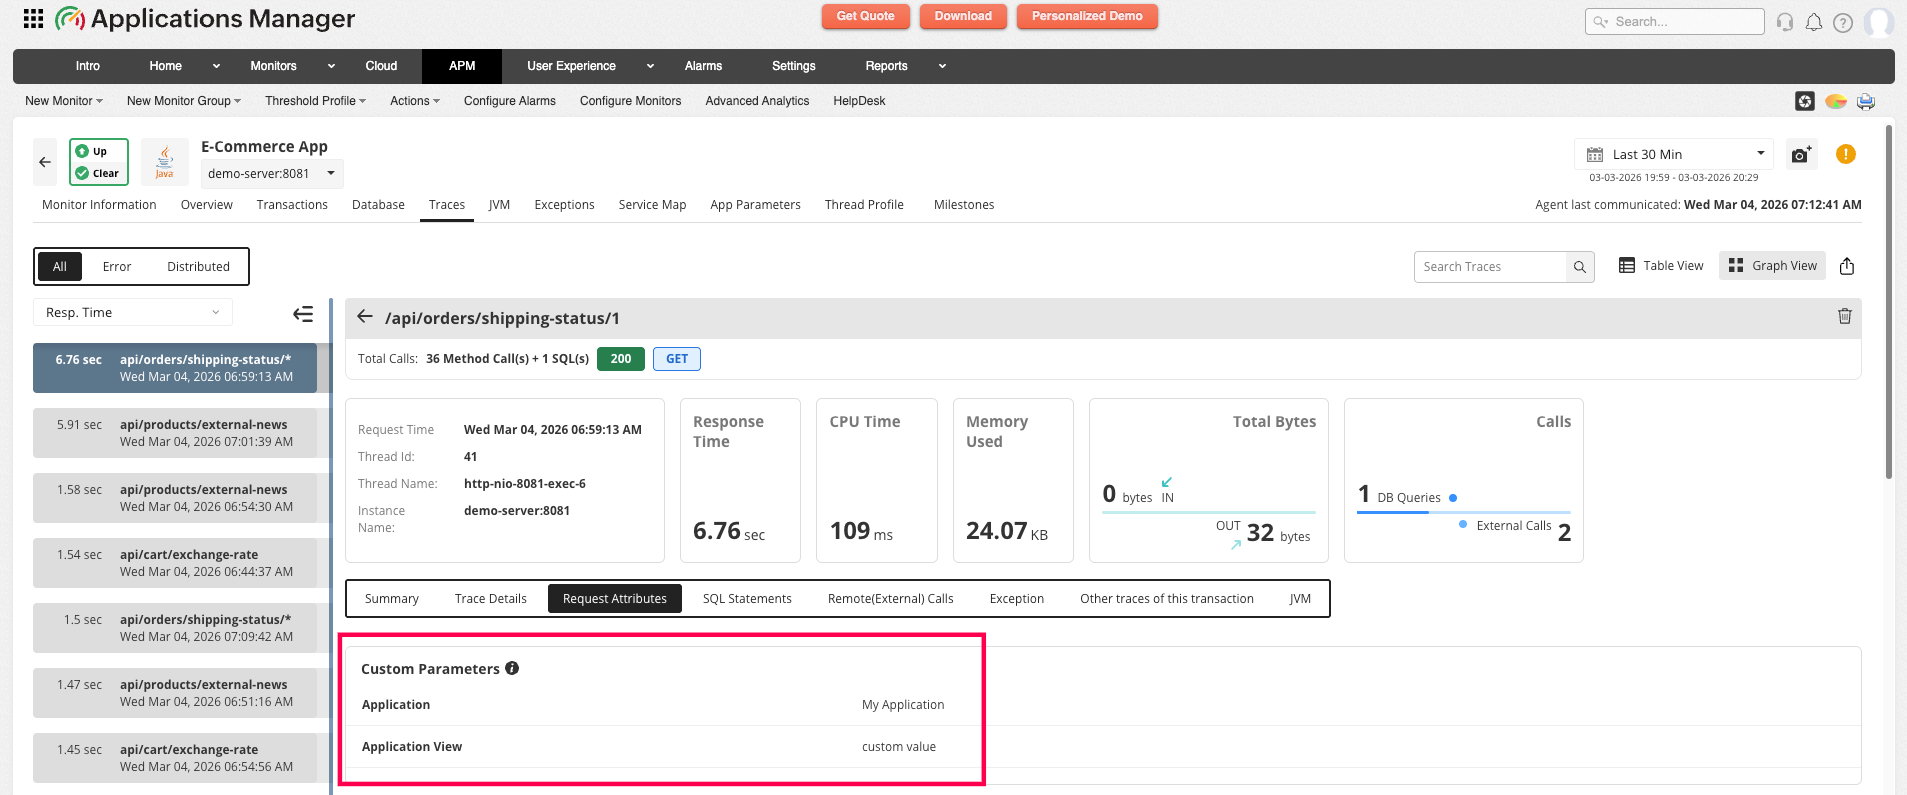
To give contextual meaning to traces, you can add additional parameters which can help you identify the context of the transaction trace. Contextual metrics can be anything, a session id, user id or certain method parameters which can help you identify the specific information about a transaction trace. You can add a maximum of 10 parameters to a transaction trace, these parameters can be viewed under Trace Summary.
To add a custom parameter, follow the syntax given below:
Syntax:
CustomTracker.addParameter("key", value);
where,
key - Name of the parameter
value - Parameter of the value. It can be of any type, internally agent converts them to string using Object.toString()
Sample Input:
import com.manageengine.apminsight.agent.api.CustomTracker; .... { .... CustomTracker.addParameter("Application View", "custom value"); CustomTracker.addParameter("Application", "MyApplication"); .... }
Sample Output:
Customize transaction name
If you like to define a unique name for a transaction for easy tracking and identification, you can use our agent API.
Syntax:
CustomTracker.setTransactionName("name");
where,
name - desired name for the transaction
Sample Input:
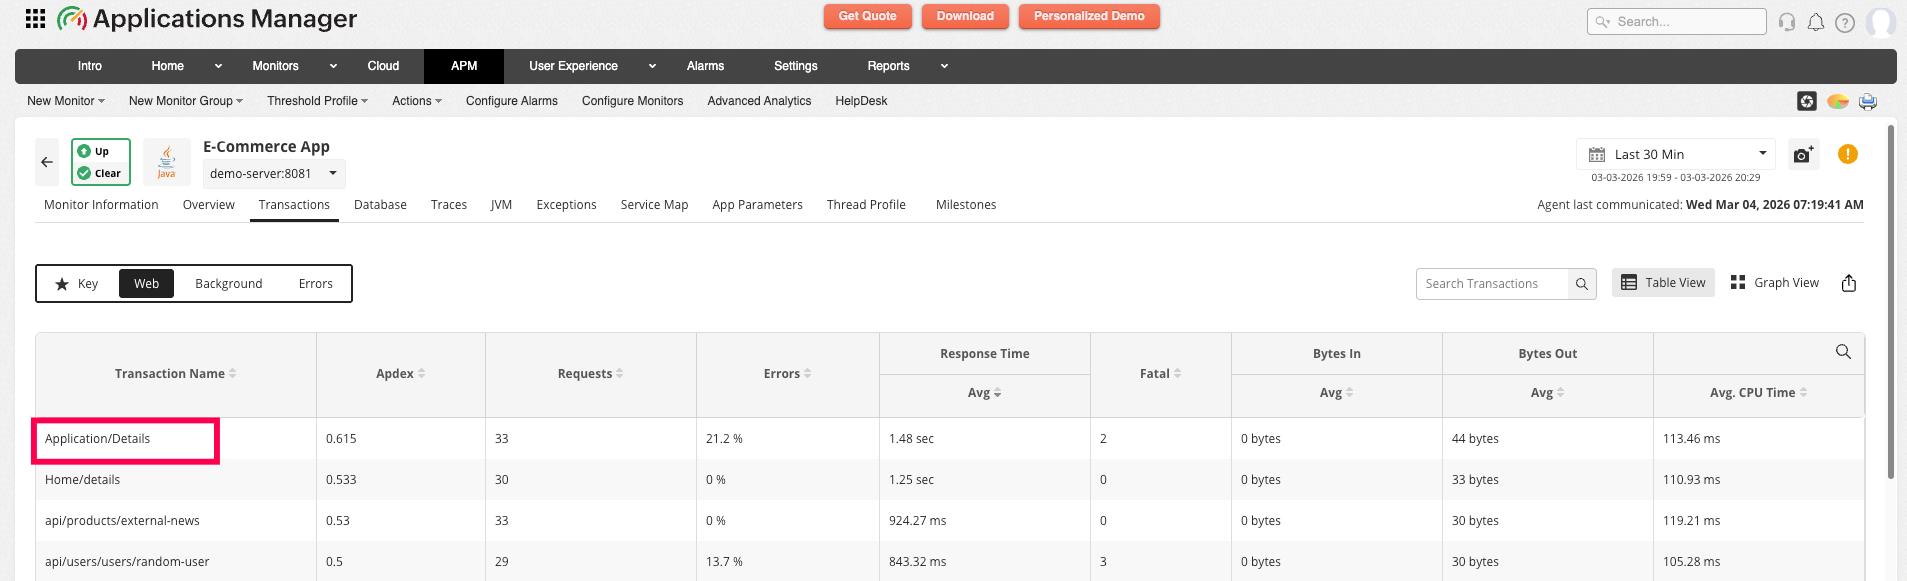
import com.manageengine.apminsight.agent.api.CustomTracker; .... { .... CustomTracker.setTransactionName("Application/Details"); .... }
Sample Output:
Note: Applications Manager's APM Insight displays the details for a maximum count of 50 transactions and 75 traces.
