AppLog Dashboard and Widgets
- Overview
- How to add widgets to the dashboard
- AppLog dashboard controls
- Built-in and saved-search widgets
- Adding AppLog Query widgets on custom dashboards
Overview
Note: The AppLog Dashboard is available only from Applications Manager v183000 onwards.
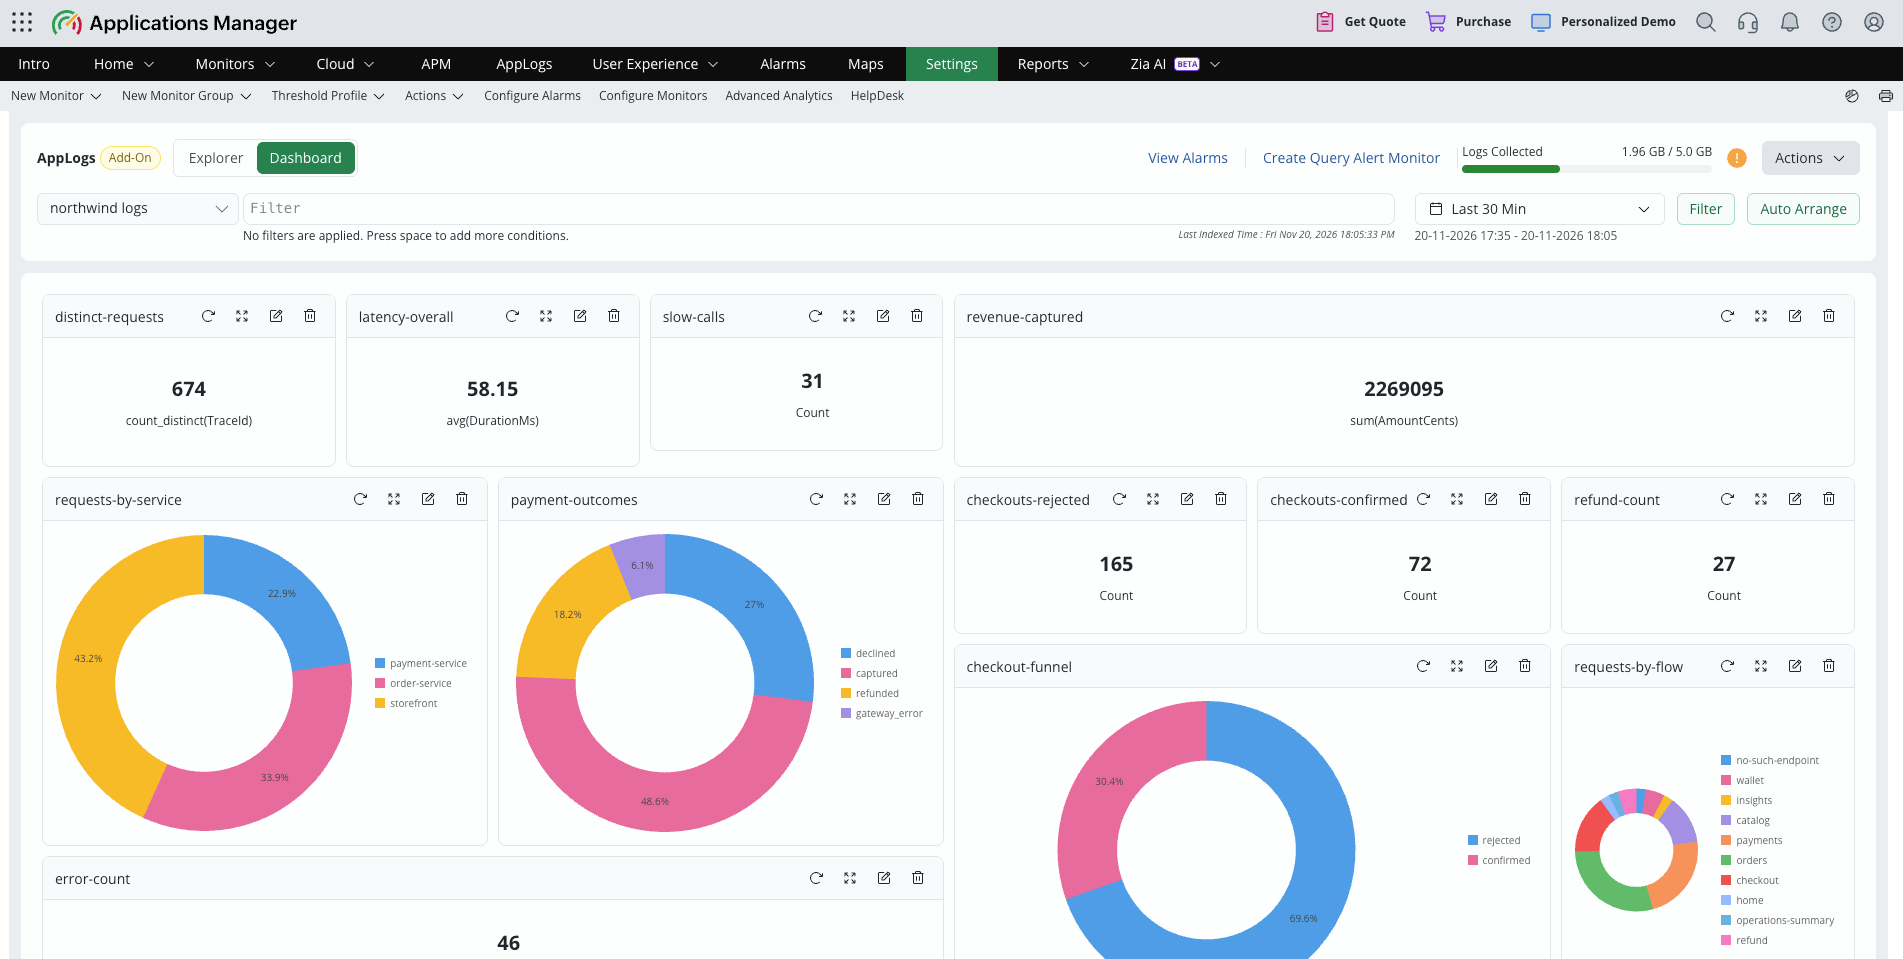
The Dashboard tab in the AppLogs page lets you view your saved searches as widgets, so you can keep an eye on key log metrics at a glance without running each query yourself.
For the dashboard to be created, you should onboard the FSO Agent on the required servers, enable AppLogs, and then configure a log profile that associates the log type with the log files. After data is collected and indexed, select the log type on the Dashboard to view its widgets.
To open the dashboard, go to the AppLogs tab and click on Dashboard located next to Explorer.
How to add widgets to the dashboard
AppLog dashboard
In AppLog dashboard, widgets are added using the following methods:
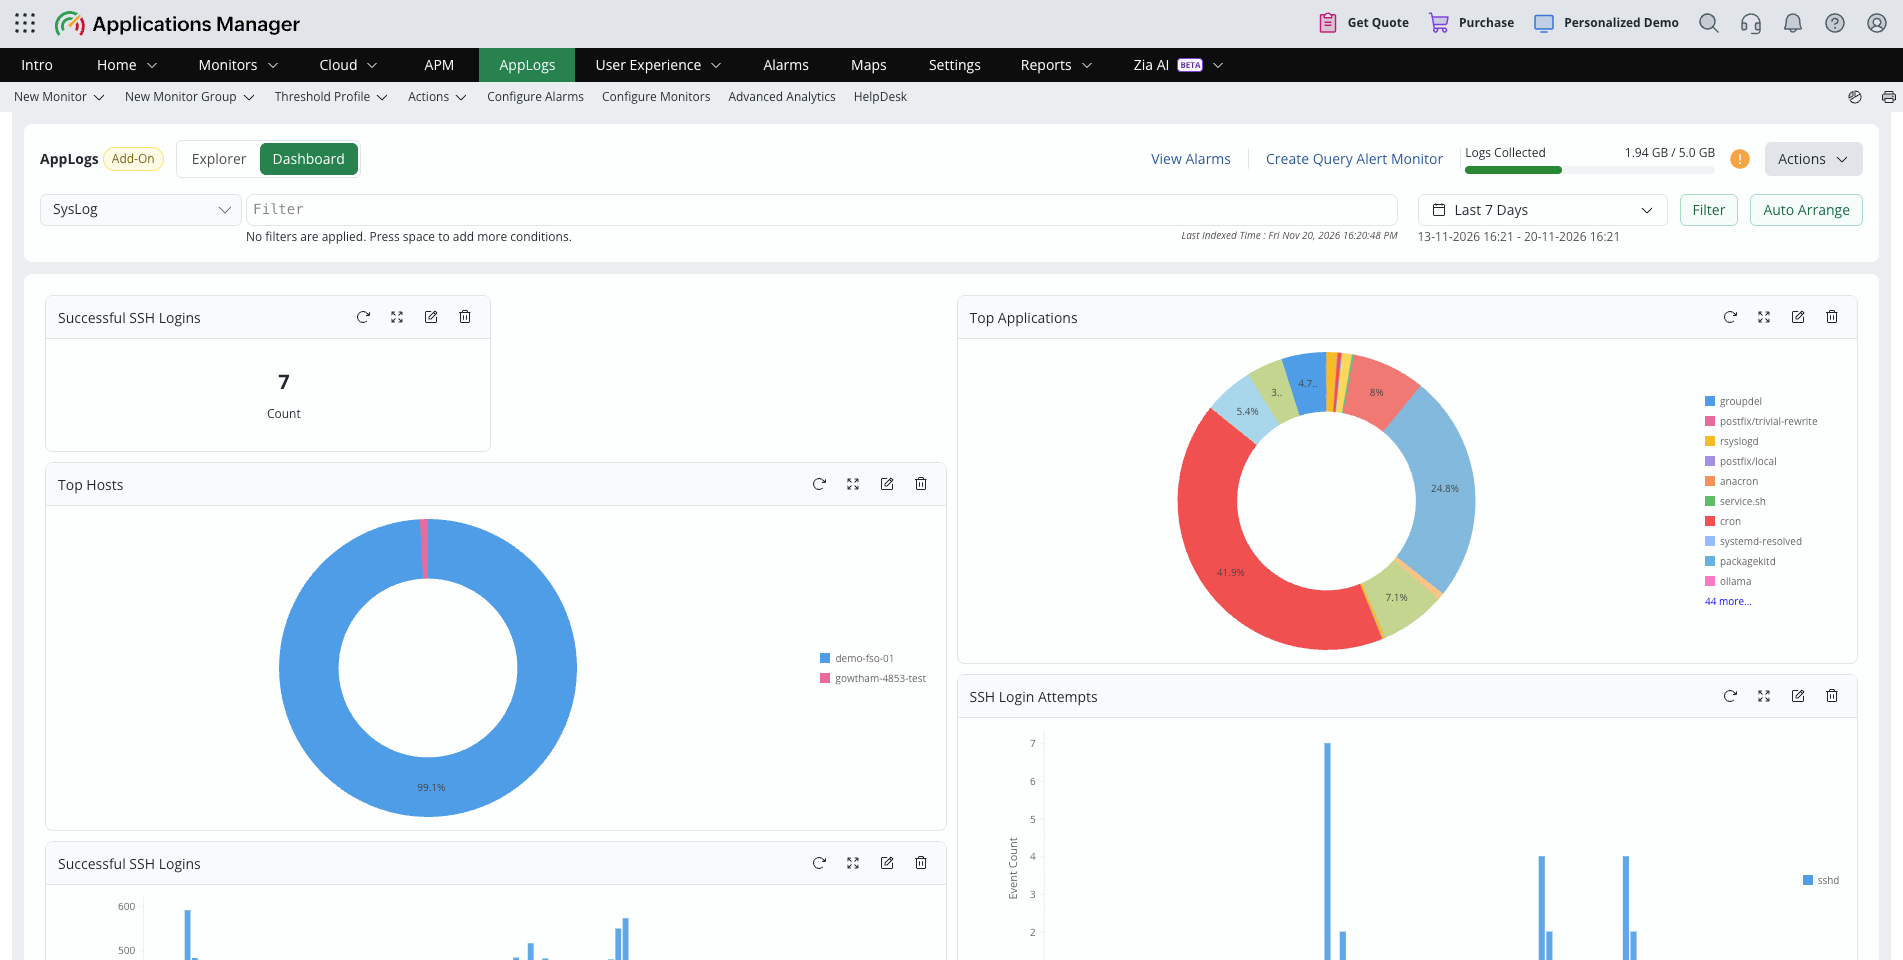
- Default widgets: Applications Manager automatically creates built-in widgets for supported log types. These widgets use built-in queries and do not appear in the Saved Searches list. When you save a query in Explorer, it is added to the AppLog Dashboard as a widget.
- Your saved searches: Every query you save is added to the dashboard automatically as a widget. Learn more
Applications Manager dashboard
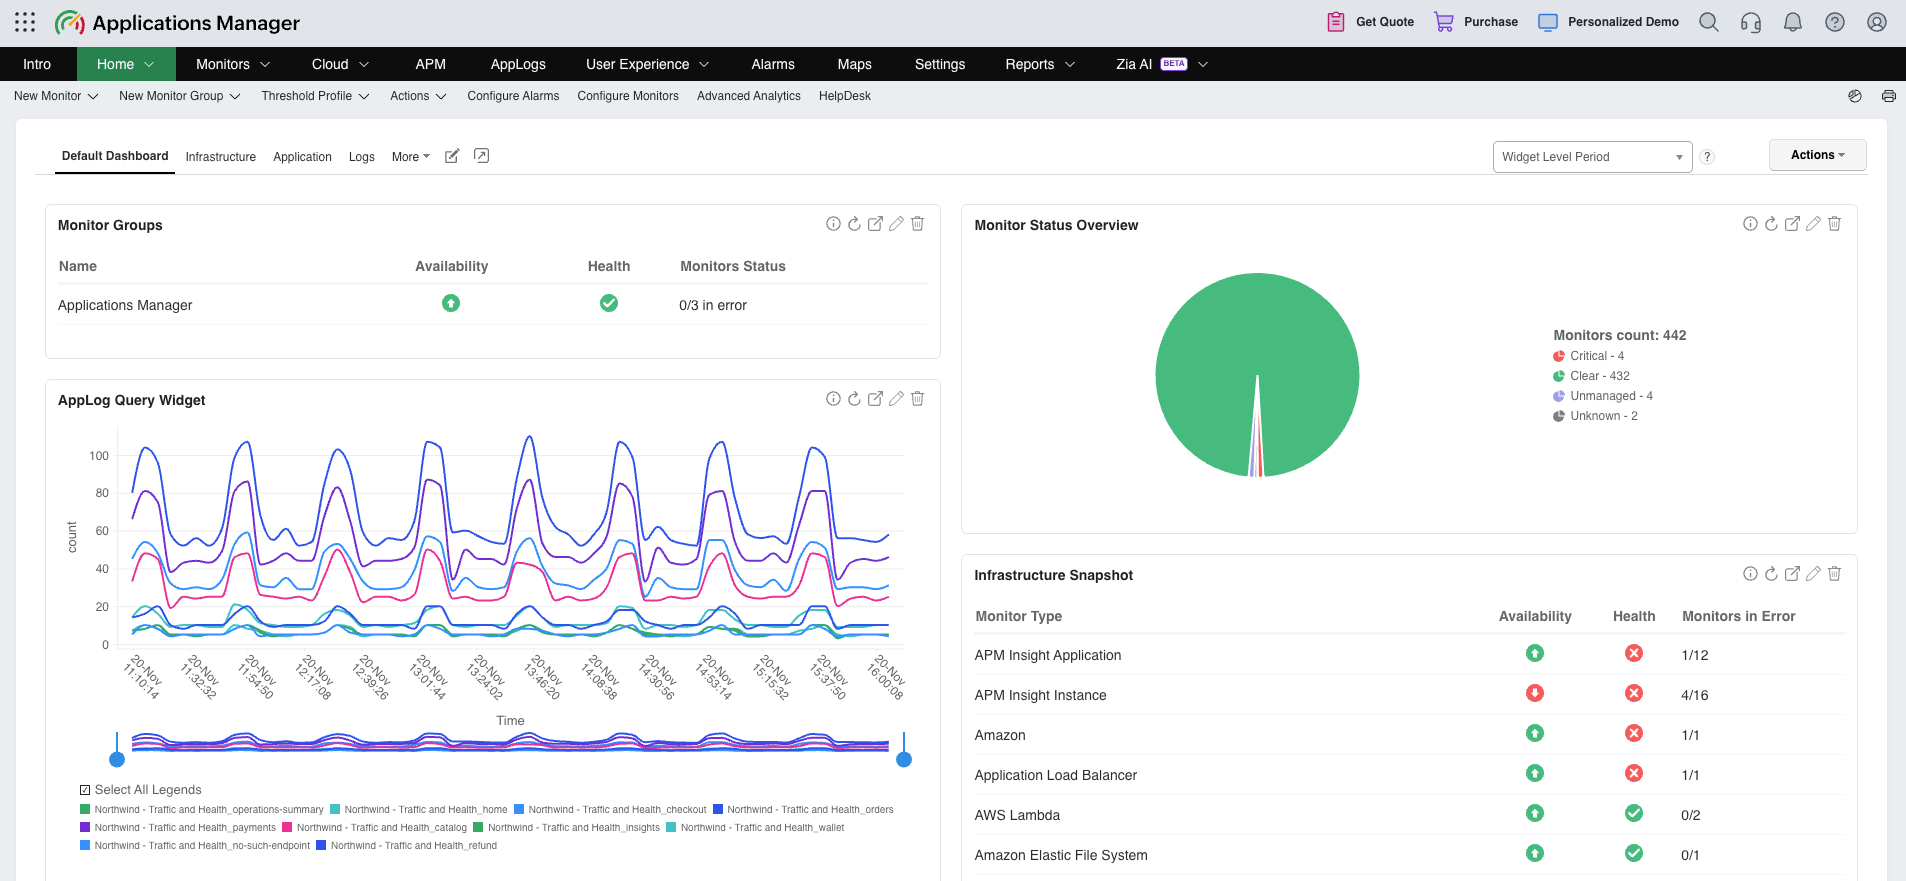
The Applications Manager dasboard can be viewed by accessing the Home tab. Here, widgets are added using the following methods:
- Add to Custom dashboards: Allows you to add the saved search as a widget to the dashboard by selecting the Add to Custom Dashboard option while saving the query from the Explorer view, and then choosing the required dashboard. Learn more
- AppLog Query Widget: Allows you to manually add the widget to the required dashboard based on the Saved Search query. Learn more
Note: You can create custom Applications Manager dashboards to view infrastructure, application, and AppLogs data altogether in a single place. All you have to do is add the relevant widgets to the same dashboard, then select its tab to open the combined view.
AppLog Dashboard controls
Use the controls at the top of the AppLogs Dashboard to select the log data and time period displayed by its widgets. The dashboard includes the following elements:
- Log type: Select the log type whose widgets you want to view, for example, northwind logs.
- Filter: Enter a condition to narrow down the data shown in the widgets, and click Filter.
- Time range: Select the period for the widgets, for example, Last 12 Hours. The selected date range is shown below it, along with the Last Indexed Time.
- Auto Arrange: Arranges the widgets on the dashboard automatically.
Built-in and saved-search widgets
Applications Manager automatically displays preconfigured widgets for supported log types. These widgets use built-in queries and are not listed in the Saved Searches drop-down. The available widgets depend on the selected log type. For example, DNS flow log dashboards can include request counts, server and client bytes, response-time trends, and top-host visualizations. When you save a query in Explorer, it is also displayed as a widget on the AppLogs Dashboard.
Each widget is named after the query it shows, and the way it is displayed depends on the query:
- Count and aggregation queries, such as
count,count_distinct(TraceId),sum(AmountCents), andavg(DurationMs), appear as a value. - Group-by queries appear as charts, such as donut and bar charts, showing how the result is spread across the groups.
Use the icons in the widget header to refresh, expand, edit, or delete the widget.
Adding AppLog Query widgets on custom dashboards
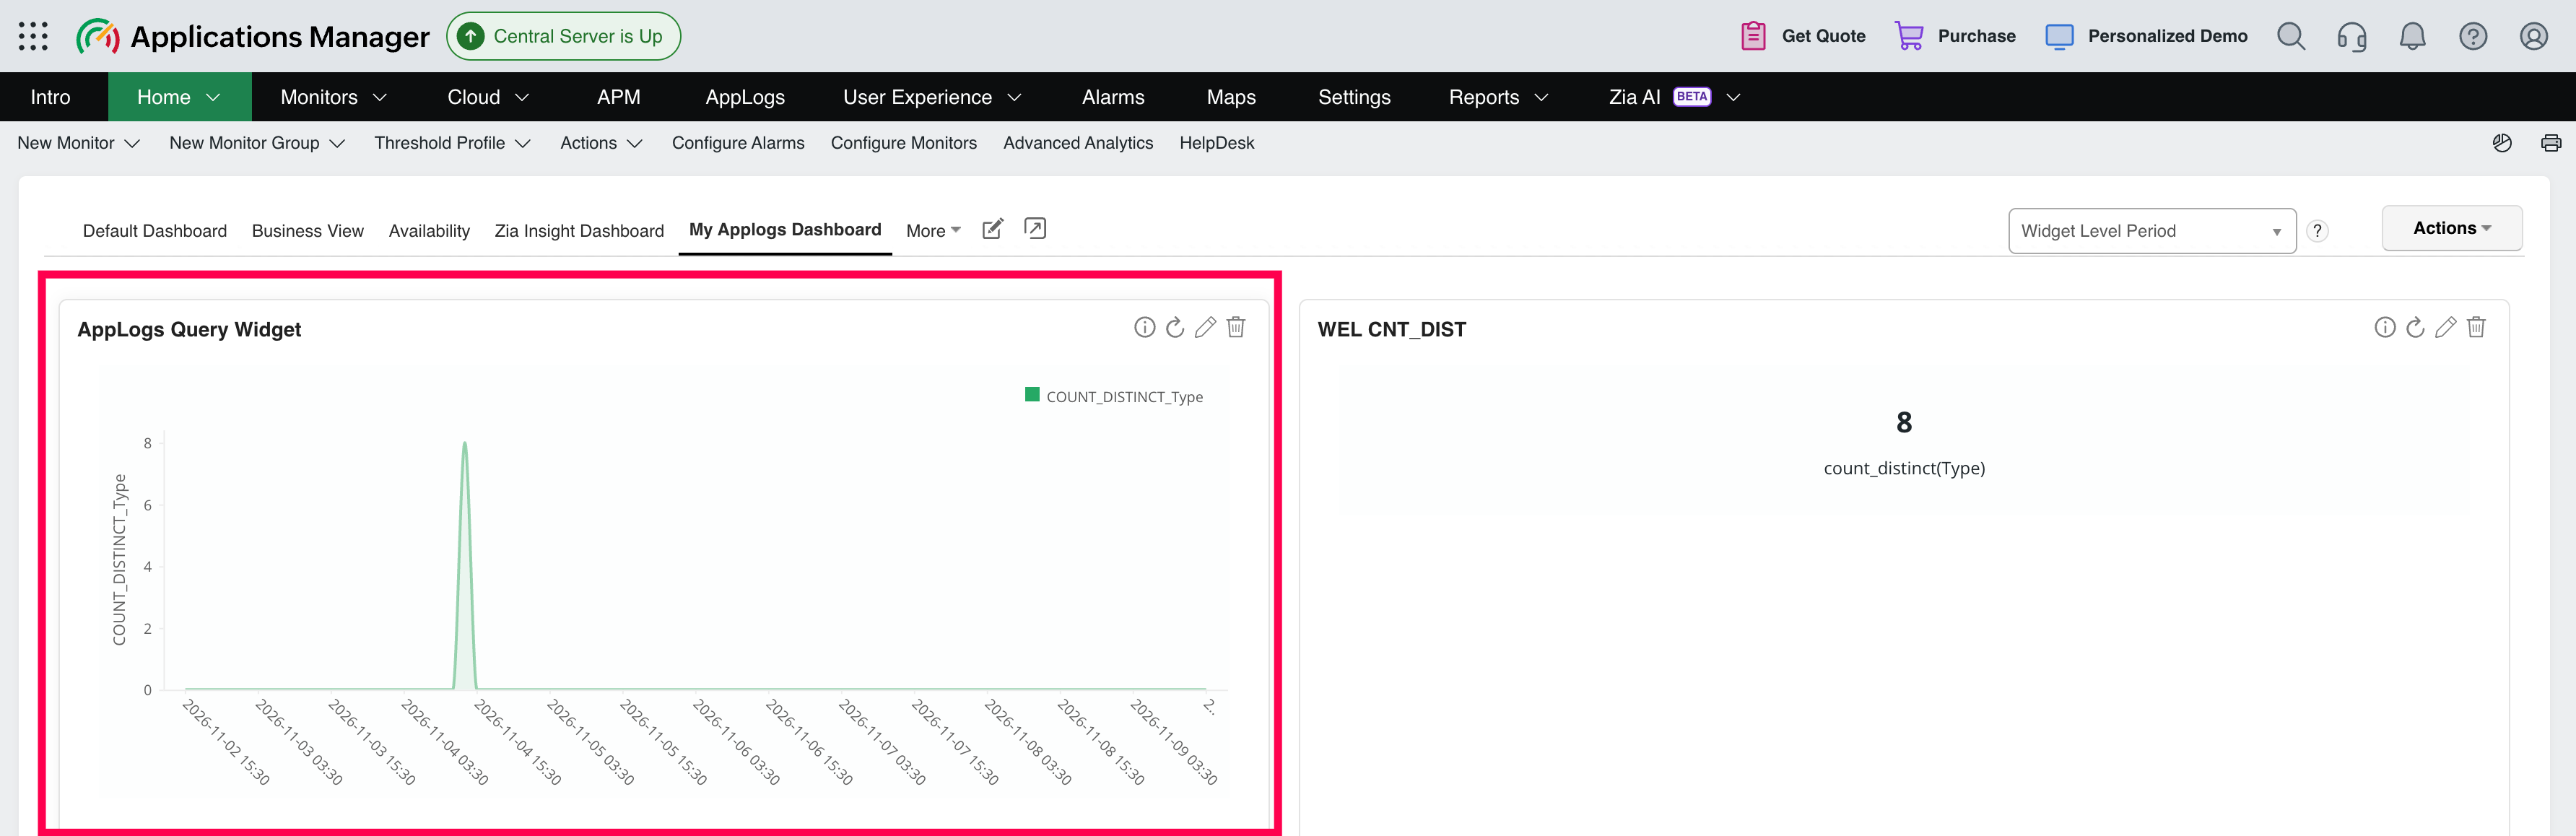
Apart from adding a saved search via Add to Custom Dashboard option, you can directly add an AppLog Query widget on custom dashboards shown under the Home tab and configure the query that the widget displays. To add a saved search from custom dashboard, follow the steps given below in the APM Home dashboard section:
- In the Home tab, open the dashboard where you want to add the AppLog widget.
- Navigate to Actions dropdown located on top right corner and click on Add Widgets.
- From the widgets list, select AppLogs Query Widget checkbox present under the AppLogs category and click Add.
- An empty widget named AppLog Query Widget will be added to the dashboard. Go to the widget and click Edit Widget.
- Specify the following details:
- Display Name: User-defined name of the widget header.
- Description: Optional description specifying the widget details or purpose.
- Widget Time Period: Time range used to retrieve log data of the specified query for the widget. Eg. Last 7 Days.
- Saved Search: The saved search selected from the dropdown, for which log data needs to be retrived. For example,
SysLog_CountDist - Query: The query added to the saved search for which log data needs to be retrived. For example,
logtype="Windows Event Log" COUNT_DISTINCT(type). - Select Chart Type: The chart type based on which log query results needs to be displayed. (Bar, Line, Area, or Number).
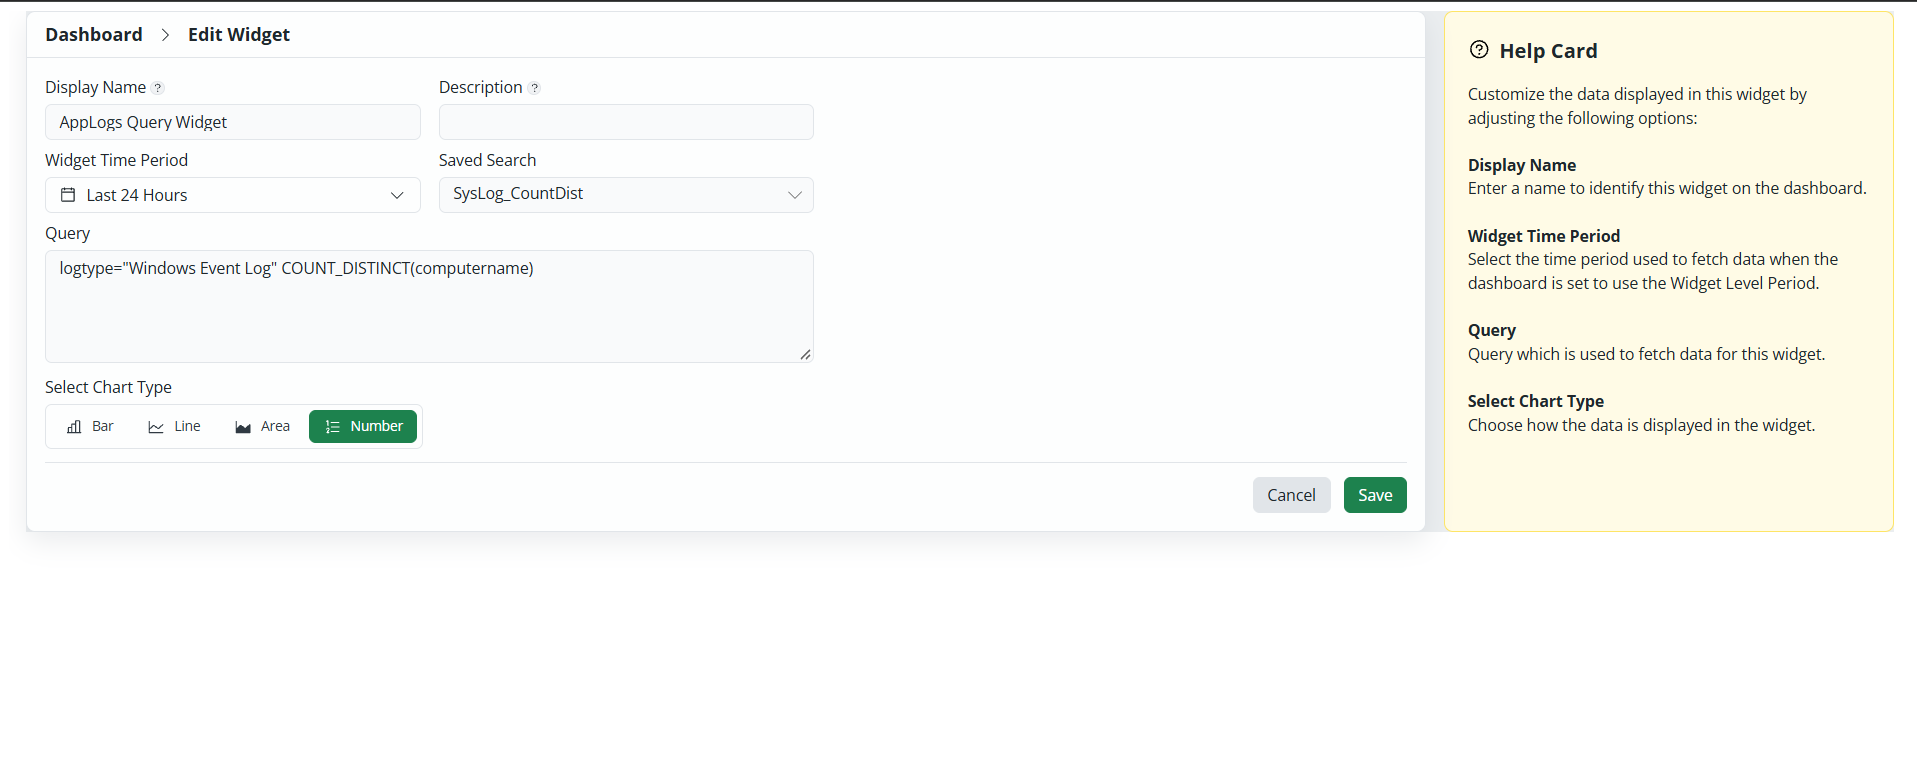
- Click Save to display the log data in the widget.
Loved by customers all over the world

"Standout Tool With Extensive Monitoring Capabilities"
It allows us to track crucial metrics such as response times, resource utilization, error rates, and transaction performance. The real-time monitoring alerts promptly notify us of any issues or anomalies, enabling us to take immediate action.
Reviewer Role: Research and Development

"I like Applications Manager because it helps us to detect issues present in our servers and SQL databases."
Carlos Rivero
Tech Support Manager, Lexmark