AppLogs Explorer
- Overview
- Accessing the Explorer
- Searching logs
- Log query language reference
- Saved searches
- Recent searches
- Log Explorer Dashboard
- Alerting on saved log searches
- Viewing alarms
Overview
The AppLogs Explorer provides a centralized interface in Applications Manager to search and explore the application logs collected from your servers by AppLogs. With simple queries, you can find log entries, aggregate and group log data, view results as graphs and tables, and set up alerts.
With the Explorer, you can:
- Search and explore application logs using queries
- View aggregation and group-by query results as graphs
- Save queries for future use
- View and access recently executed queries
- Configure alerting directly for a saved query
- View the alarms generated from the configured monitors
- View your saved searches as widgets on your dashboards
Accessing the Explorer
To access the Explorer, navigate to the AppLogs tab. Logs must already be collected before you can search them. To start collecting logs, install the FSO Agent with AppLogs monitoring enabled and create a log profile for it. Refer to What is AppLogs? to know how AppLogs works, and to supported log types for the log types you can search.
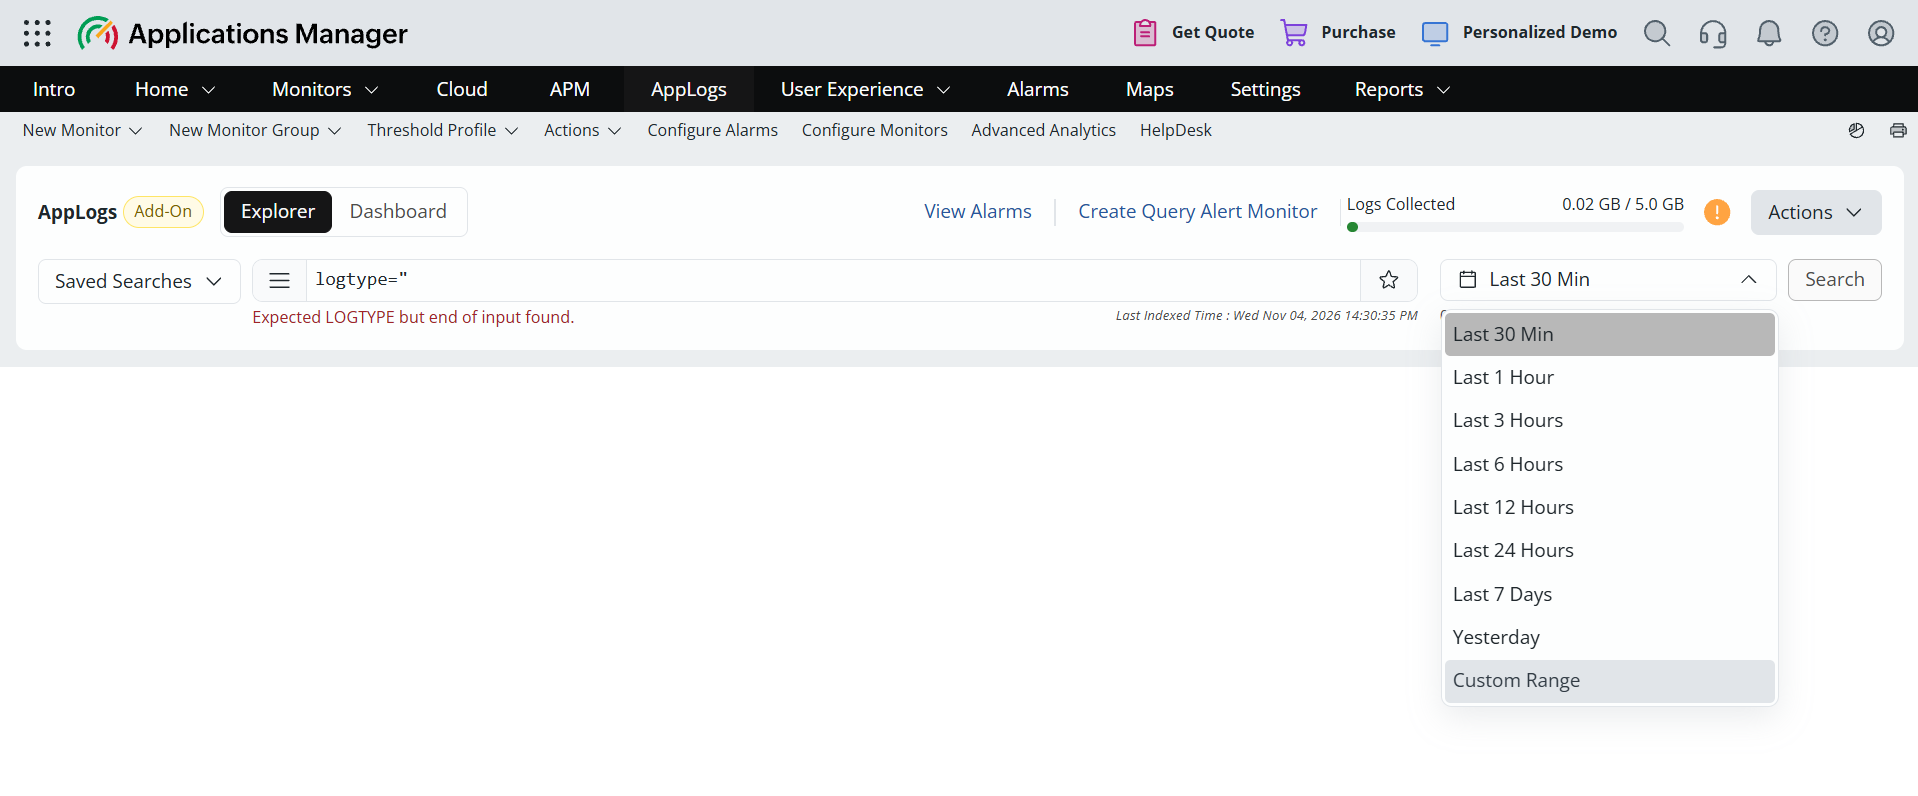
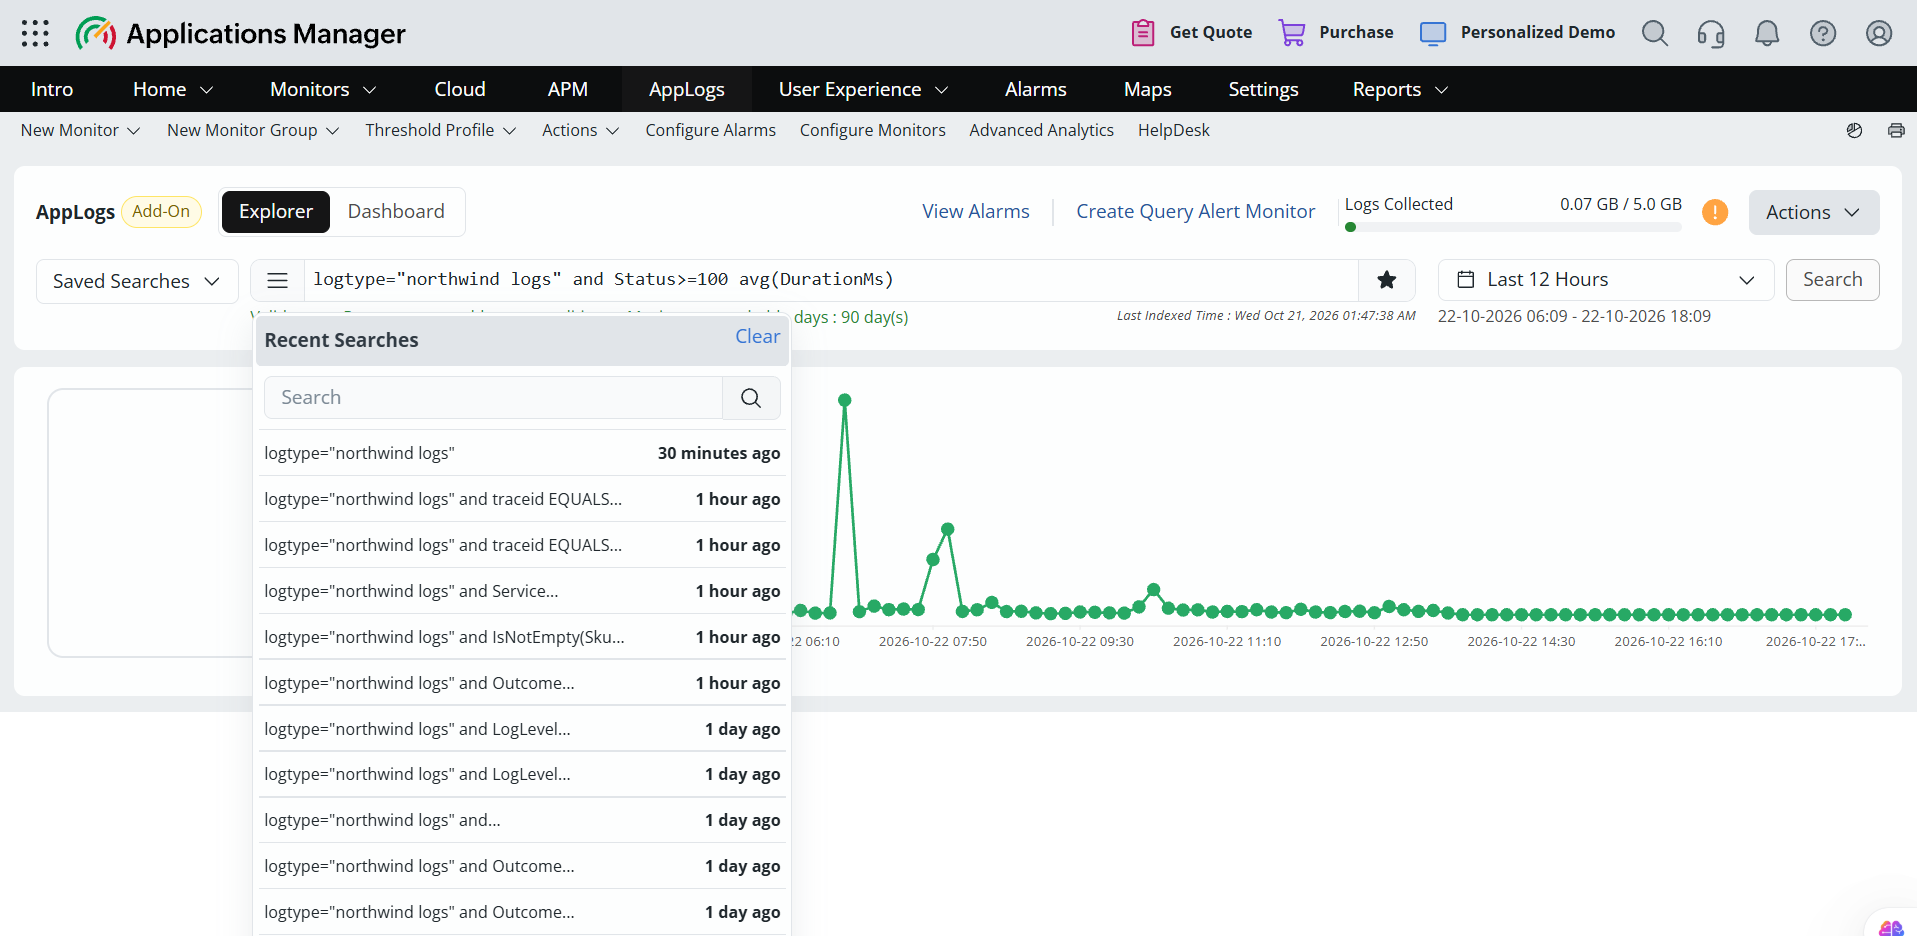
The Explorer page includes the following elements:
- Explorer and Dashboard tabs: The Explorer tab, described on this page, is where you search your logs. The Dashboard tab shows your saved searches as widgets. Refer to Log Explorer Dashboard.
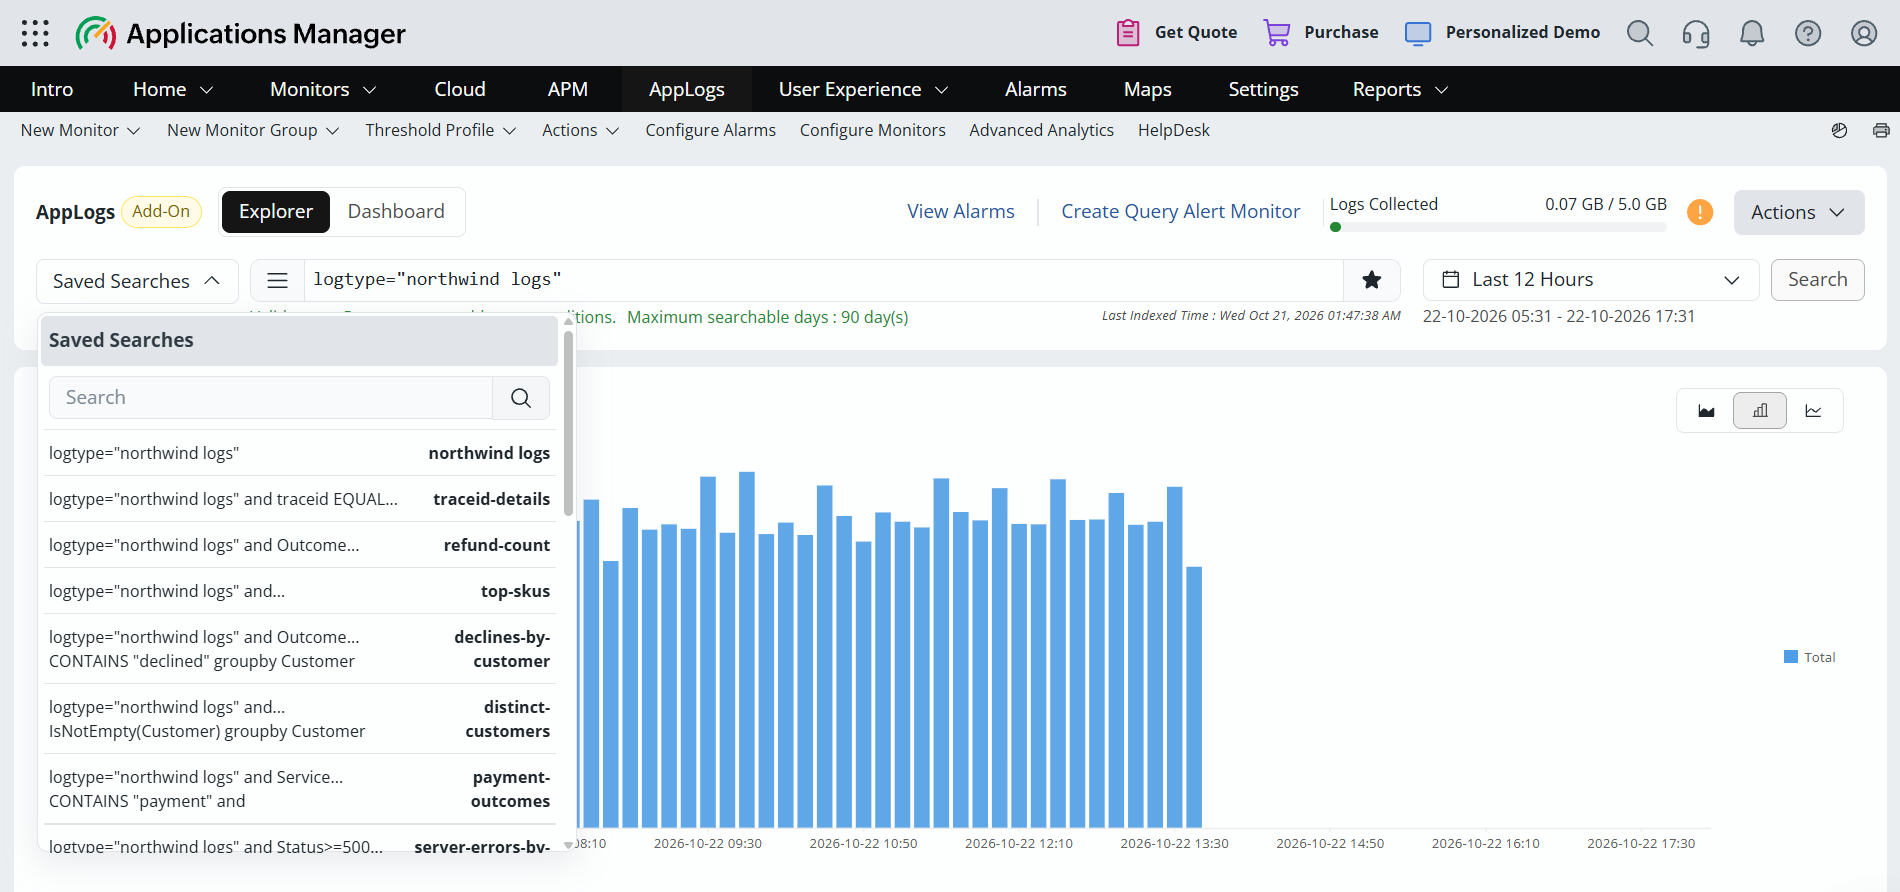
- Saved Searches: The drop-down at the left of the search bar. It lists the queries you have saved so that you can run them again. Refer to Saved searches.
- Recent searches: Lists the queries you have run recently, with the most recent first, so that you can run them again without typing them. Refer to Recent searches.
- Search bar: Enter your query here. The search bar validates your query as you type and shows the maximum number of days you can search, which depends on the log retention configured in AppLogs settings.
- Time range: Select the period to search, for example, Last 30 Min. The Last Indexed Time shows when the logs were last indexed.
- Search: Runs the query.
- Star icon: Marks the current query as a saved search. Refer to Saved searches.
- View Alarms: Shows the alarms generated from your AppLog Query Monitors.
- Create Query Alert Monitor: Opens the AppLog Query Monitor bulk configuration page, where you can create a monitor for a saved query.
- Actions: Includes the following options:
- Deploy Agent: Opens the FSO Agent page, where you can deploy the agent and manage the AppLogs sub-agent.
- Configurations: Opens the AppLogs Configurations page, where you manage log profiles, log types, and settings.
- Add Log Profile: Creates a log profile that defines which logs are collected and from where.
Searching logs
Every query starts with the log type to be searched, for example, logtype="SysLog". You can then add conditions, aggregation functions, grouping, and time slices to refine the results. The queries below are grouped by the kind of result they return. For every operator you can use, refer to the log query language reference.
Note: The field names used in the samples, such as level, application, or statuscode, depend on the log type you search.
Search queries
A search query returns the log entries that match your conditions. Build the conditions with these operators:
- Combine conditions:
and,or - Match or exclude a value:
EQUALS,!= - Match part of a text value:
CONTAINS,NOTCONTAINS,STARTSWITH,LIKE - Compare numbers:
<,>,<=,>= - Match or exclude a list of values:
in,notin - Check whether a field has a value:
IsEmpty,IsNotEmpty
The results show a bar graph of how the matching entries are distributed over the selected time range, along with a table of the log entries. Refer to Conditions and filters for the syntax of each operator.
| Goal | Sample query | Result |
|---|---|---|
| View all the entries of a log type | logtype="SysLog" | Every SysLog entry in the selected time range. |
| Find entries with a specific value | logtype="Windows Event Log" and level EQUALS "audit failure" | Only the audit failure entries. |
| Find entries that contain a value | logtype="SysLog" and application CONTAINS "systemd" | Entries from applications whose name contains systemd. Use NOTCONTAINS to exclude them instead. |
| Match either of two conditions | logtype="SysLog" and (application EQUALS "kernel" or application EQUALS "systemd") | Entries from either application. |
| Match a text pattern | logtype="SysLog" and application STARTSWITH "systemd" | Entries from applications whose name starts with systemd. Use LIKE with * for other patterns, such as application LIKE "sys*d". |
| Compare a numeric field | logtype="IIS Access Logs" and statuscode>=400 | Requests that returned an error status code. |
| Match any of several values | logtype="Windows Event Log" and computername in("workstation-01","db-server-02") | Entries from the two listed computers. |
| Exclude several values | logtype="Windows Event Log" and computername notin("workstation-01","hr-office-03") | Entries from every computer except the two listed. |
| Find entries where a field has no value | logtype="Windows Event Log" and IsEmpty(user) | Entries where the user field is empty. Use IsNotEmpty(user) for entries where it has a value. |
Count queries
A count query returns a single numeric value. Use count to get the number of matching entries, count_distinct to get the number of unique values of a field, or sum, avg, min, max, and sd to calculate on a numeric field. Each function is displayed as a value, and the graph beside it shows how that value changes over the selected time range.
| Goal | Sample query | Result |
|---|---|---|
| Count the audit failures for a particular user | logtype="Windows Event Log" and level EQUALS "audit failure" and user EQUALS "Auth" count | The total number of matching entries. |
| Count all the entries of a log type | logtype="SysLog" count | The total number of SysLog entries. |
| Find the lowest and highest values of a field | logtype="SysLog" min(processid) max(processid) | One value for each function, each with its own graph. |
| Count the unique values of a field | logtype="SysLog" COUNT_DISTINCT(application) | The number of distinct applications that logged entries. |
| Check the average request time and how much it varies | logtype="IIS Access Logs" avg(timetaken) sd(timetaken) | The average time taken and its standard deviation. |
| Add up the data returned | logtype="IIS Access Logs" sum(responsesize) | The total response size across the matching requests. |
Aggregation queries
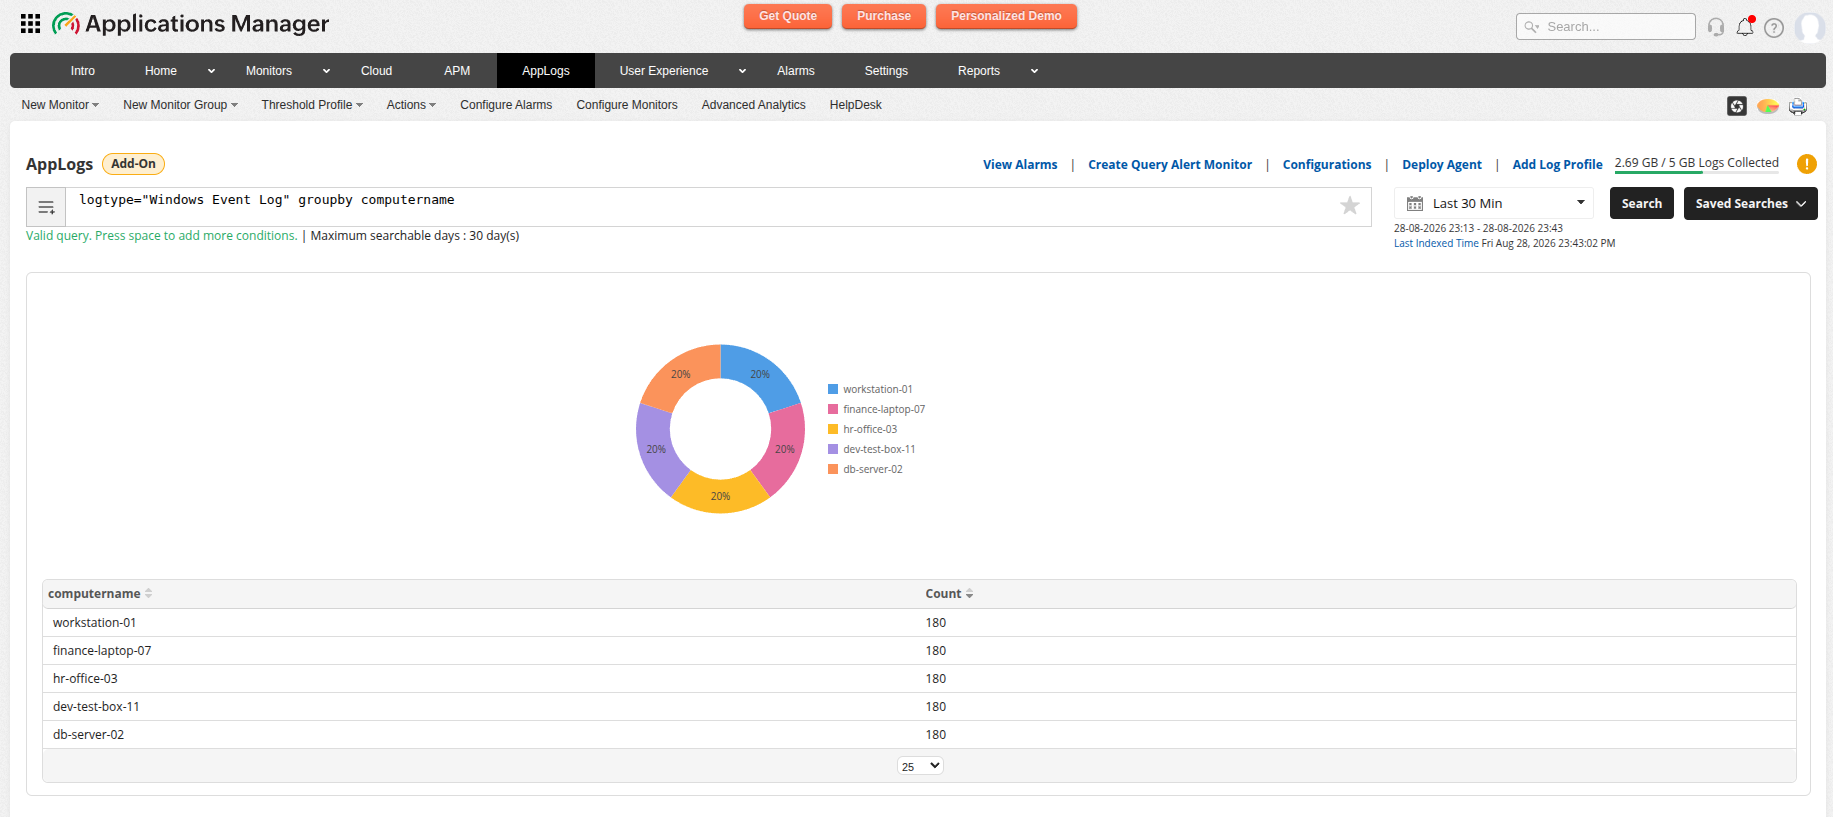
An aggregation query returns grouped or time-based results. Use groupby to group the entries by the values of a field, timeslice to split the results into time intervals, and limit to cap the number of groups returned. You can combine them with the aggregation functions to calculate values for each group or interval. Group-by results are displayed as a donut chart showing each group's share, along with a table that lists each group with its count or calculated value.
| Goal | Sample query | Result |
|---|---|---|
| See how entries are spread across computers | logtype="Windows Event Log" groupby computername | The number of entries for each computer. |
| Split up the error types on one server | logtype="Windows Event Log" and computername EQUALS "db-server-02" groupby level | The number of entries for each level on that server. |
| Find the busiest applications | logtype="SysLog" groupby application limit 5 | The number of entries for each application, limited to five groups. |
| Calculate values for each group | logtype="IIS Access Logs" avg(timetaken) max(timetaken) groupby stemuri | The average and maximum time taken for each requested URI. |
| See the volume over time | logtype="SysLog" timeslice 1h | The number of entries in each one-hour interval. |
| Group the volume over time | logtype="SysLog" groupby application timeslice 1d | The number of entries for each application, in one-day intervals. |
Search results at a glance
The way results are displayed depends on the type of query:
| Query type | Example | Results displayed |
|---|---|---|
| Search | logtype="SysLog" | A bar graph showing how the matching log entries are distributed over time, and a table of the log entries. |
| Count | logtype="SysLog" min(processid) max(processid) | A value for each function, along with a graph showing how the value changes over the selected time range. |
| Aggregation (group by) | logtype="Windows Event Log" groupby computername | A donut chart showing each group's share of the results, and a table listing each group with its count. |
Log query language reference
These are the operators you can use in AppLogs queries, grouped by what they do. Every query starts with logtype= followed by the name of a supported or custom log type.
Conditions and filters
Use these operators to build the conditions of a query. Put text values in double quotes, and use brackets to group conditions, for example, (application EQUALS "kernel" or application EQUALS "systemd").
| Operator | Purpose | Example |
|---|---|---|
| and | Match records that meet all the conditions | logtype="SysLog" and application EQUALS "kernel" |
| or | Match records that meet either condition | logtype="SysLog" and (application EQUALS "kernel" or application EQUALS "systemd") |
| equals | Match records where a field equals the value | application EQUALS "systemd" |
| != | Match records where a field does not equal the value | application!="cron" |
| contains | Match records where a text field contains the value | application CONTAINS "systemd" |
| notcontains | Match records where a text field does not contain the value | application NOTCONTAINS "cron" |
| startswith | Match records where a text field starts with the value | application STARTSWITH "systemd" |
| like | Match records against a pattern, where * stands for any characters | application LIKE "sys*d" |
| <, >, <=, >= | Compare the value of a numeric field | logtype="IIS Access Logs" and statuscode>=400 |
| in | Match records where the field has any of the listed values | computername in("workstation-01", "db-server-02") |
| notin | Match records where the field has none of the listed values | computername notin("workstation-01", "hr-office-03") |
| IsEmpty | Match records where a field has no value | IsEmpty(user) |
| IsNotEmpty | Match records where a field has a value | IsNotEmpty(user) |
| | | Passes the results of the query to the operator that follows it | logtype="SysLog" | include(application,message) |
Count and aggregation functions
| Function | Purpose | Example |
|---|---|---|
| count | Number of log entries that match the query | logtype="SysLog" count |
| count_distinct | Number of unique values of a field | COUNT_DISTINCT(application) |
| sum | Adds up the values of a numeric field | sum(responsesize) |
| avg | Average of a numeric field | avg(timetaken) |
| min | Minimum value of a numeric field | min(timetaken) |
| max | Maximum value of a numeric field | max(timetaken) |
| sd | Standard deviation of a numeric field | sd(responsesize) |
Grouping and time
| Operator | Purpose | Example |
|---|---|---|
| groupby | Groups the entries by the values of a field and counts them | logtype="SysLog" groupby application |
| timeslice | Splits the results into time intervals. Use m for minutes, h for hours, and d for days | logtype="SysLog" timeslice 2h |
| limit | Caps the number of groups returned by a group-by query | logtype="SysLog" groupby application limit 5 |
Points to remember:
countmust be the last operator in a query, and it can't be combined withgroupby,timeslice, or aggregation functions.countandcount_distinctcan't be used in the same query.- When you combine
groupbyandtimeslice, specifygroupbyfirst, and thentimeslice. - Use
limitonly with GROUP BY queries.
Saved searches
If you run the same query often, you can save it and reuse it later without typing it again. Saved searches can also be associated with an AppLog Query Monitor to raise alerts on the query results.
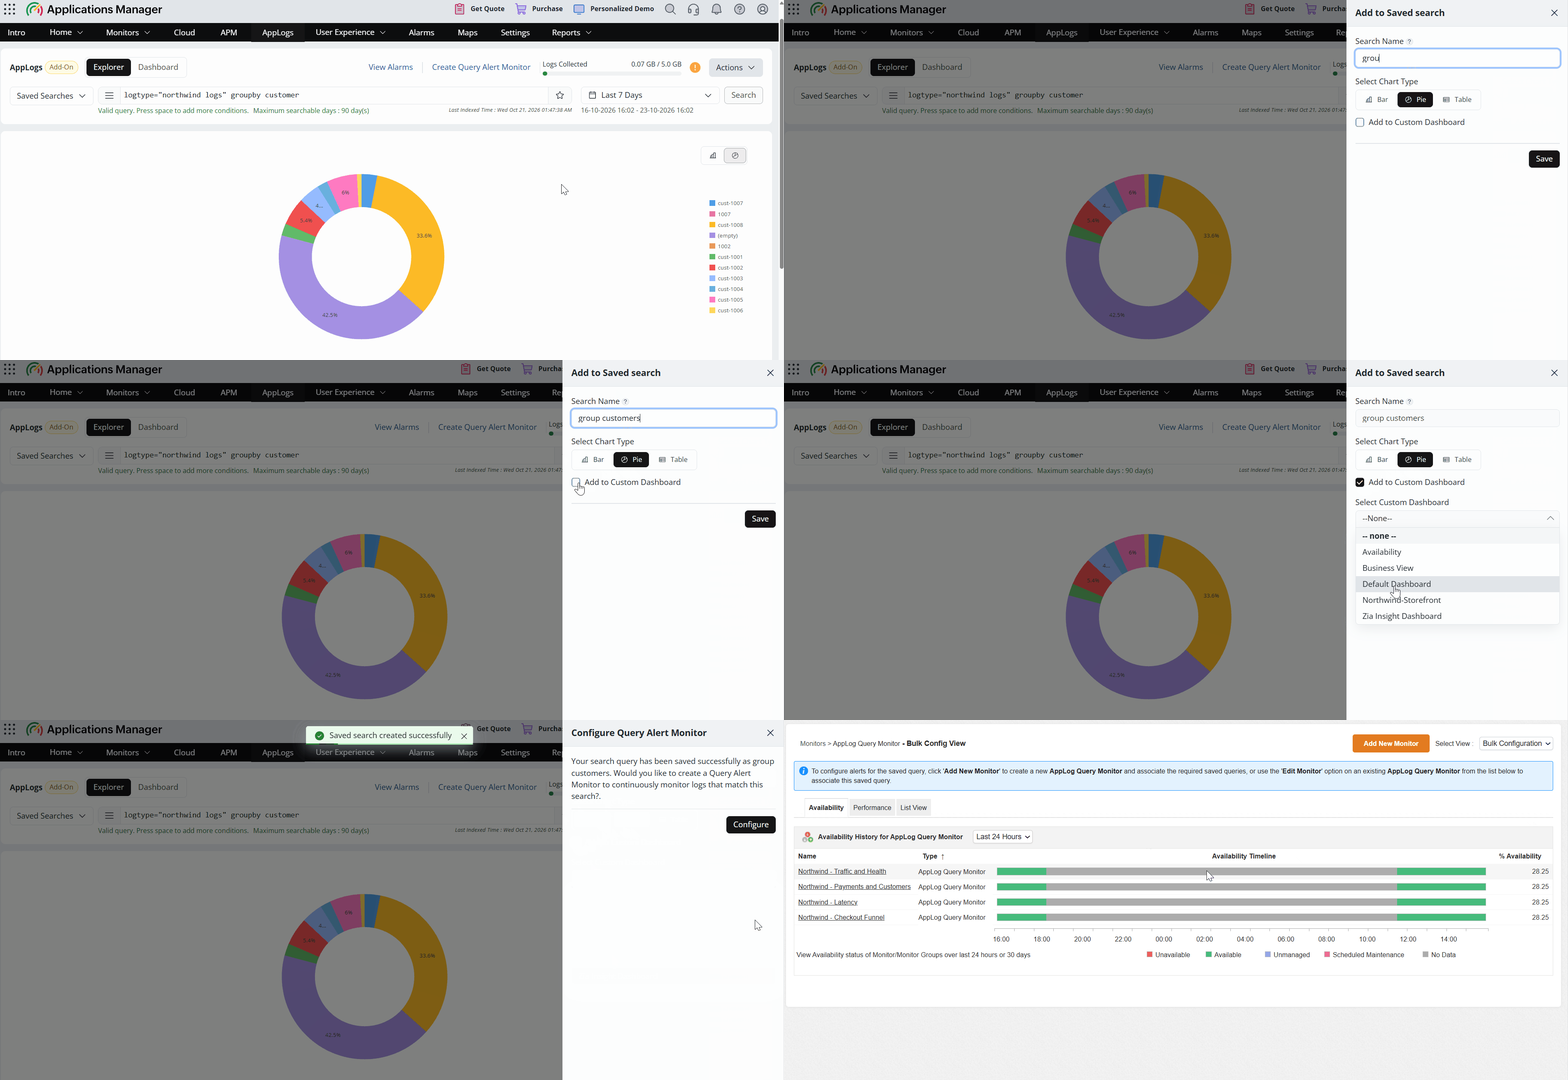
To save a search:
- Enter a valid query in the search bar.
- Click the star icon at the end of the search bar to mark the query as a saved search. The Add to Saved search panel opens.
- In Search Name, enter a name for the search.
- Under Select Chart Type, choose Bar, Line, or Area. This indicates how the saved query is depicted.
- (Optional) To show the saved query on one of your Applications Manager dashboards, select Add to Custom Dashboard, and then choose the dashboard from Select Custom Dashboard.
- Click Save.
To run a saved search again, select it from the Saved Searches drop-down at the left end of the search bar.
Note: A saved search that is associated with an AppLog Query Monitor cannot be deleted. This ensures that queries in use by a monitor are not modified or removed unintentionally.
Recent searches
Applications Manager automatically keeps track of the queries you have run recently so that you can run them again quickly.
- Up to 20 recent searches are stored.
- Duplicate queries are removed, and the most recent searches are listed first.
- Recent searches are independent of saved searches. A query does not need to be saved to appear in your recent searches.
Log Explorer Dashboard
Note: The Log Explorer Dashboard is available only from Applications Manager v183000 onwards.
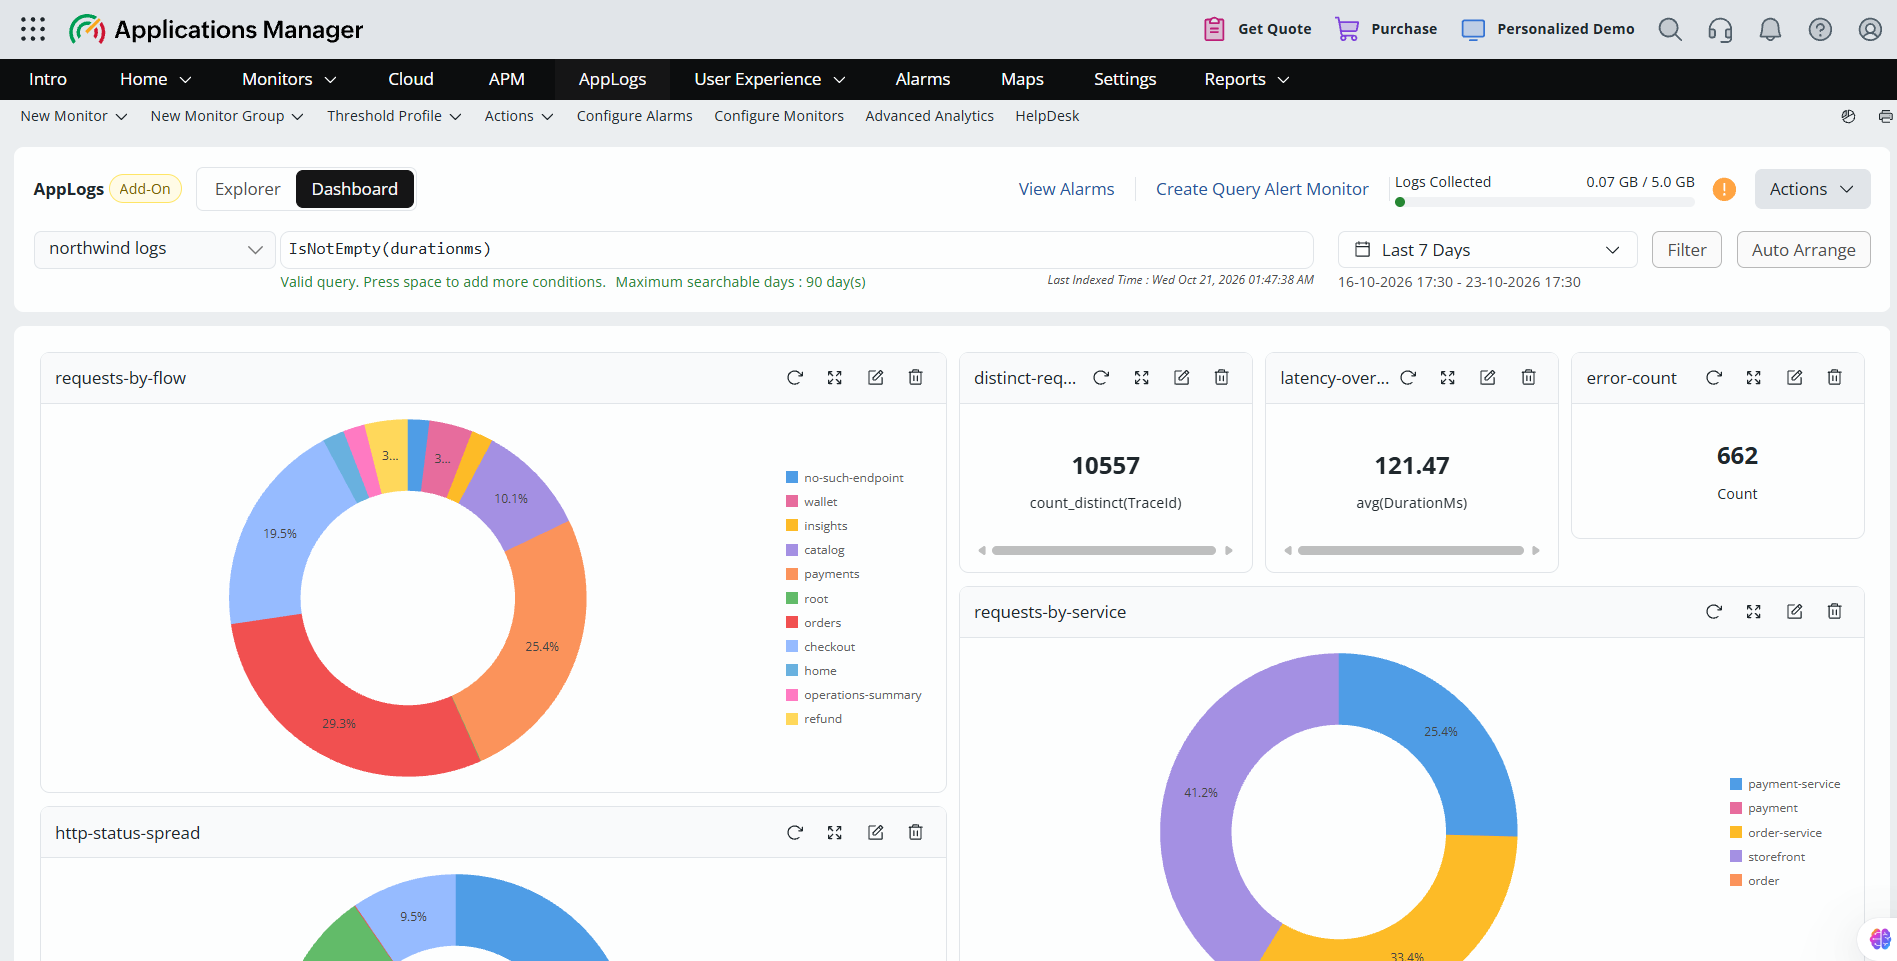
The Dashboard tab in the AppLogs page lets you view your saved searches as widgets, so you can keep an eye on key log metrics at a glance without running each query yourself.
To open it, go to the AppLogs tab and click Dashboard next to Explorer.
How widgets are added to the dashboard
- Default widgets: For the supported log types, Applications Manager automatically creates widgets on the dashboard using built-in queries. These built-in queries are internal, so they are not listed in the Saved Searches drop-down.
- Your saved searches: Every query you save is added to the dashboard automatically as a widget.
- Custom dashboards: To also show a saved search on one of your Applications Manager custom dashboards, select Add to Custom Dashboard while saving the query, and then choose the dashboard.
The dashboard includes the following elements:
- Log type: Select the log type whose widgets you want to view, for example, northwind logs.
- Filter: Enter a condition to narrow down the data shown in the widgets, and click Filter.
- Time range: Select the period for the widgets, for example, Last 12 Hours. The selected date range is shown below it, along with the Last Indexed Time.
- Auto Arrange: Arranges the widgets on the dashboard automatically.
Widgets
Each widget is named after the query it shows, and the way it is displayed depends on the query:
- Count and aggregation queries, such as
count,count_distinct(TraceId),sum(AmountCents), andavg(DurationMs), appear as a value. - Group-by queries appear as charts, such as donut and bar charts, showing how the result is spread across the groups.
Use the icons in the widget header to refresh, expand, edit, or delete the widget.
Alerting on saved log searches
You can configure alerts on a saved search by associating it with an AppLog Query Monitor. The monitor runs the saved query at every poll and raises alarms when the thresholds you configure are violated.
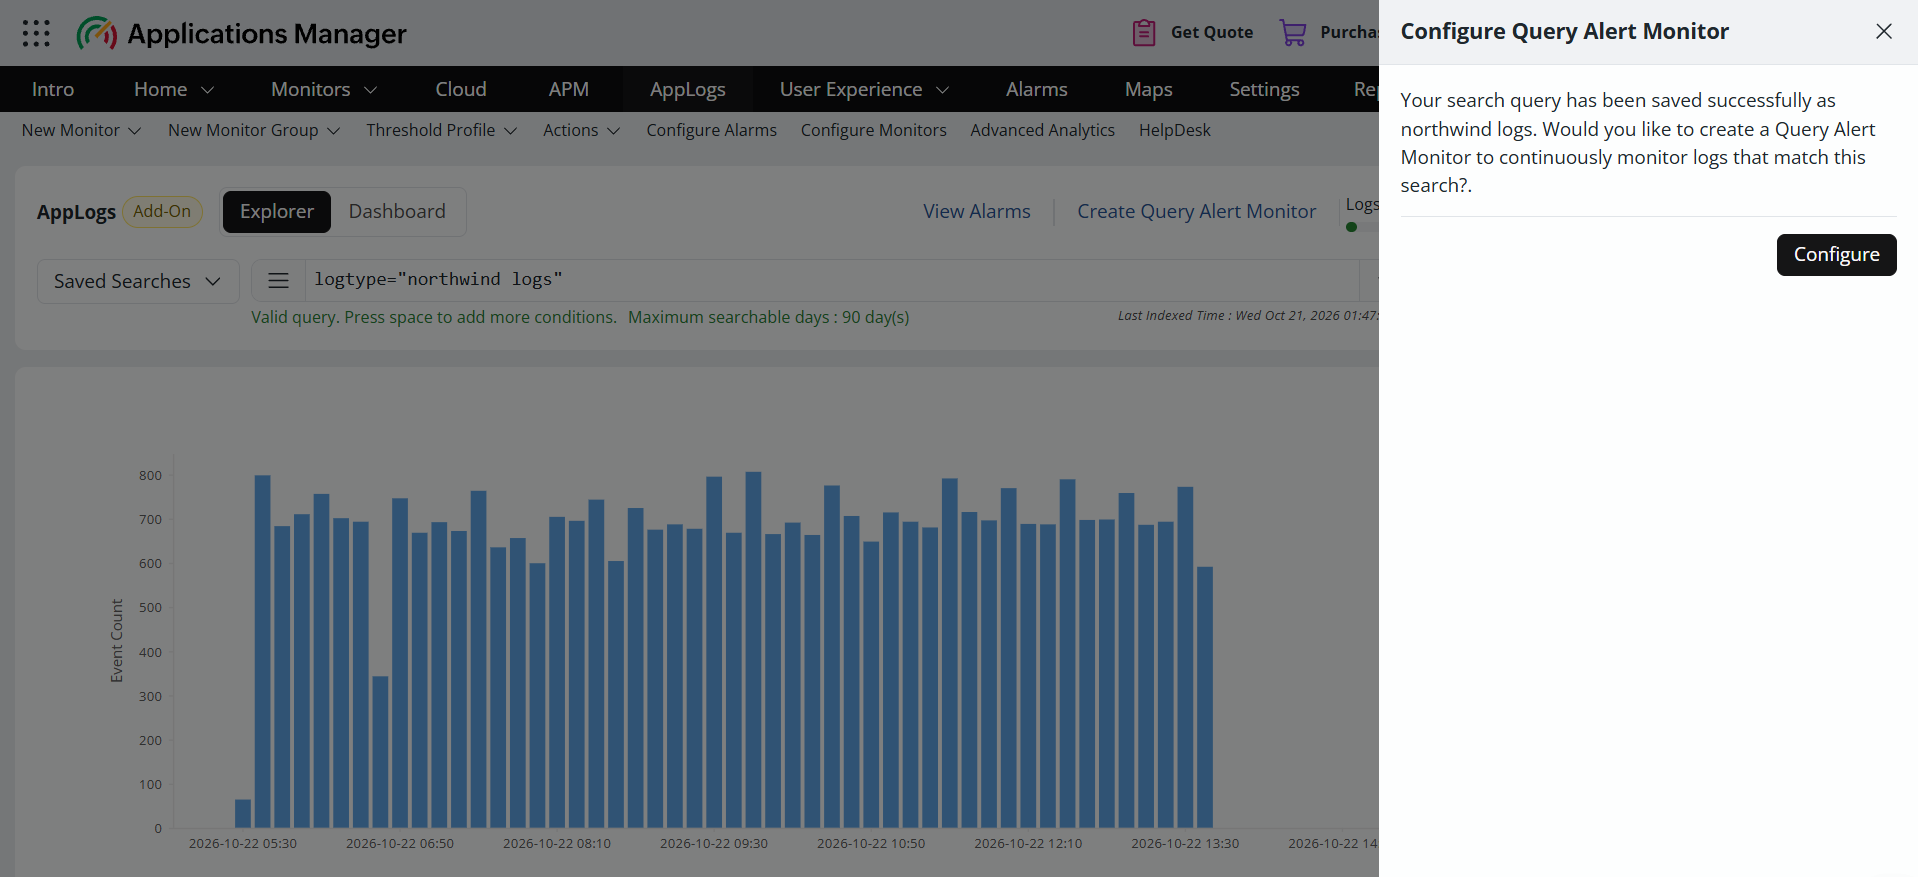
To get started, save the query. In the Configure Query Alert Monitor panel that appears after you save, click Configure. You can also click Create Query Alert Monitor at the top of the Explorer at any time. Either way, the AppLog Query Monitor bulk configuration page opens, where you can create a new monitor or associate the query with an existing one.
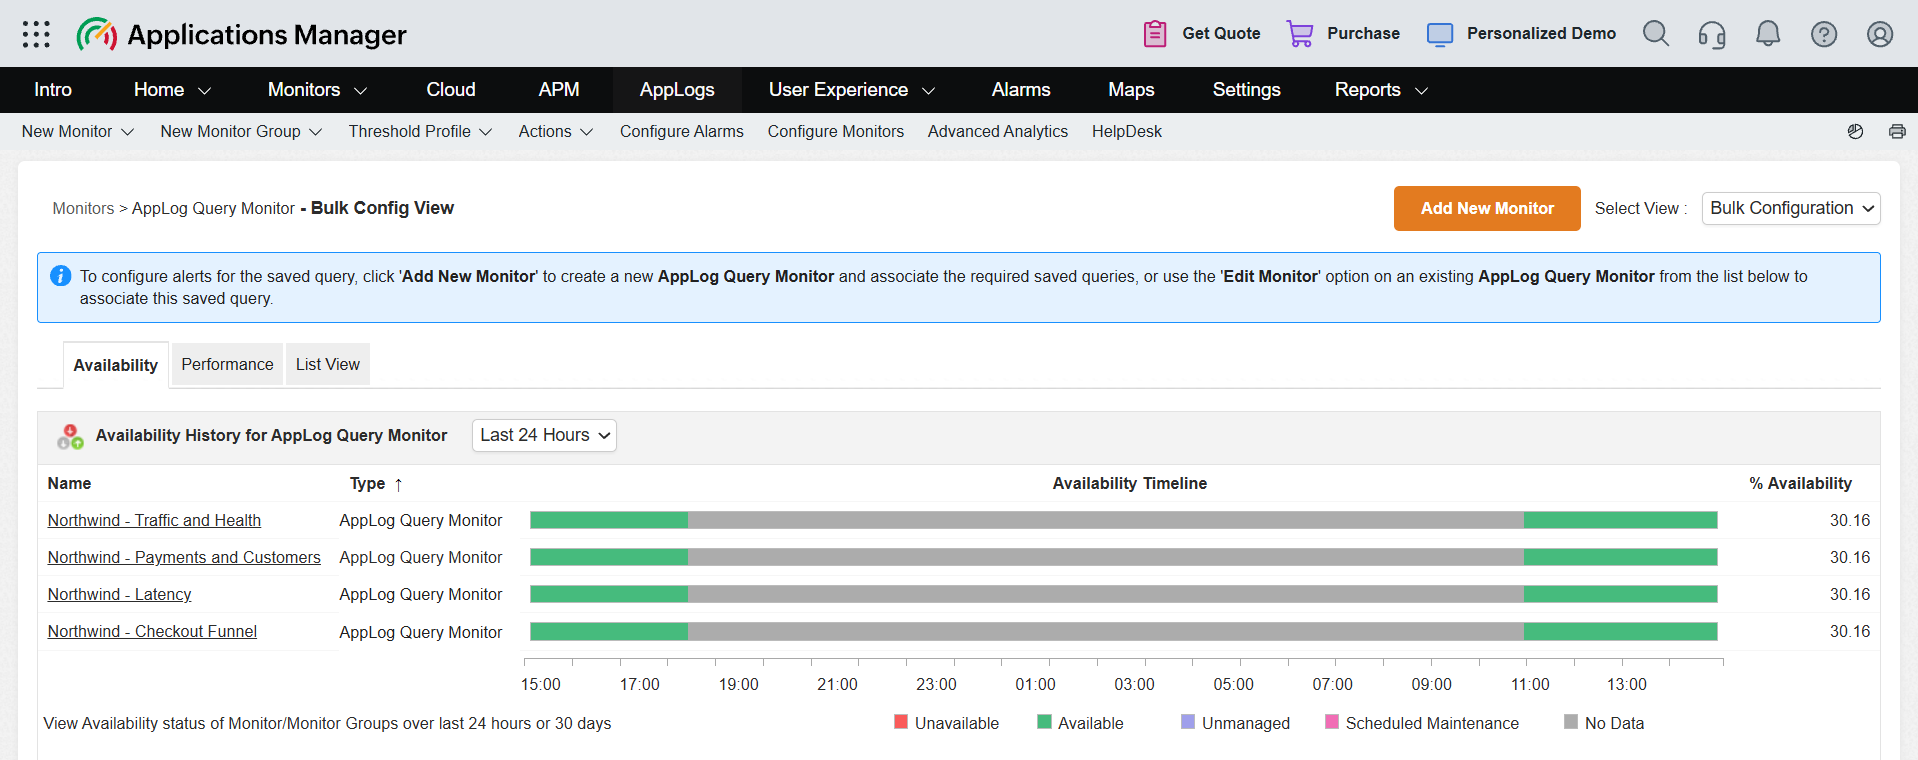
The thresholds and actions of an AppLog Query Monitor work like those of your other monitors. Refer to Associating Threshold and Action with Attributes for more details, and to AppLog Query Monitor for the complete steps.
Viewing alarms
To view the alarms generated from your AppLog Query Monitors, click View Alarms at the top of the Explorer. You can also view them from the Alarms tab. Refer to the Configuring and Viewing Alarms section in the AppLog Query Monitor help page for more information.