
Trusted by leading enterprises across the globe


One stop shop for comprehensive SQL performance monitoring
Discover and monitor
Applications Manager automatically detects and monitors your MSSQL databases and their dependencies-No configuration overhead.
Identify and analyze
Gain deep understanding of the performance of your MSSQL servers. Proactively track and analyze the metrics that matter the most.
Troubleshoot and resolve
Identify and resolve issues faster with comprehensive visibility into SQL statements. Set up alerts for anomalies, outliers and prevent outages with ease.
Tackle the most common causes of SQL performance problems with Applications Manager
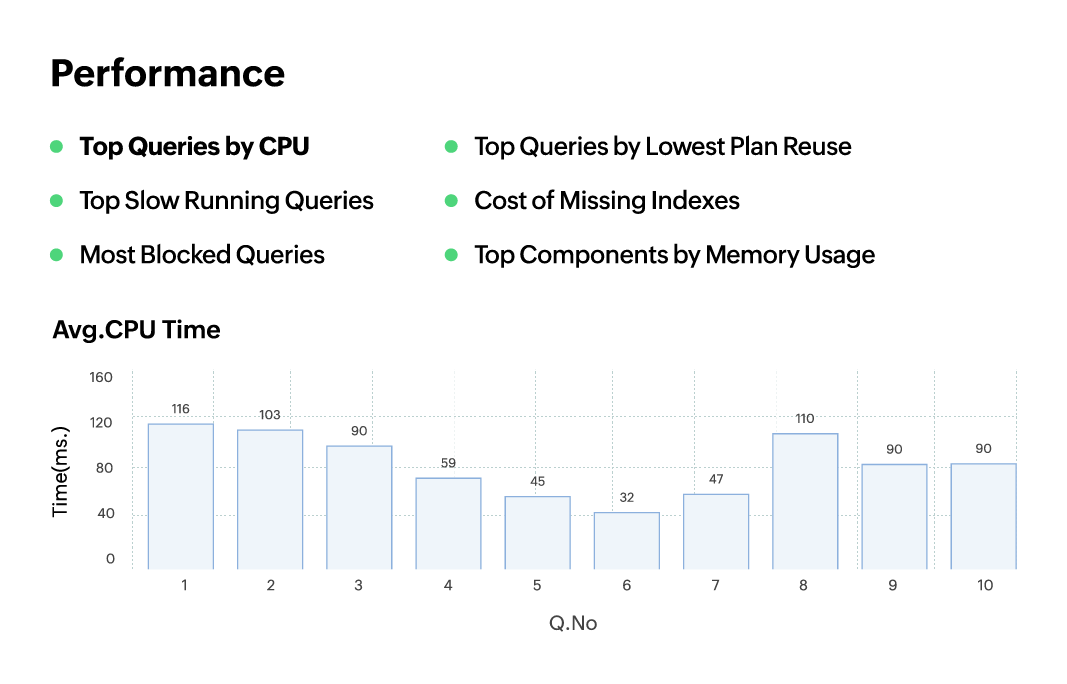
Poorly optimized queries
Poor queries are one of the top SQL performance killers. They lead to prolonged execution times, causing delays in application responsiveness and user experience. Inefficient queries also contribute to database bottlenecks, negatively impacting overall system performance and scalability.
Uncover slow running queries, understand the reason behind delays and the level of impact on server performance, and optimize overall query performance.
Delayed response times
There are many factors that can impact the performance of a SQL server. It's wise to check when a query starts running sluggishly to understand whether the problem lies with the database, or the server on which it is running.
Track issues to their root cause, extensively monitor jobs, sessions, backups, replication, locks, and latches to identify SQL processes that cause delays in the overall response time.
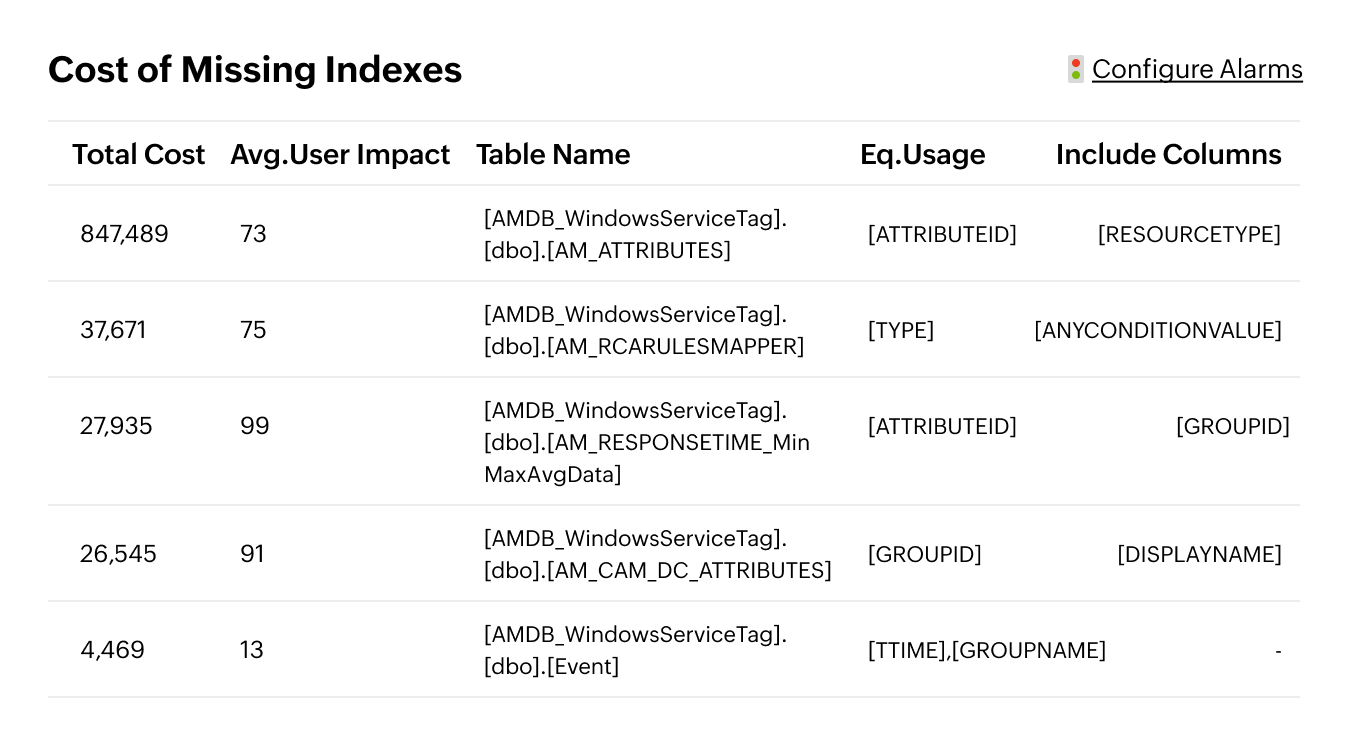
Fragmented indexes
There are many negative impacts resulting from fragmented indexes. They lead to slower query execution times, concurrency issues, and increased resource usage, to name a few.
Continuously monitor the state of the indexes in real time. Analyze trends in fragmentation over time, identify patterns, and understand which index needs your attention.
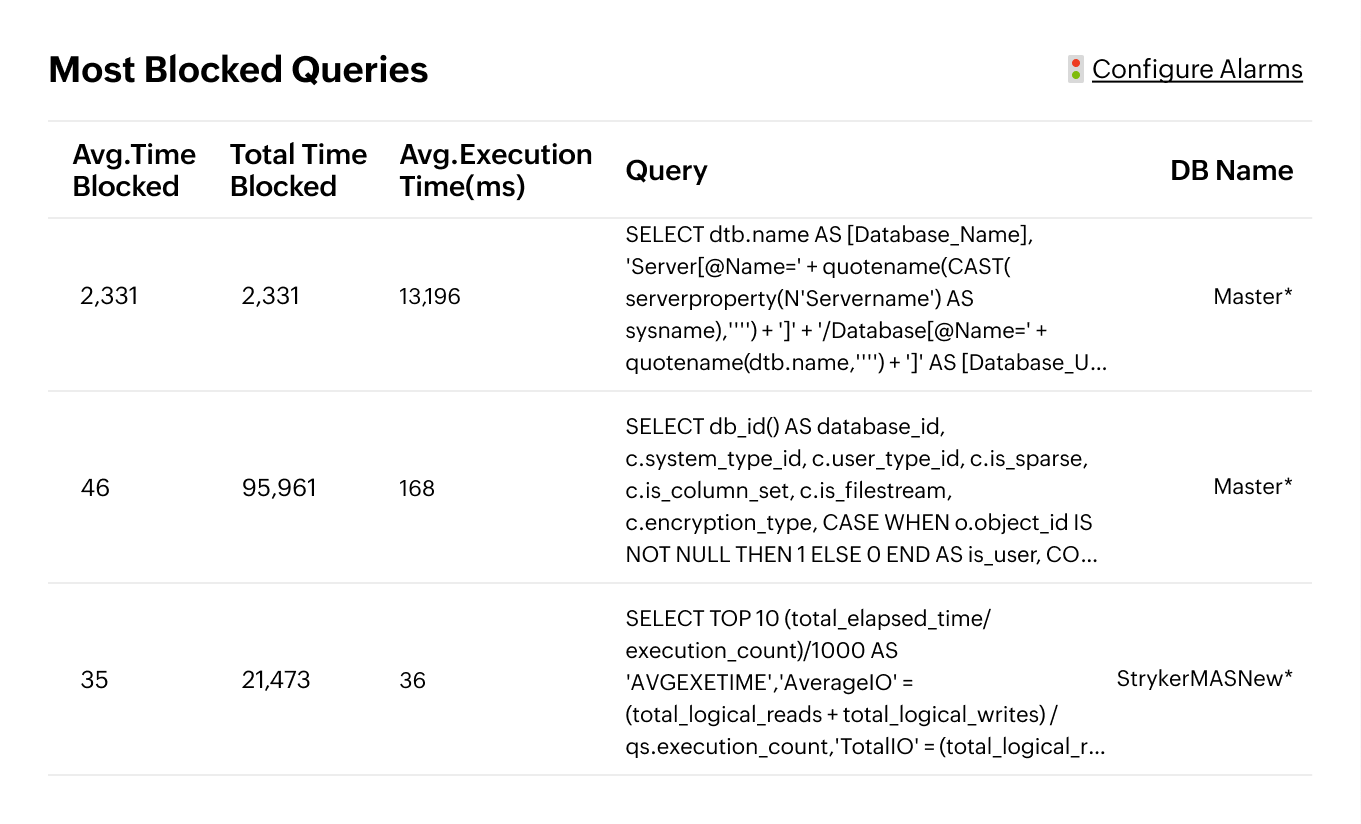
Blocked sessions and time-outs
As multiple sessions contend for resources, blocked sessions reduce transaction throughput, and introduce delays in query execution. The resulting time-outs can further contribute to data inconsistency, especially when transactions are interrupted or rolled back.
Gain detailed insights into blocked sessions and time-outs with instant alerts. Track query response times and analyze time-out patterns for a comprehensive understanding of the impact on overall system health. Identify and resolve issues efficiently by delving into transaction and query details causing blocks.
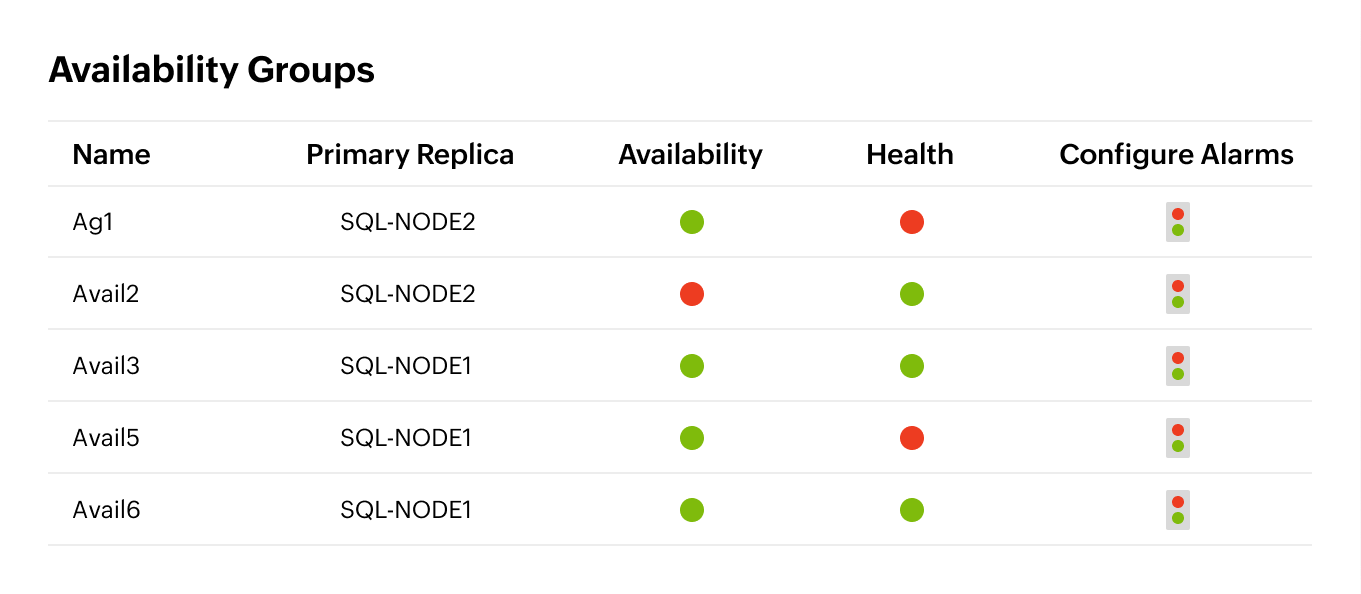
Availability issues and memory overload
Ensuring round-the-clock availability of the core data storage systems, as well as the secondary backups and replicas, is tedious. Memory overloads can cause performance degradation as the server struggles to manage resources.
Increase the overall availability of your database network with AlwaysOn availability groups. Track backup expiry information, check the synchronization modes of replicas, their data delivery speed and their readiness in case of a failover. Ensure that enough memory is allocated to your SQL database server for cache, replication, query, buffer, and backup. Instantly receive alerts when thresholds are breached.
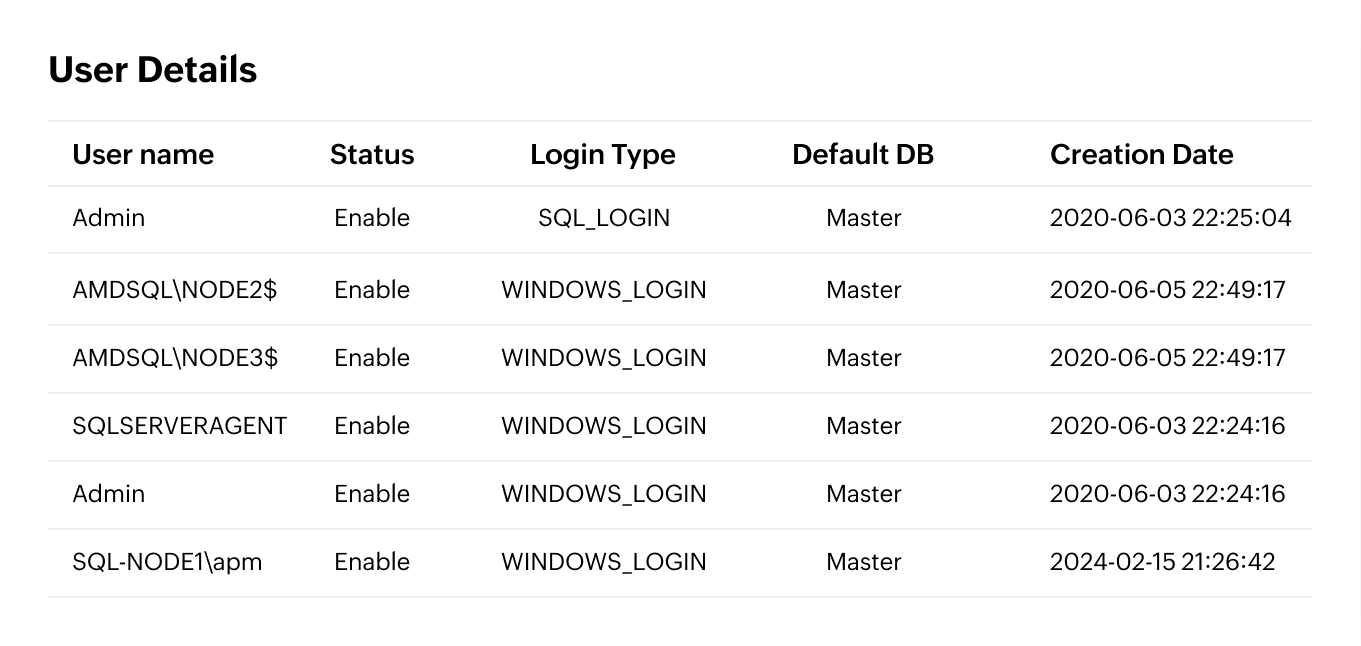
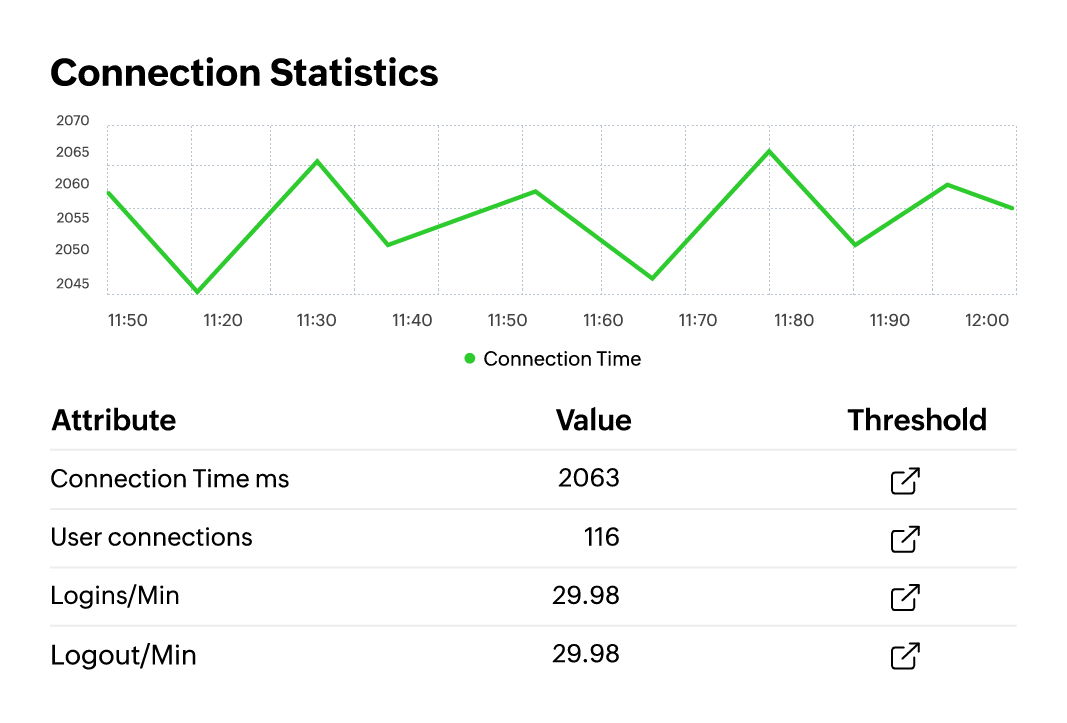
Database connectivity
Database connectivity issues often occur when there are too many active users. This can delay any operations that are dependent on database interactions, cause application downtime, and lead to user frustration.
Efficiently monitor the database server connections, identifying those in a waiting state. Identify which application or user is imposing the most load on the database server and ensure reliable database connectivity.
Benefits of monitoring SQL with Applications Manager
Start your free trial
Track 200+ key metrics
Seamlessly track KPIs like CPU and memory utilization, locks, indexes, SQL queries, locks, buffer and cache, jobs, sessions, replication details, backups, availability groups, and more.
Keep tabs on DB growth
Proactively monitor crucial database attributes, including the total and used sizes of both data and log files. Identify and resolve potential issues like disk space shortages, excessive resource usage, and more.
Leverage built-in AI
Drill down to the root cause of issues and avoid alert storms. Leverage Al-powered alerts and get notified via multiple channels like SMS, email, and Slack. Forecast resource utilization with efficient ML-based reporting.
Identify problematic queries
Filter queries based on CPU time, read/write rate, queue wait time, execution rate, block rate, query plan usage, and memory usage statistics. Identify the slow-running queries, analyze, and optimize accordingly.
Loved by customers and critics all over the world

The best thing about ManageEngine Applications Manager is that you can monitor all your IT infrastructure such as the servers, databases from one place. Using this tool will save your IT team a lot of work.
The tool provides a lot of insights into the performance of my database, which has been helpful in identifying bottlenecks.

With a single view of everything from servers to databases, monitoring our application infrastructure has become simple. Applications Manager has made our lives way easier. The tool helps us stay aware of the performance of our critical applications 24x7.

ManageEngine recognized in the 2024 Gartner® Magic Quadrant™ for Application Performance Monitoring and Observability.
Learn more
ManageEngine recognized as a Customers' Choice in the 2024 Gartner Peer Insights™ Voice of the Customer for Application Performance Monitoring and Observability report.
Learn moreLet us take care of your IT while you take care of business
Get a 30-day, free trial. No credit card required.
