Switch PoE monitoring capabilities now in OpUtils
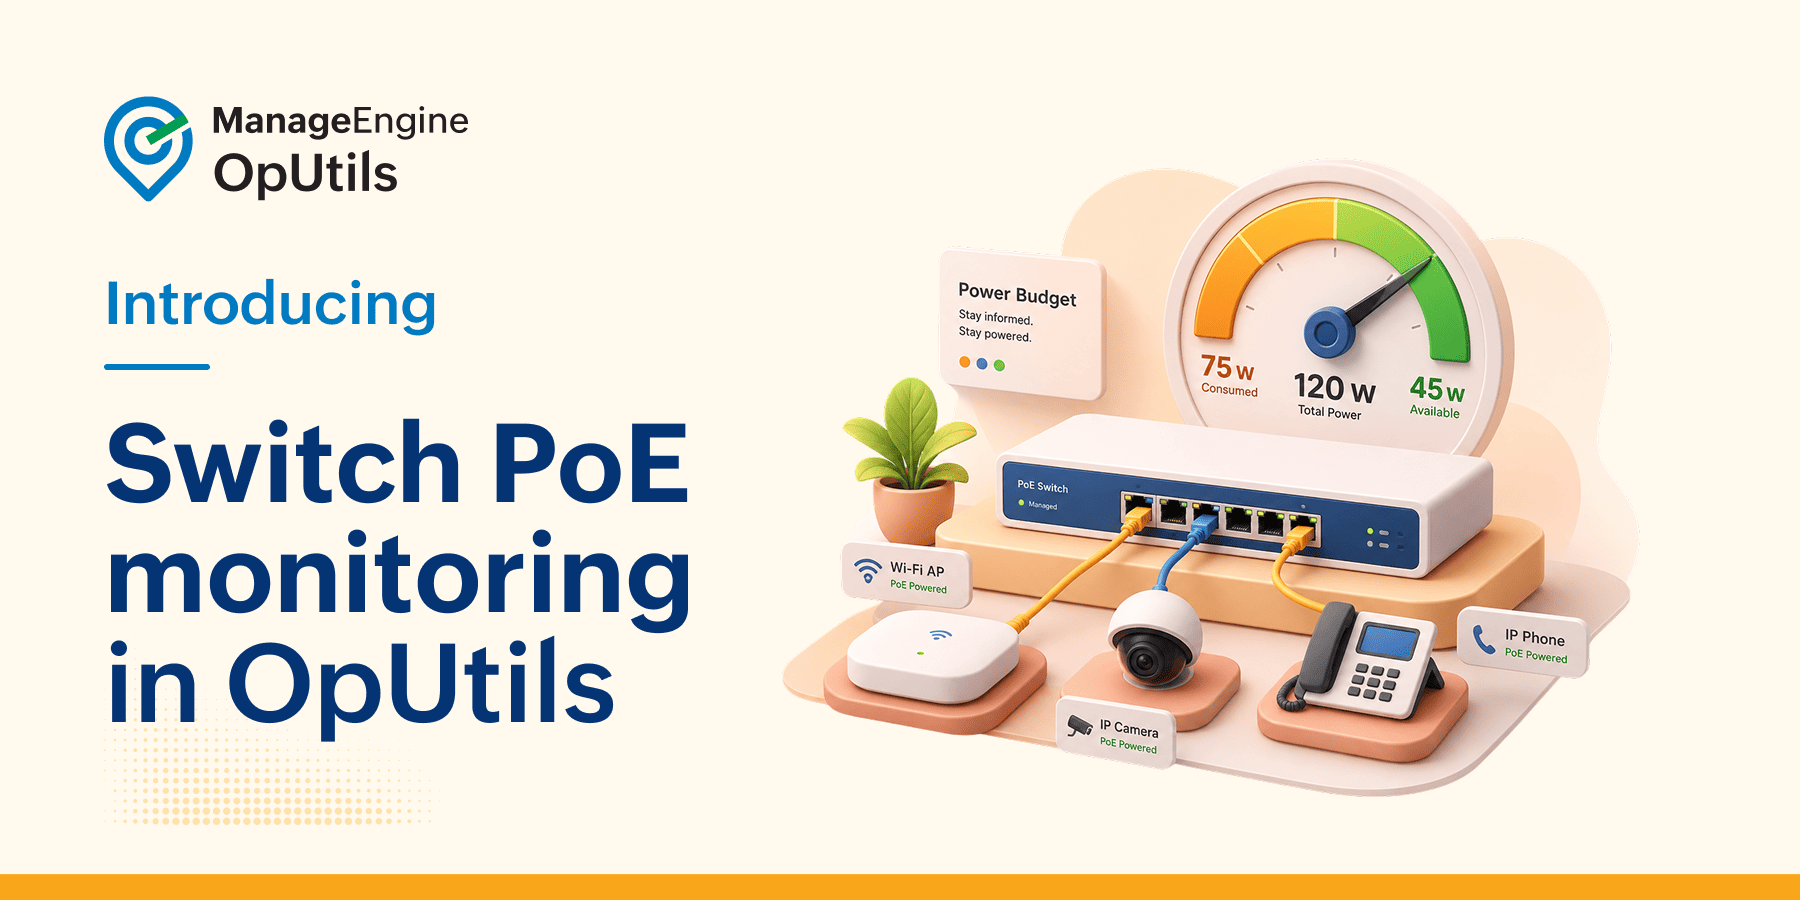
Introducing switch Power over Ethernet (PoE) monitoring in ManageEngine OpUtils, enabling administrators to track switch power budgets and port-level PoE metrics directly from the same console used for DNS, DHCP, IPAM (DDI), and switch port management.
What's new: PoE monitoring directly in OpUtils
Here's how OpUtils handles switch PoE monitoring.
Discovery of PoE switches
OpUtils helps discover PoE-capable switches across the network using SNMP, classifies them, and maintains an up-to-date inventory. As new PoE switches are added to the network, they're automatically identified and brought into the same console used for everyday DDI operations.
Monitor switch power budgets
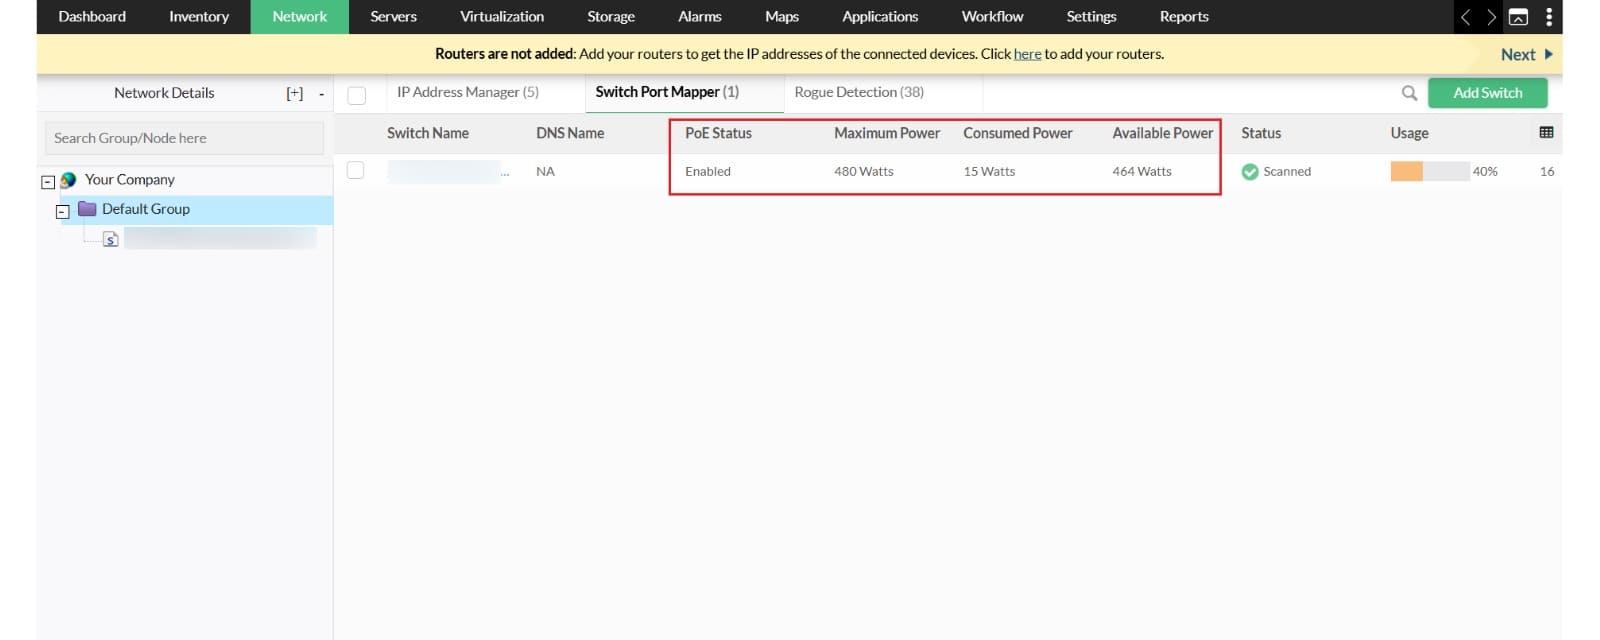
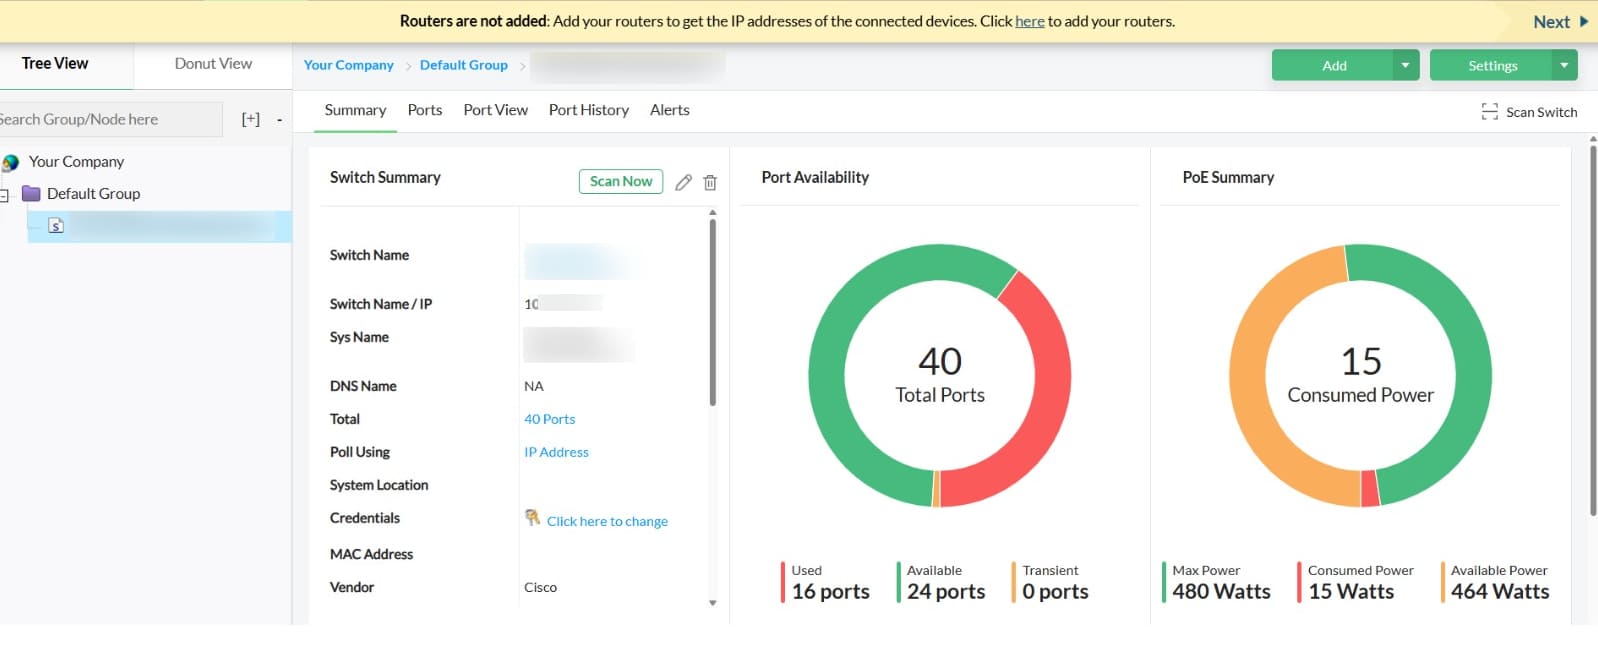
OpUtils tracks the maximum, consumed, and available PoE power for every monitored switch from a centralized dashboard. Administrators can view remaining power headroom at a glance, helping them understand capacity and make informed decisions before deploying additional powered devices rather than discovering exhaustion after a device drops offline.
Port-level PoE metrics
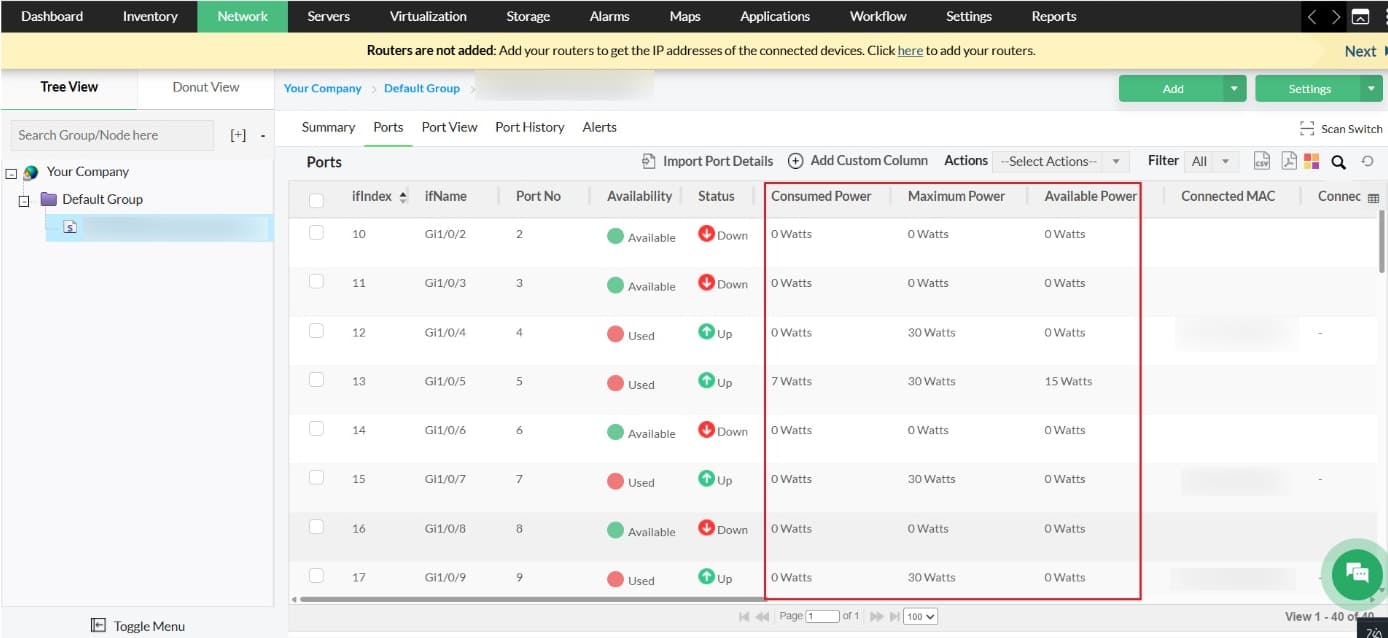
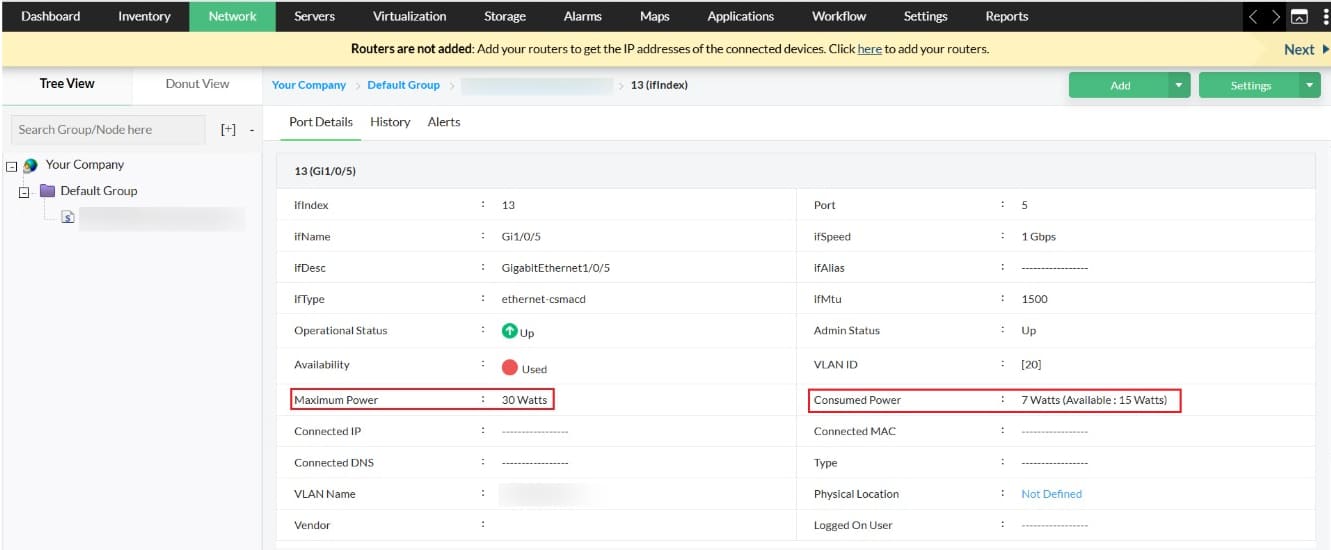
OpUtils lets administrators drill down into individual ports to view PoE status and power consumption. This port-level visibility makes it easier to spot unexpected power spikes, troubleshoot powered devices such as cameras, access points, or VoIP phones, and verify that power is being delivered as expected.
Visualize PoE utilization
The switch summary page provides a real-time view of PoE capacity with a donut chart that compares consumed and available power, giving administrators instant visibility into remaining power headroom. Complementing this, a dashboard widget highlights the top 10 power-consuming switches, helping teams quickly identify switches approaching their power budget and take proactive action before power-related service disruptions occur.
Easy integration with OpManager
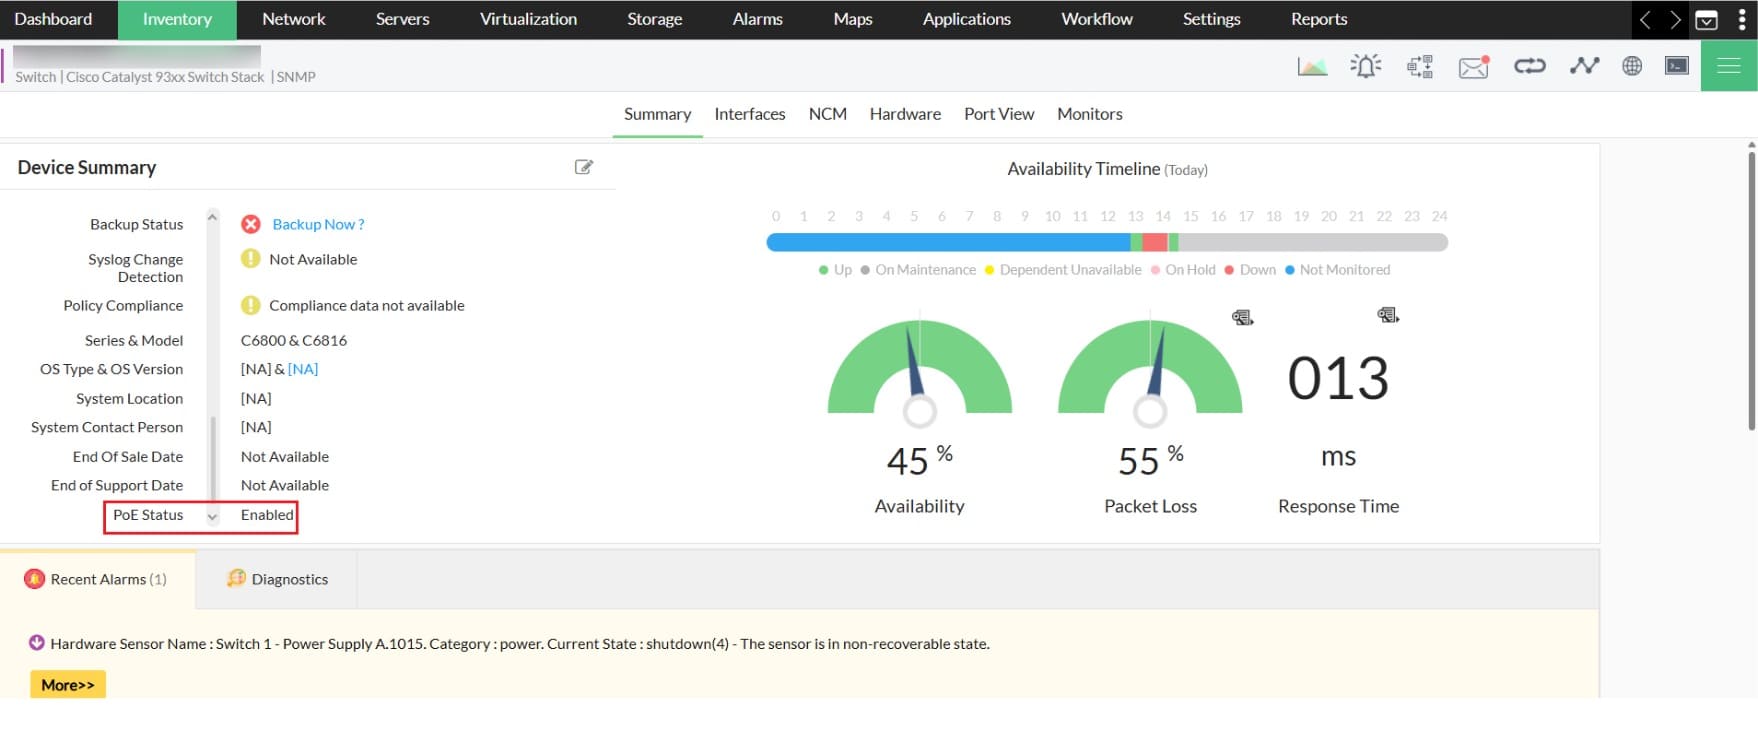
OpUtils displays PoE metrics collected by ManageEngine OpManager, which continuously polls supported switches over SNMP. This means PoE visibility appears in OpUtils without any additional polling configuration. For teams that need more, integrating with OpManager unlocks threshold-based alerts, customizable polling intervals, and historical reporting for deeper PoE analysis.
Supported PoE switch vendors: Cisco | Juniper Networks | Huawei | Hewlett Packard Enterprise | NETGEAR | Dell Technologies | Arista Networks | Extreme Networks
Why switch PoE monitoring in OpUtils matters
PoE switches introduce a challenge that traditional switches don't have: a shared power budget. As more powered devices come online, that budget gets consumed, and when it runs out, devices can lose power with no obvious warning. What looks like a camera or access point failure to the help desk is often PoE power exhaustion.
By bringing PoE visibility into OpUtils alongside switch port management, IP address data, and DNS and DHCP records, network teams get a single console to investigate power issues, correlate them with connected devices and ports, and act before problems escalate, without switching between multiple tools.
Switch PoE monitoring strengthens OpUtils as a unified network management console, bringing power infrastructure visibility into the same workflows administrators already use for DDI.
Download a free, 30-day trial to explore switch PoE monitoring in OpUtils, or schedule a personalized demo to see it in action.