Dashboards
The Dashboards home page contains dashboards with a graphical display of real-time information, consolidated and arranged in a single view, so that it can be easily monitored. Dashboards display various statistical data related to number of Requests, Changes, Problems, Assets, Software, POs and Contracts based on various criteria. Account based dashboards are available as well.
Note: Information displayed on the dashboards depends on the sites, accounts and roles associated with the Technicians.
The Dashboards page contains the following elements by default:
Helpdesk
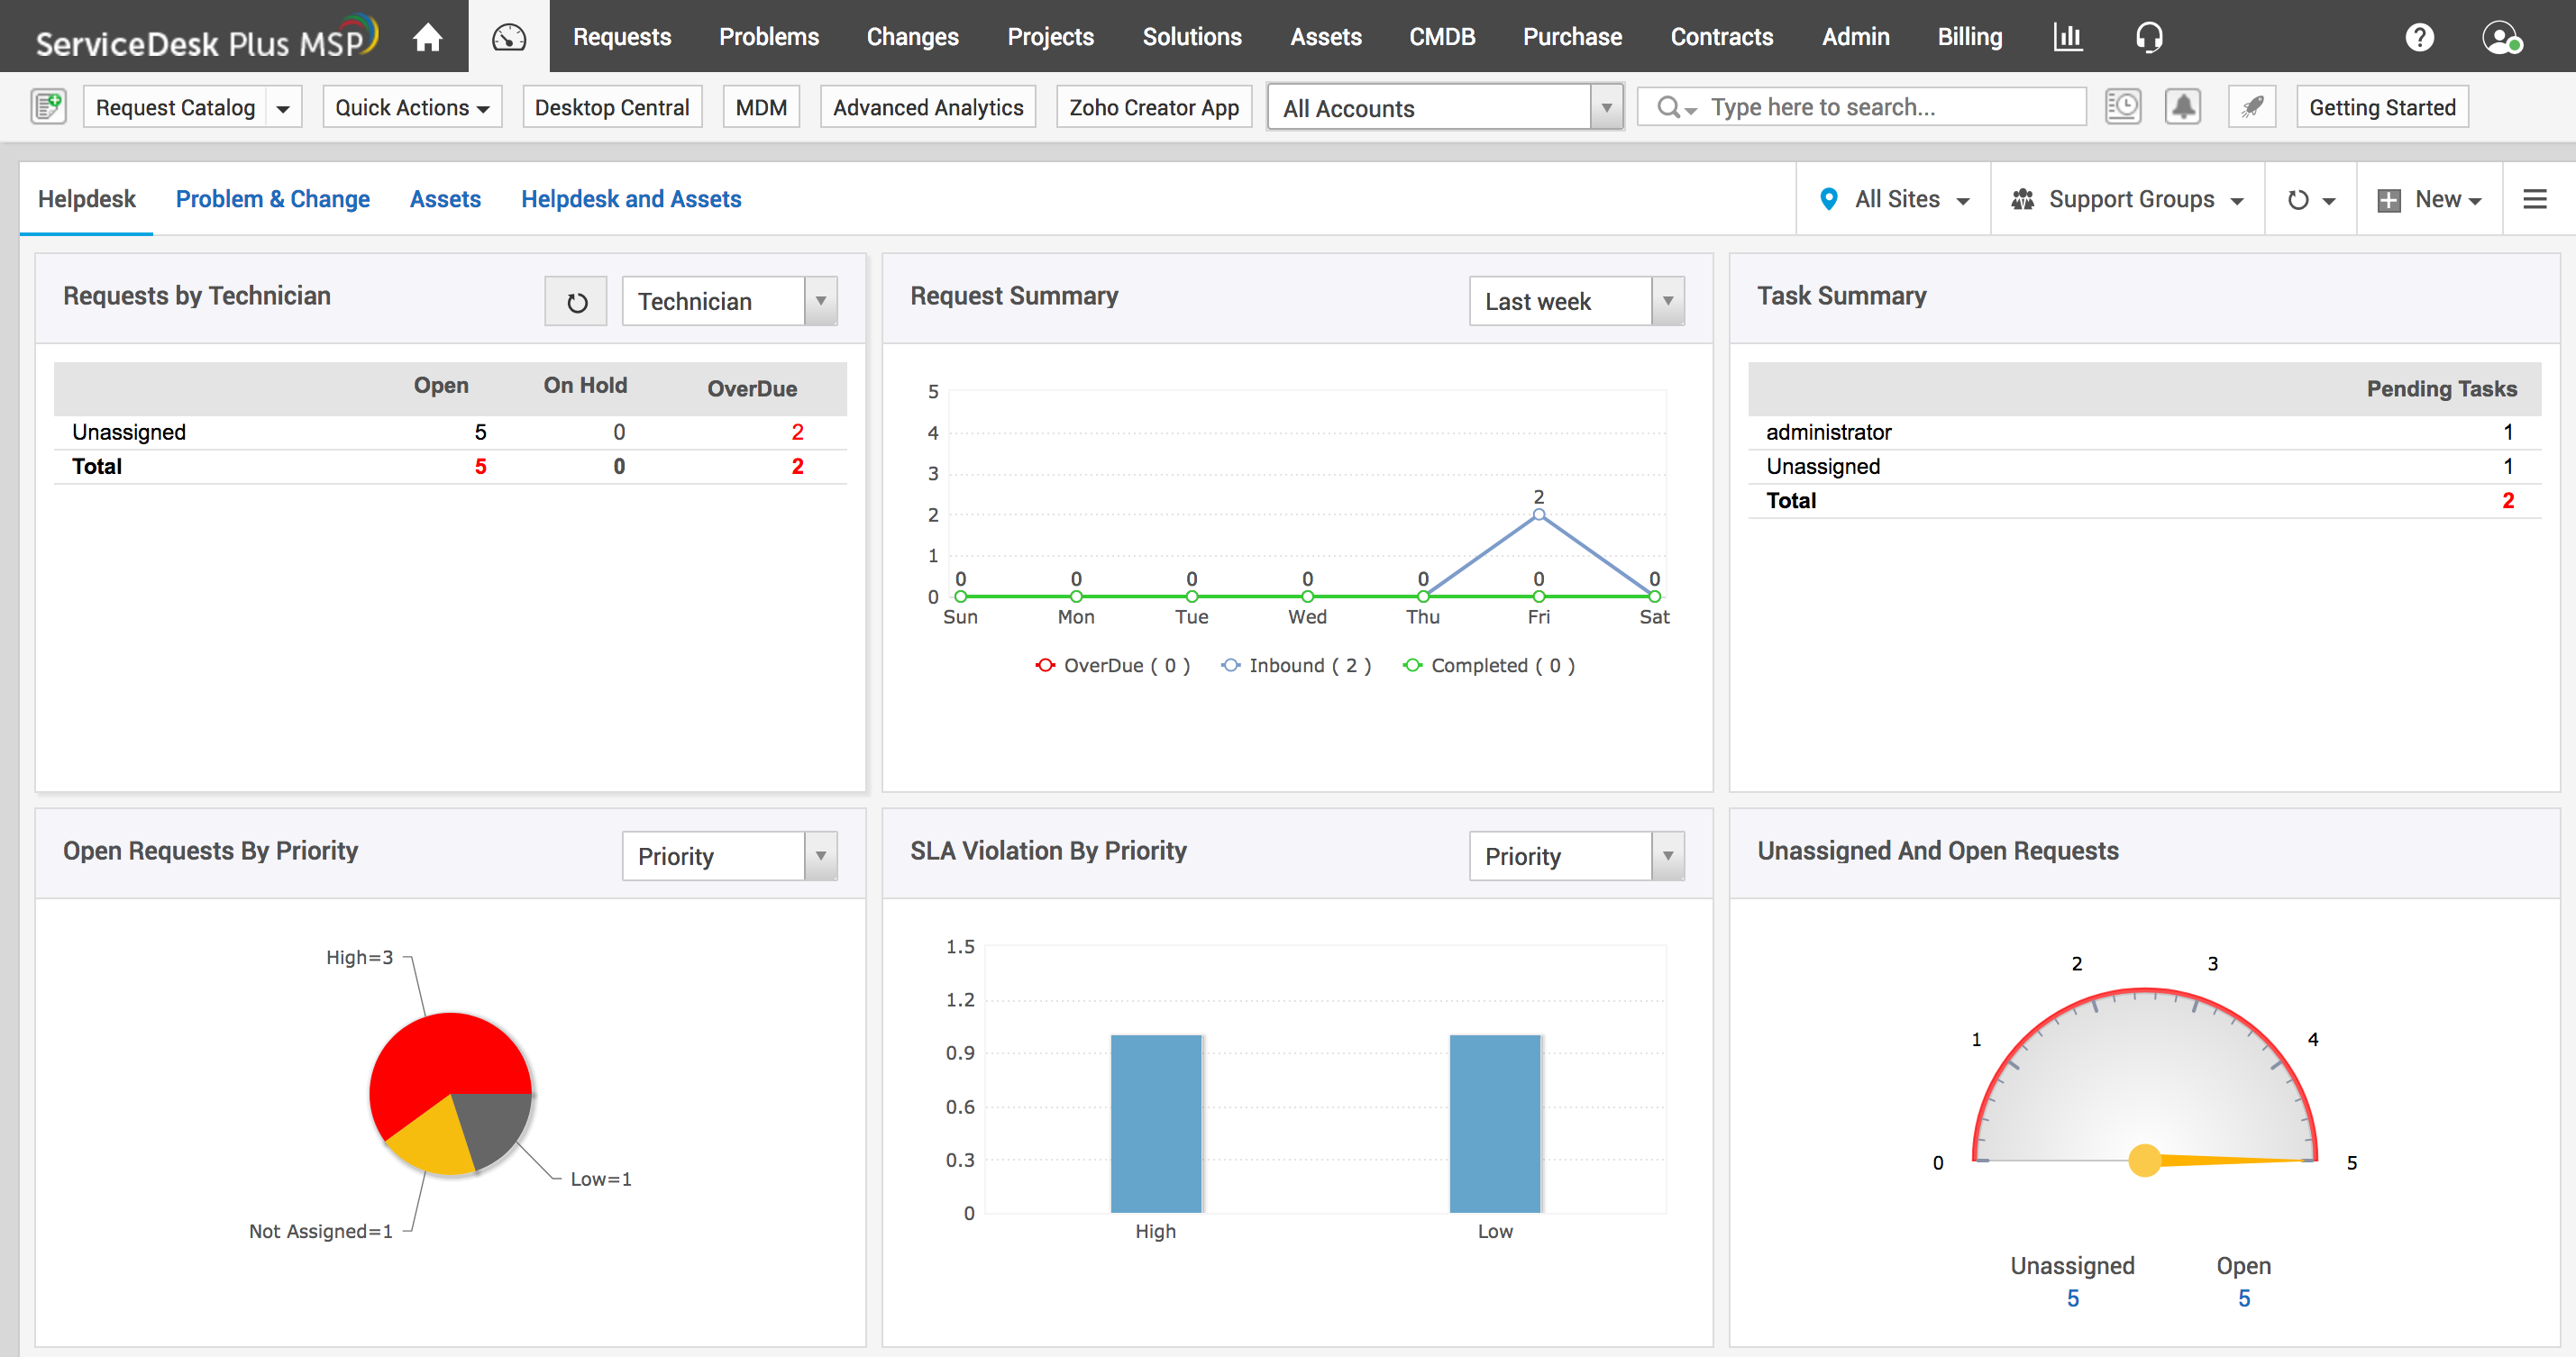
Under the Helpdesk tab, widgets are available to provide request based information at one glance.
-
The first widget shows the total number of Open, On Hold, and OverDue Requests. This information can be viewed based on the criteria provided in the drop-down box. Number of requests can be viewed based on Technician, Category, Level, Priority, and Mode.
-
The second widget displays the Request Summary. You can view the requests raised in This week, Last week, This month, and Last month.

-
The third widget displays the Task Summary that shows the number of pending tasks, unassigned tasks, etc.
-
The fourth widget shows the number of Open Requests that can be viewed based on Level, Mode, Priority and Category.
-
The fifth widget displays the number of SLA violated Requests. A drop-down box provided allows you to view the number of SLA violated requests based on Priority, Group, Level, Technician and Category.

- The next 3 widgets show the number of Unassigned and Open Requests, number of SLA violated Open requests, and number of Requests Approaching SLA violation in the next 60, 120, and 180 minutes. Clicking on the number of requests present in the bottom of the widget opens the corresponding list of requests for viewing.

-
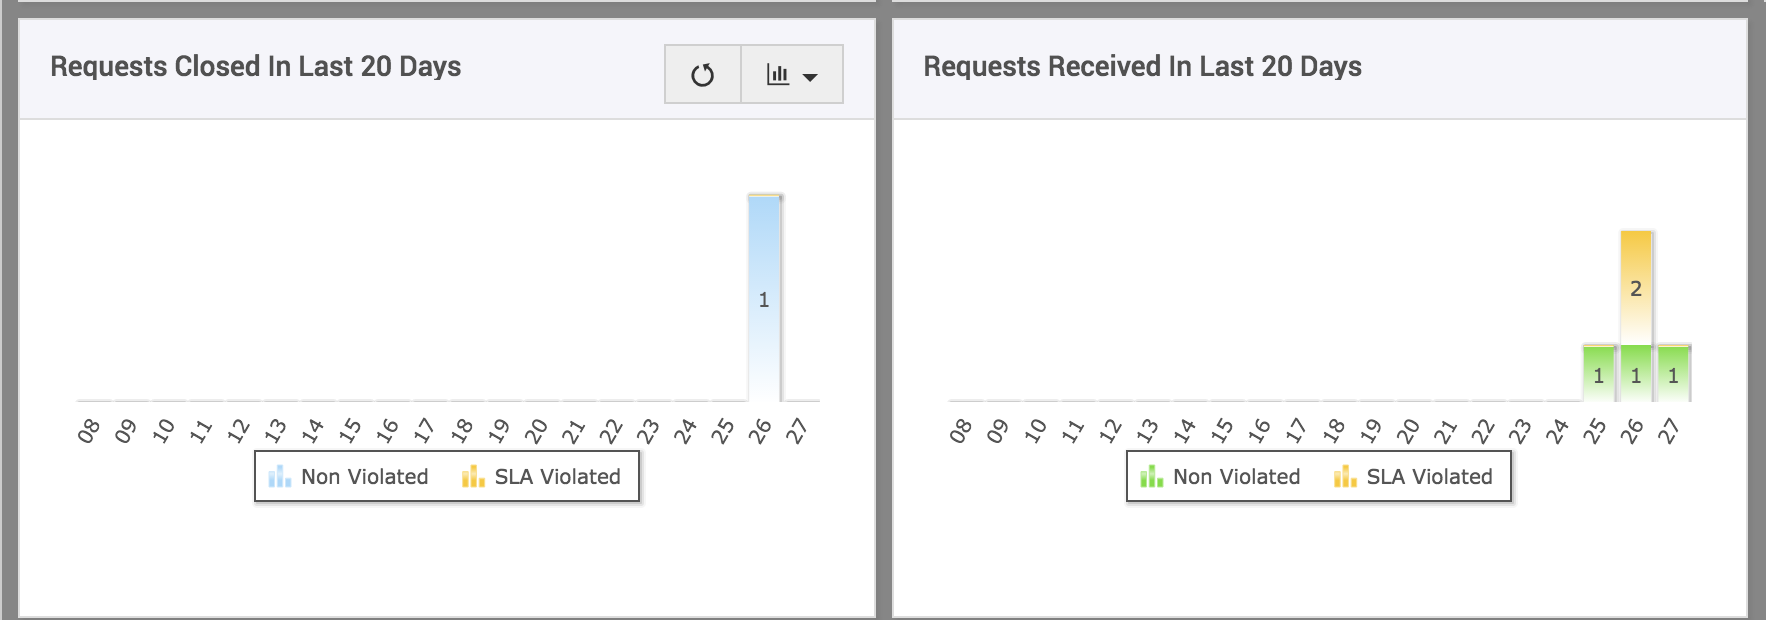
The last 2 widgets show the number of requests that were received and closed in the last 20 days. Clicking on the bars in the graph opens the corresponding requests for a better view.
Problem & Change
Technicians who have permission to view the Problems and Changes module can also view the Problem & Change widgets in the dashboard.
-
The first widget in the dashboard shows all the scheduled approved changes that are to be rolled out. The changes that are scheduled to be rolled out in the following time period (This week, Next week, This month and so on) can be viewed by selecting the time period from the first drop-down box. The changes can also be viewed based on criteria such as Change Type, Priority, Urgency, and Impact.
-
The second widget shows a list of Approved Changes that are scheduled to be rolled out. The list can be viewed based on the time period during which the changes are scheduled to be rolled out (This week, Next week, This month and so on). The list indicates the Title of the change along with the Change Type. Clicking on the title of the change opens a pop-up with the change details. By clicking on the title of the change in the pop-up, the complete change details page can be viewed.

-
The third widget shows a list of unapproved changes along with the change type. Clicking the title of the change opens a pop-up with the change details. By clicking on the title of the change in the pop-up, the complete change details page can be viewed.
-
The last widget displays the problems. By using the filters, the chart can be viewed based on Priority, Urgency, and Impact.

Assets
Technicians who have permission to view Asset module can also view the Asset dashboard and monitor the statistical data displayed on it. The widgets in the Asset Dashboard give a complete summary of all physical assets, software assets, workstations and POs & contracts.
-
The first widget shows a summary of all physical assets (IT and non-IT) in the organization. By default, only the number of Workstations, Printers, Routers, Servers and Others are displayed. By clicking on "View All", the Others category is expanded and other IT and non-IT assets such as Access points, Switches are displayed. The number of workstations failed to be scanned is also indicated in this widget along with the option to Troubleshoot the failure operation. By clicking on the number displayed next to the assets, one can view the list of those assets under the Asset module.
-
The second widget displays the number of workstations depending on various criteria. These criteria can be selected by clicking on the drop-down menu at the top of the widget. By clicking on "View All", a pop-up showing the extended graph is displayed. Set of graph that is not included in the original widget is displayed in this pop-up. Mouse hovering over each bar displays the number of workstations corresponding to the selected criteria. By clicking on the bar, the list of workstations is displayed under the Asset module.

-
The third widget shows software related information. By clicking on the drop-down menu below the widget title, one can select the criteria based on which the widget should be displayed. By clicking on "View All", a pop-up showing the extended view is displayed. Mouse hovering over each bar/pie region displays the number of software corresponding to the selected criteria. By clicking on the bar/pie region, the list of software is displayed under the Asset module.
-
The fourth widget shows a summary of Purchase Orders (POs) and Contracts. By selecting Purchase Order summary from the drop-down, one can view the overdue POs, POs due in the next 7 days and the POs due in the next 30 days. By Selecting Contracts summary, one can view the contracts that have expired in the last 30 days, contracts expiring in the next 7 days and contracts expiring in the next 30 days.

Projects
Get all the information you need on projects in just one glance. Add, edit, and organize widgets related to the projects. Technicians with permission to view the projects module can view the dashboard data for projects.
Some of the widgets available for projects include,
-
Pending Projects by Project Type/Priority
This widget shows the pending projects by projects type. You can use the filters to display the projects by priority as well.
-
Pending Projects by Site/Department
This one displays the pending projects by site. You can use the filters to display the projects by department as well.
-
Due/Overdue Projects by Owner
This widget shows due projects by Owner. You can use the filters to get the overdue projects as well.

- Projects Cost Violated by Owner
This one shows the project costs that are violated by owner. You can use the filters to get the project costs vialoated by hours as well.
- Due Projects by Status
This one shows the due/overdue projects by status. Notice the color pattern to identify the priorities of the projects.
- Project Due this Month
This one shows the projects that are due by current/next month.

- Milestones Due This Week
This widget helps you to keep a track of milestones that are due by current/next week.
- Projects Created/Closed by Month
This one displays all the projects that were created and closed by months.
- Completed on Time/Delayed Projects
This one shows the projects that were completed on time as per the schedule and also shows the delayed projects by months.

|
|
Note: Graph types in widgets can be changed by using the graphs filter. You can also click on any part of the graph to open the mentioned projects.
|
Business Dashboard
Track the overall business performance of your organization in the Business Dashboard.
Role Required: MSPDashboardOwner.
The Key Performance Indicator (KPI) widgets displayed on top provide the following information:
-
Revenue: Overall revenue of MSP for the ongoing year.
-
Technicians: Total number of technicians in your organization.
-
Billed Time: Number of hours for which the bill has been generated for the ongoing year.
-
Managed Assets: Number of IT assets managed by your organization.
-
Customer Satisfaction: Percentage of customer satisfaction calculated from the user survey data.
- Completed Requests: Total number of tickets resolved in the ongoing year.

The following widgets are displayed below the KPI widgets. Use the drop-down menu in each widget to display the data for different time scales.
-
Revenue: Revenue of MSP for the time scale chosen.
- Last 12 Bill Cycles: Revenue of the last 12 bill cycles. Use filters to view the bills generated for specific accounts and contracts.

-
Top 10 technicians by CSAT: Data of 10 technicians who have attained the maximum customer satisfaction. This data is calculated from user surveys.
- Customer Satisfaction: Percentage of overall customer satisfaction that is calculated fromuser surveys.

-
Top 10 technicians: Billable and non-billable hours spent on requests by the top 10 technicians. The technician with maximum billable time spent tops the list.
- Billable vs Non Billable hours: Billable and non-billable hours spent on requests for the time scale chosen.

-
Top 10 Services: Top services based on the time spent for each service. The service with maximum time spent tops the list.
-
Incident vs Service Requests: Time spent on incident and service requests.

-
SLA Compliance: Data on SLA-violated and non-violated requests.
-
Tickets Flow: Data on pending and completed requests for the time scale chosen.

-
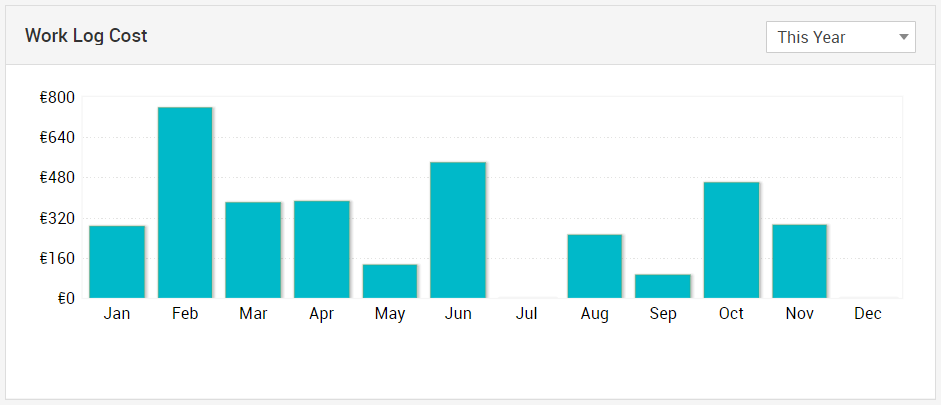
Work Log Cost: Work log cost of all requests for the time scale chosen.
Refresh dropdown
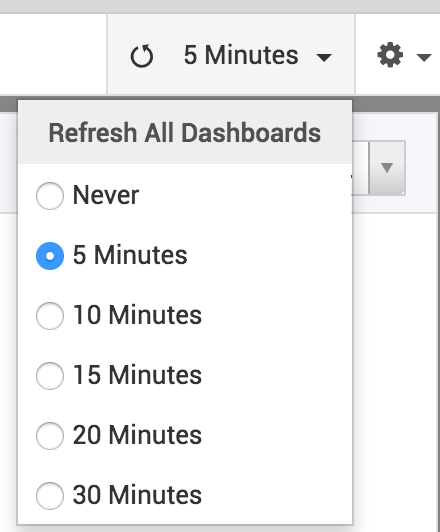
Dashboards needs to be refreshed periodically to make sure only the latest data is loaded and displayed in the dashboard. Refresh dropdown automates this process. Select the refresh frequency in which you want the dashboards to be refreshed automatically. The dashboards will be refreshed automatically in the set refresh frequencies.
Filters
Dashboard can be customized with filters. There are two types of filters available. Site-based filter and Support group based filter. The filtered list will be updated based on the account you have chosen. 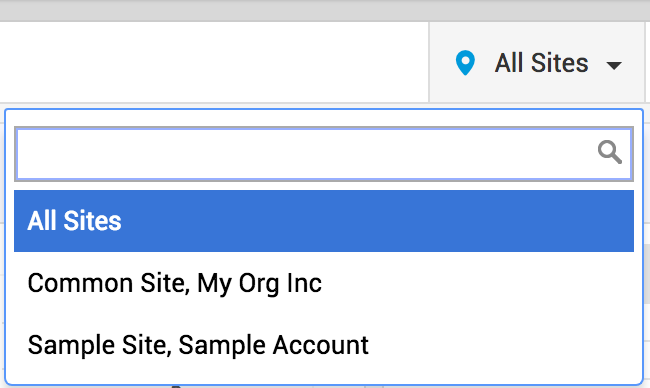
Site based filter
- Click on the Sites filter to see the site based filters
- Select the site.
- Data pertaining to the site selected will be displayed in the dashboard.
Support Group based filters
- Click the Support Groups filter to see the support groups based filters.
- Select the support groups.
- Click Apply.
- Data pertaining to the selected support groups will be displayed in the dashboard.

Settings
Settings menu can be used to customize the dashboards. To know more about customizing the dashboards click here.


