Diverse network monitoring applications, one tool.
OpManager's network monitoring and management console helps you deal with the challenges modern network landscape throws at you.
OpManager's network monitoring and management console helps you deal with the challenges modern network landscape throws at you.

Network monitoring applications have steadily evolved over the past decades to adapt to the changing requirements and expectations of the market. Over the years, the cost of downtime has skyrocketed, client patience for downtime is lower than ever. Network administrators have to ensure that their network stays as close to the ideal 'five nines' availability as possible (99.999 percent availability). More than just uptime, the quality of uptime has also become important- brownouts- or periods of poor network quality are just as bad as complete outages.
Another development is the increasing complexities of networks. A modern network monitoring application has to optimize the performance of cloud-native, cloud-based, and consolidated environments. These technologies assure redundancies to prevent outright blackouts, nevertheless, the quality of service needs to be monitored. Network forensics is a network monitoring application which involves providing detailed insights about outages after they occur.
A network monitoring tool is expected to assist modern IT teams with multiple network monitoring applications.
Network performance monitoring for metrics like latency, packet loss, and response time is one such application. A network monitoring tool must be able to scan the entire network and pinpoint performance bottlenecks so that the IT team can fix the issue. Monitoring VoIP and WAN performance is also necessary for network admins to maintain SLAs.
Modern network infrastructures have consolidated architectures with a dynamic network topology. The network monitoring software should be able to monitor virtual machines, physical devices, and cloud-based network components for health and performance. Another aspect of this involves hardware health monitoring for these devices. IoT monitoring is a new network monitoring application that is becoming highly relevant.
Another use case of network monitoring is intelligent analysis of monitored data. AI/ML tools can ingest large volumes of data produced by enterprise networks and derive meaningful insights from them. This saves a lot of valuable time and effort for the IT team. Network automation, data correlation, adaptive alert setting, and data trend forecasting are some new network monitoring applications of AIOps in IT.
Finally, a network monitoring software is expected to track down and troubleshoot network issues with ease. Network diagnostics is part of this. When faults or outages do occur, the tool must be able to pin point the exact root cause, and help in fixing the issue.
ManageEngine OpManager is a complete IT infrastructure and network performance monitoring tool which allows you to monitor and optimize different aspects of your network from a single unified console. No matter the network monitoring application, OpManager uses specific, out of the box monitors to collect data from the network and its components. Once this data is collected, it is analyzed and made into crisp executable insights. As a network admin, you can let OpManager crunch the numbers and do the heavy lifting. AI and ML models are available to dynamically set thresholds, forecast performance trends, and capacity. Meanwhile, you can automate routine troubleshooting tasks to further streamline and speed up operations.
The performance of a network indicates the service quality that it can deliver. Most IT operations must be able to offer high availability and low latency data transmission for their networks. Take services like high-quality video streaming or VoIP. Performance degradation in these services can result in choppy videos or dropped calls, affecting customer satisfaction.
Companies are also contractually obligated to uphold a minimum quality of service in their SLAs. Failing at this would mean losses in revenue and reputation. Along with continuous monitoring and alerting, deep visibility is also needed into LAN and WAN for maintaining SLAs.
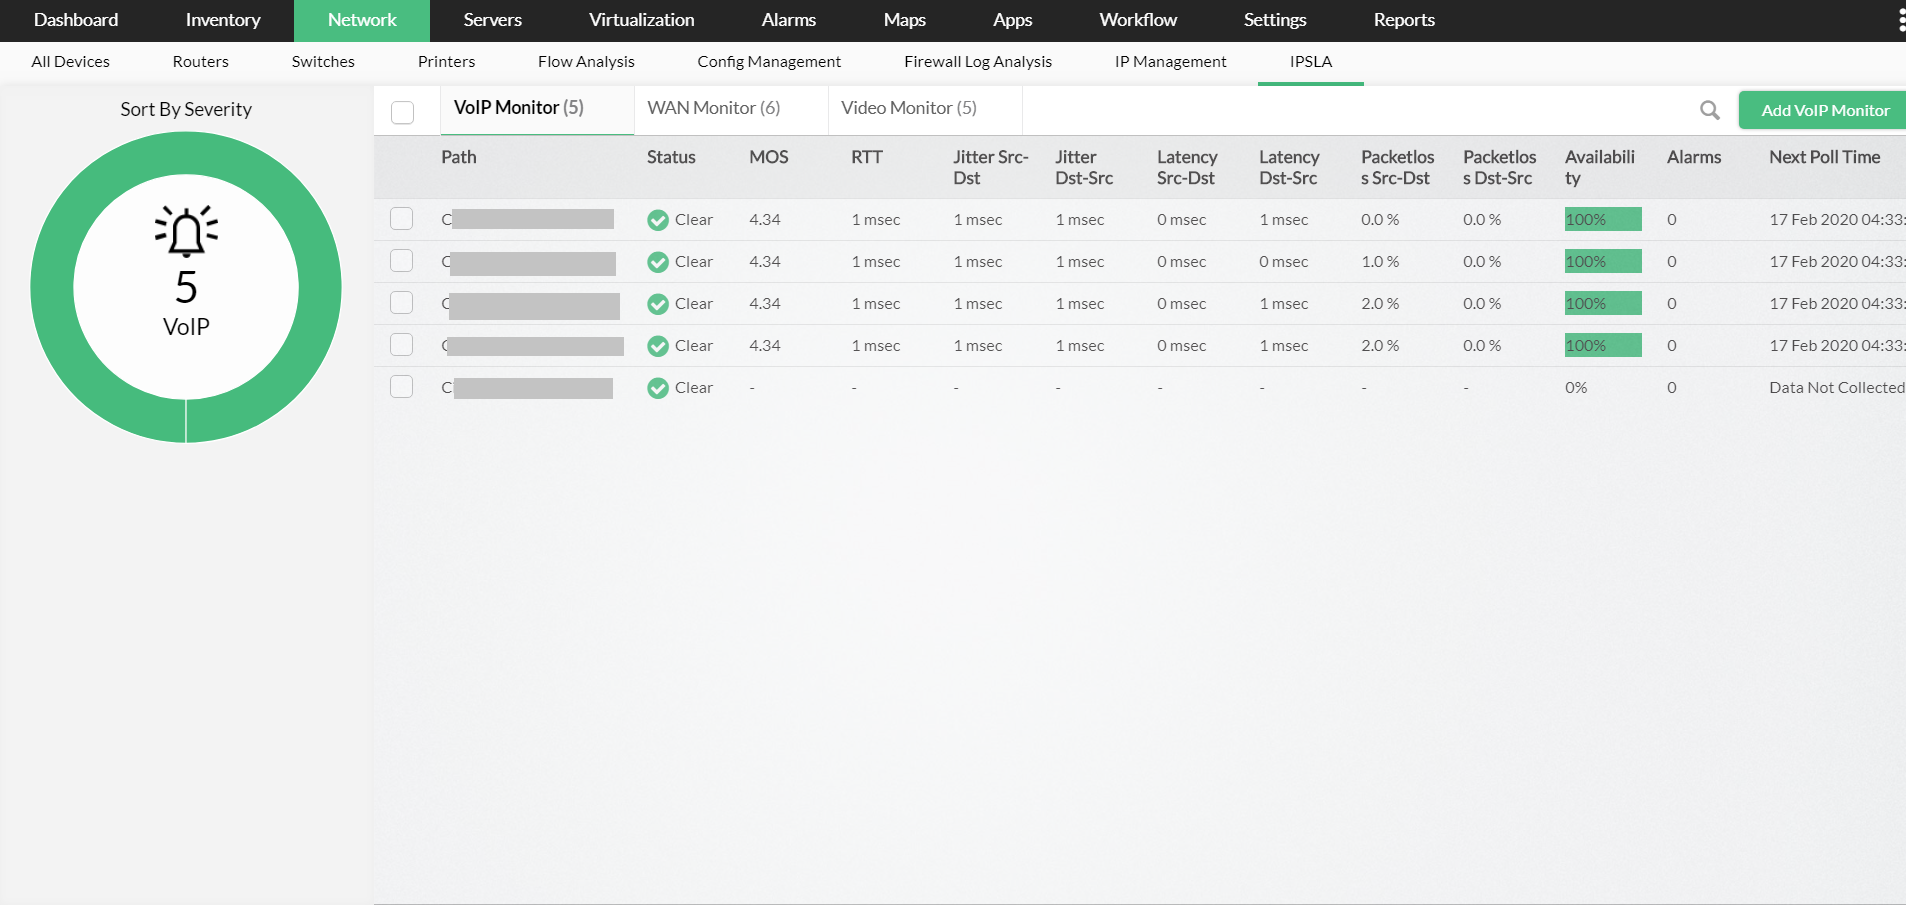
A comprehensive network monitoring tool like OpManager is perfect for this. OpManager can monitor parameters like jitter, packet loss, round trip time, and mean opinion score and generate real-time alerts for poor performance.
OpManager can monitor and troubleshoot VoIP performance using Cisco IPSLA. OpManager's powerful reporting features can be used to analyze network performance from source to destination of your network.
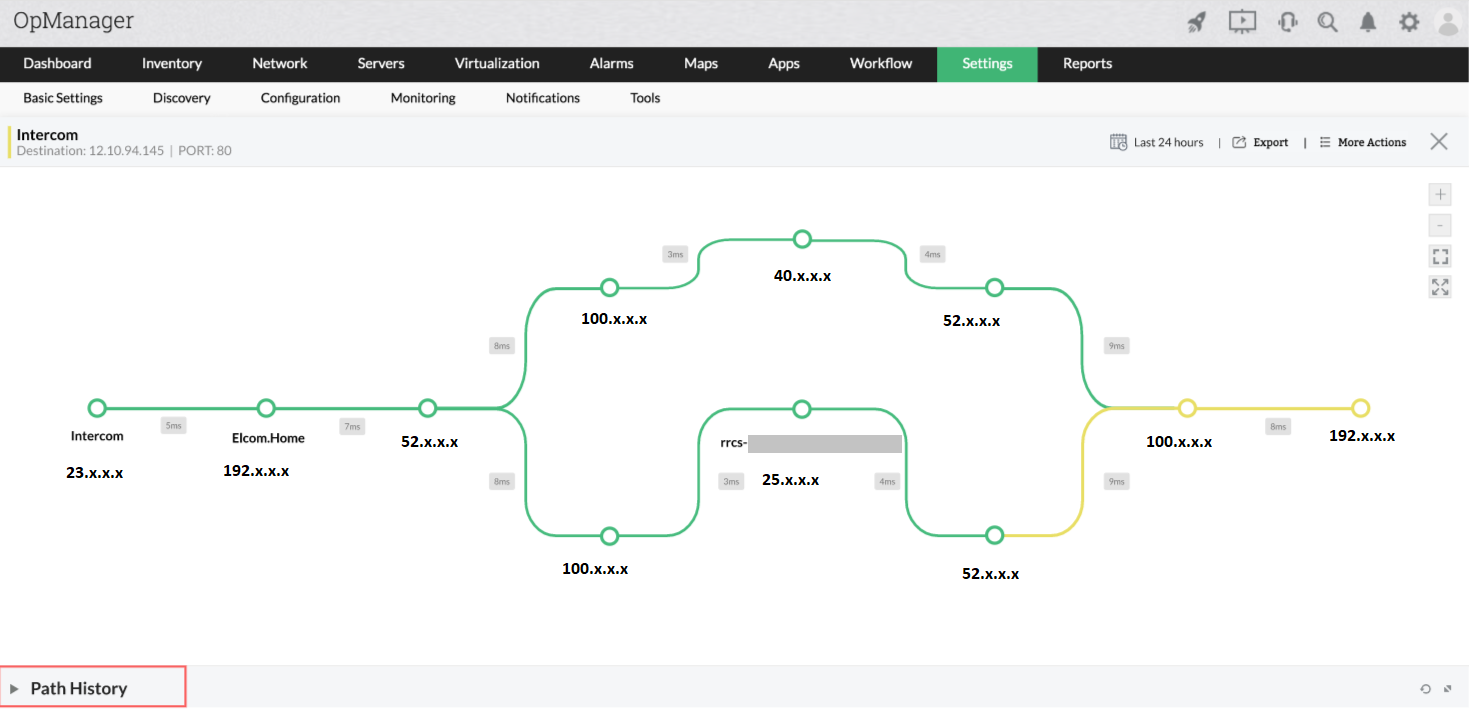
OpManager also has a Network Path Analysis feature that provides deep visibility into network data transmission on a hop-by-hop basis. This allows you to see which branches of your LAN or the WAN are causing latency and fix them. Read more use cases for network monitoring tools from our customers section.
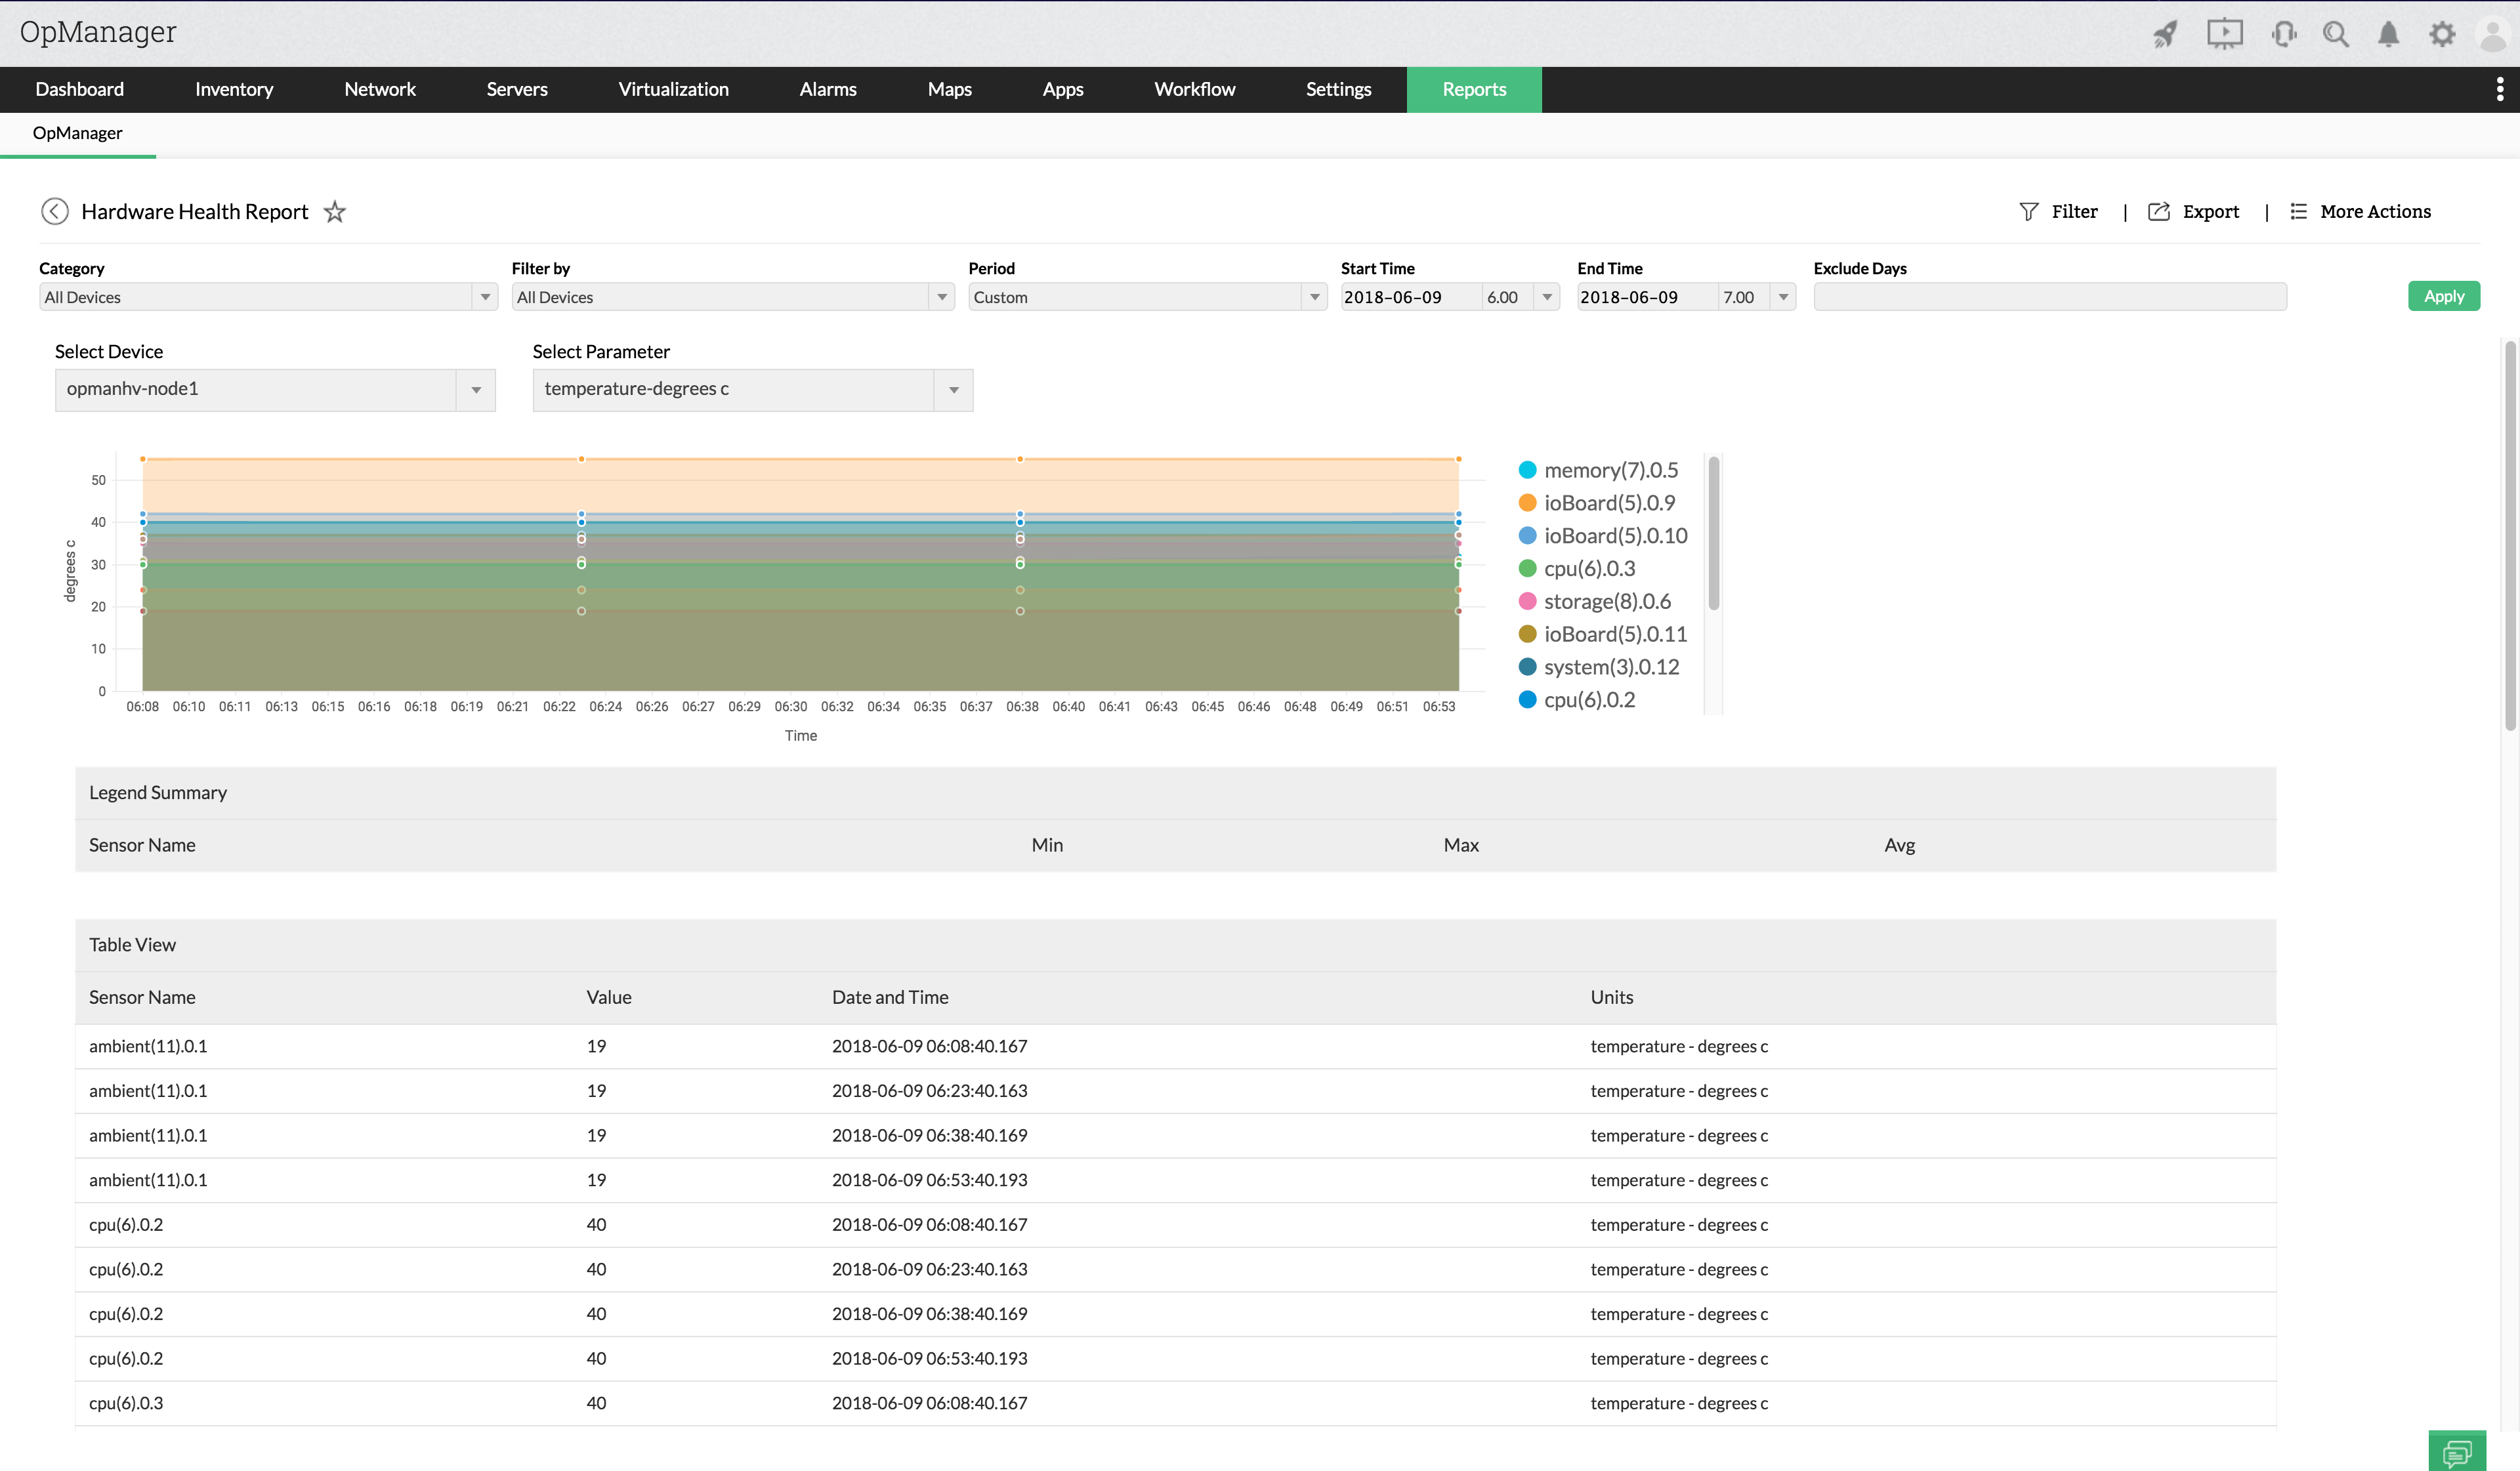
Another application of network monitoring of particular importance is CPU utilization and performance of key network devices. Many organizations limit their monitoring to latency of connections and availability of devices. However, the health of network devices, especially their CPU, affects network performance.
Network monitoring tools gather device information using network protocols like SNMP, CLI, and WMI and displays them in a unified console. When these metrics cross thresholds, alerts will be generated to notify you of the discrepancy.
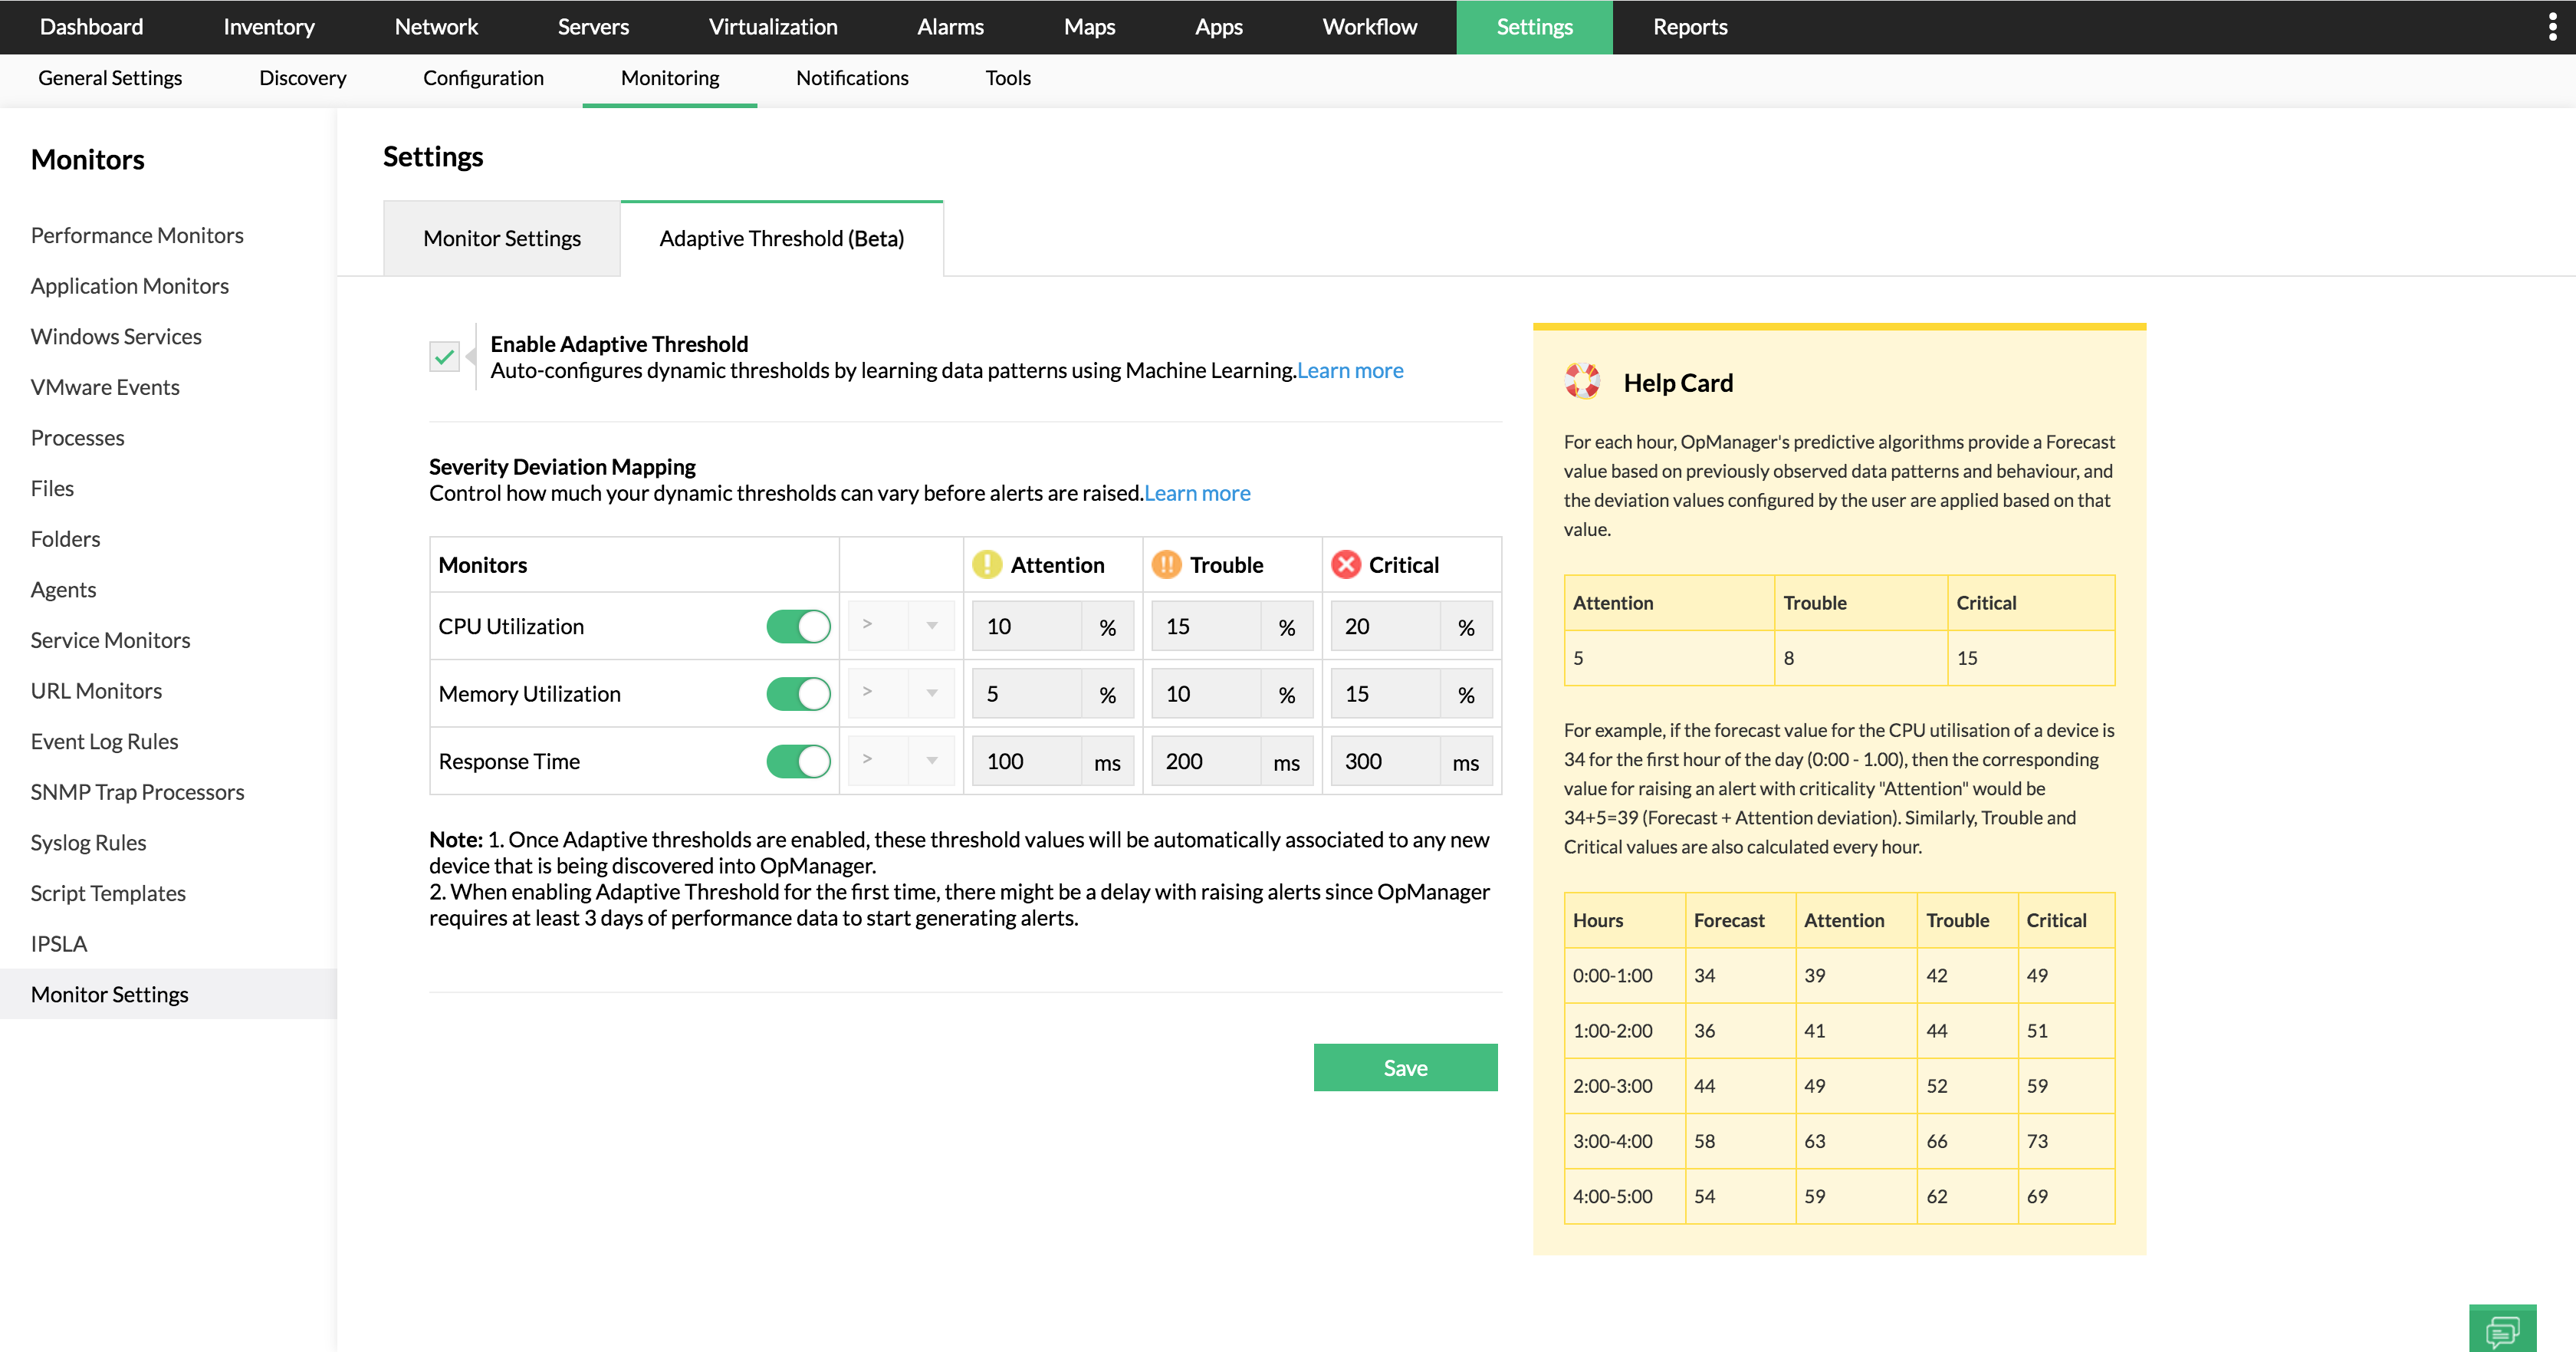
However, setting thresholds can be a hassle when you're handling large installations. Based on user activity, your servers could experience varying loads on a weekly or monthly basis. OpManager's adaptive thresholds solve these issues intuitively. OpManager uses predictive algorithms to learn network activity and set thresholds for each device every hour.
OpManager can also monitor key CPU parameters such as temperature, fan speed, power supply, processor clock speed, and battery state, among 200 performance metrics.
Whether your setup is on-premises or remote, OpManager's network monitor keeps everything under control. Read more use cases for network monitoring tools from our customers section.
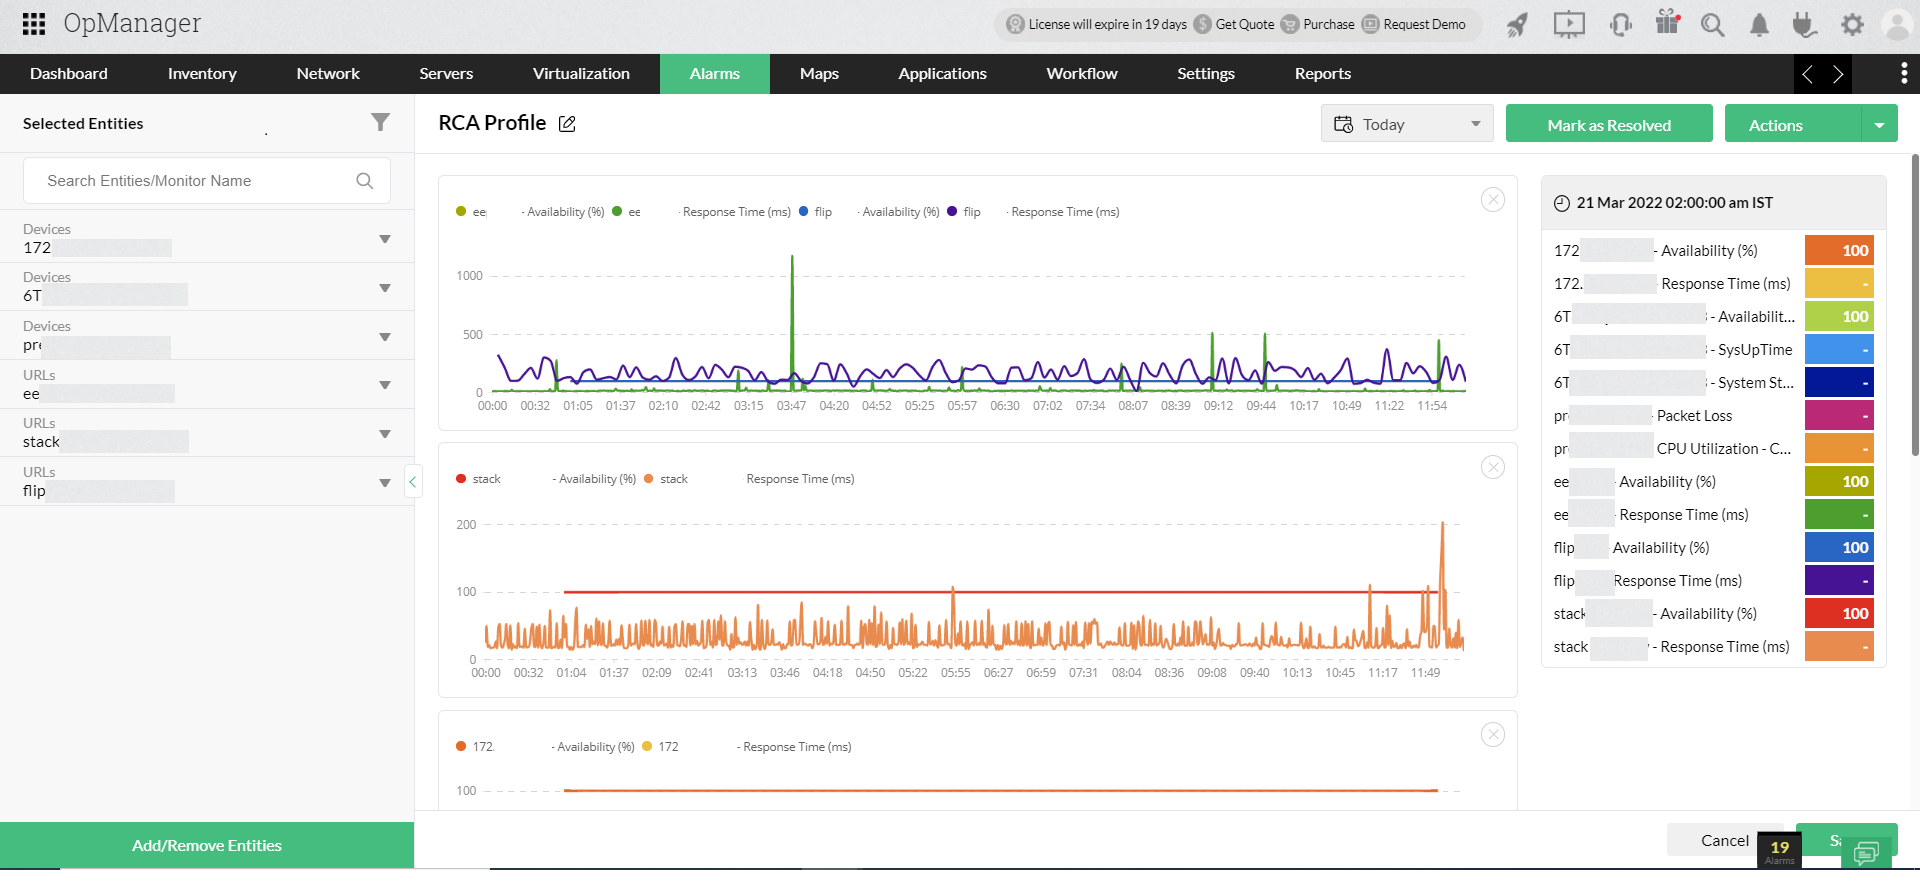
Network diagnostics, troubleshooting to track down root causes, identifying solutions, and implementing fixes are very important network monitoring applications. This helps reduce the Mean Time To Repair (MTTR) for outages and other issues. Not only does this help maintain the revenue and reputation, it also helps uphold SLA terms.
In large IT infrastructures with multiple devices like VMs, servers, switches, routers, and storage devices, network troubleshooting and diagnostics can be tough. One issue might trigger a domino effect of troubles, and you would have a hard time finding out the root cause.
OpManager has a root cause analysis feature that displays graphical metrics of up to 20 monitors in one window, where you can compare them to track down the root cause that triggered the outage.
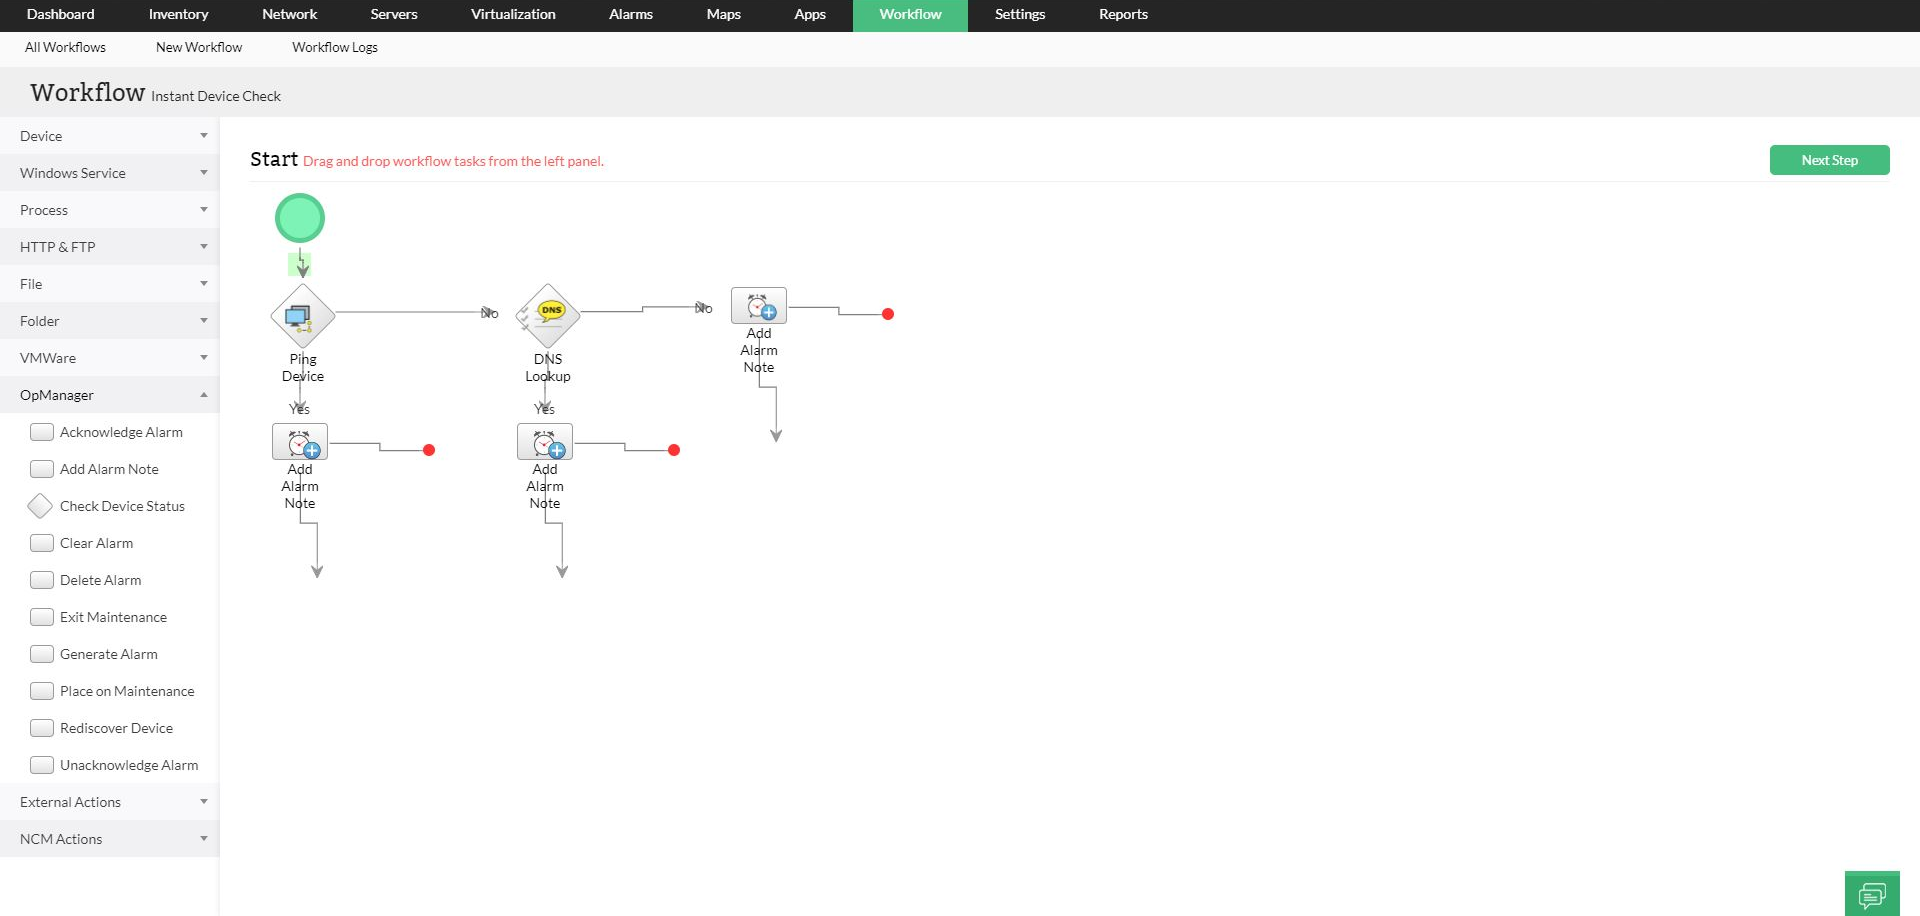
OpManager also has an interactive drag-and-drop workflow builder where you can create automated workflows for basic troubleshooting automation. Your IT staff won't have to perform endless, routine troubleshooting and will be freed up for more innovative tasks.
You can use real-time and predictive metrics to get a more proactive insight into the network and identify problems before the snowball into major outages. Performance trend forecasting is a feature that uses AI algorithms to analyze past data and predict future usages.
Combined with its basic troubleshooting tools like ping and traceroute, OpManager ensures minimal MTTR and easy troubleshooting. Read more use cases for network monitoring tools from our customers section.
Network monitoring tools play an important role when networks are migrated to a larger environment. As the network size up and the number of devices increase, chances of failure also increase due to elevated load, incorrect connections, and device misconfigurations.
A good network monitoring tool guides such migrations with timely alerts. But this begs the question, can the network monitoring tool itself handle such elevated loads? Network monitoring tools handle a large amount of data every second, polling hundreds of network devices and analyzing the data gathered. Most network monitoring tools are unable to scale to enterprise levels and show a decline in performance.
Network monitoring tools should scale up along with the network. OpManager is a comprehensive network monitoring tool that can scale effortlessly up to enterprise levels. OpManager can monitor up to 30,000 devices and 50,000 interfaces without any compromise in performance. You can also deploy probes for monitoring distributed sites centrally or monitoring more devices.
Scalability should also be complemented with vendor support for complete monitoring. OpManager supports over 10,000 device types, 450 vendors, and 150 applications, allowing you extensively monitor all the devices in your network and scale up when needed. Read more use cases for network monitoring tools from our customers section.
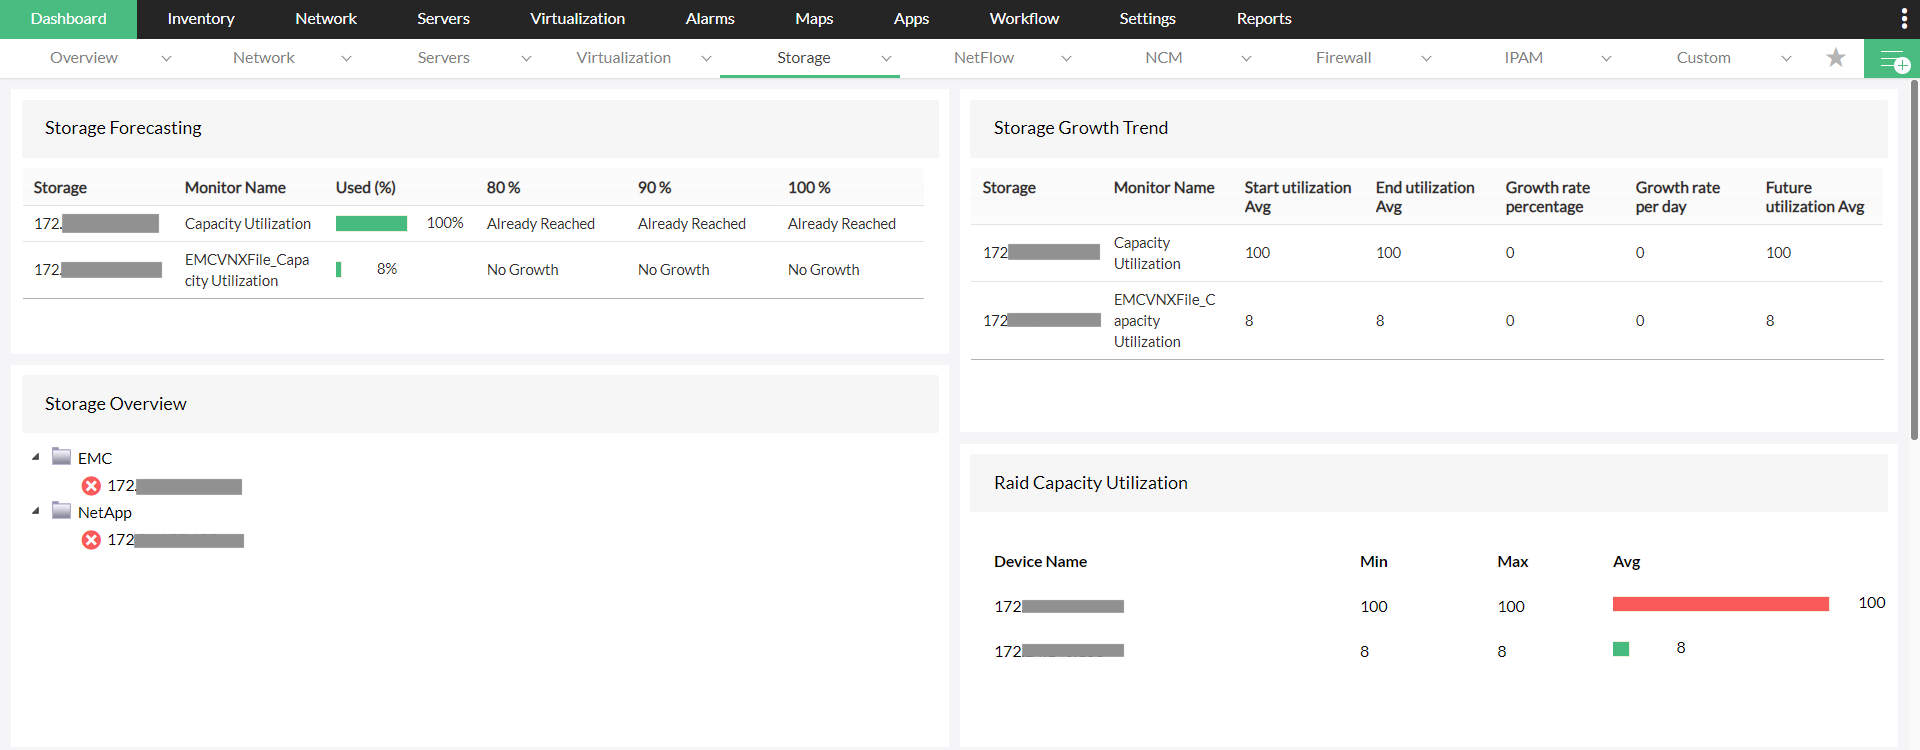
Capacity planning is an essential application of network monitoring. Network monitoring tools must monitor network resources like CPU utilization, memory, and disk usage so that you can be warned before they run out.
Without proper monitoring, there is no visibility into network device health and performance. Take, for example, storage. When storage of a server starts to run out, its performance starts to decline. By the time you notice the effects, the storage is almost about to be exhausted and end users are affected. Then you have to scramble to remedy the issue.
A comprehensive network monitoring tool like OpManager uses usage trend lines to forecast parameters like storage, CPU utilization, and memory. You can view the days left until resource exhaustion and plan to replenish capacity in advance.
OpManager also has over 100 report templates and custom reports for analyzing network performance for network inventory and capacity management. Manage your network resources efficiently with OpManager. Read more use cases for network monitoring tools from our customers section.
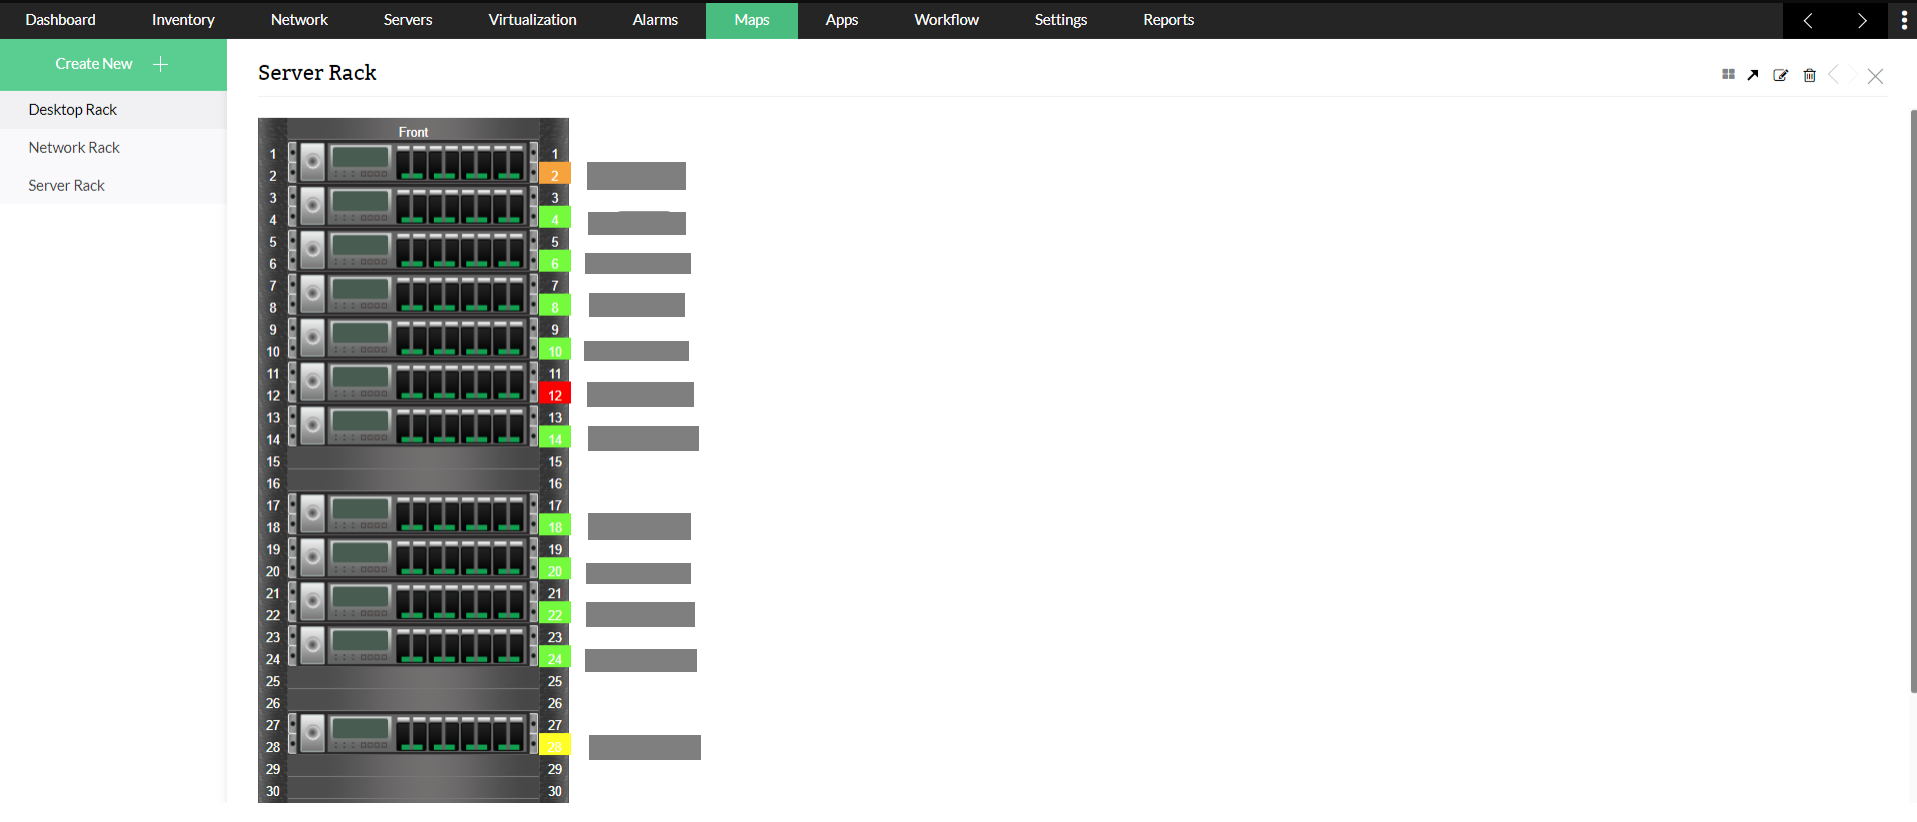
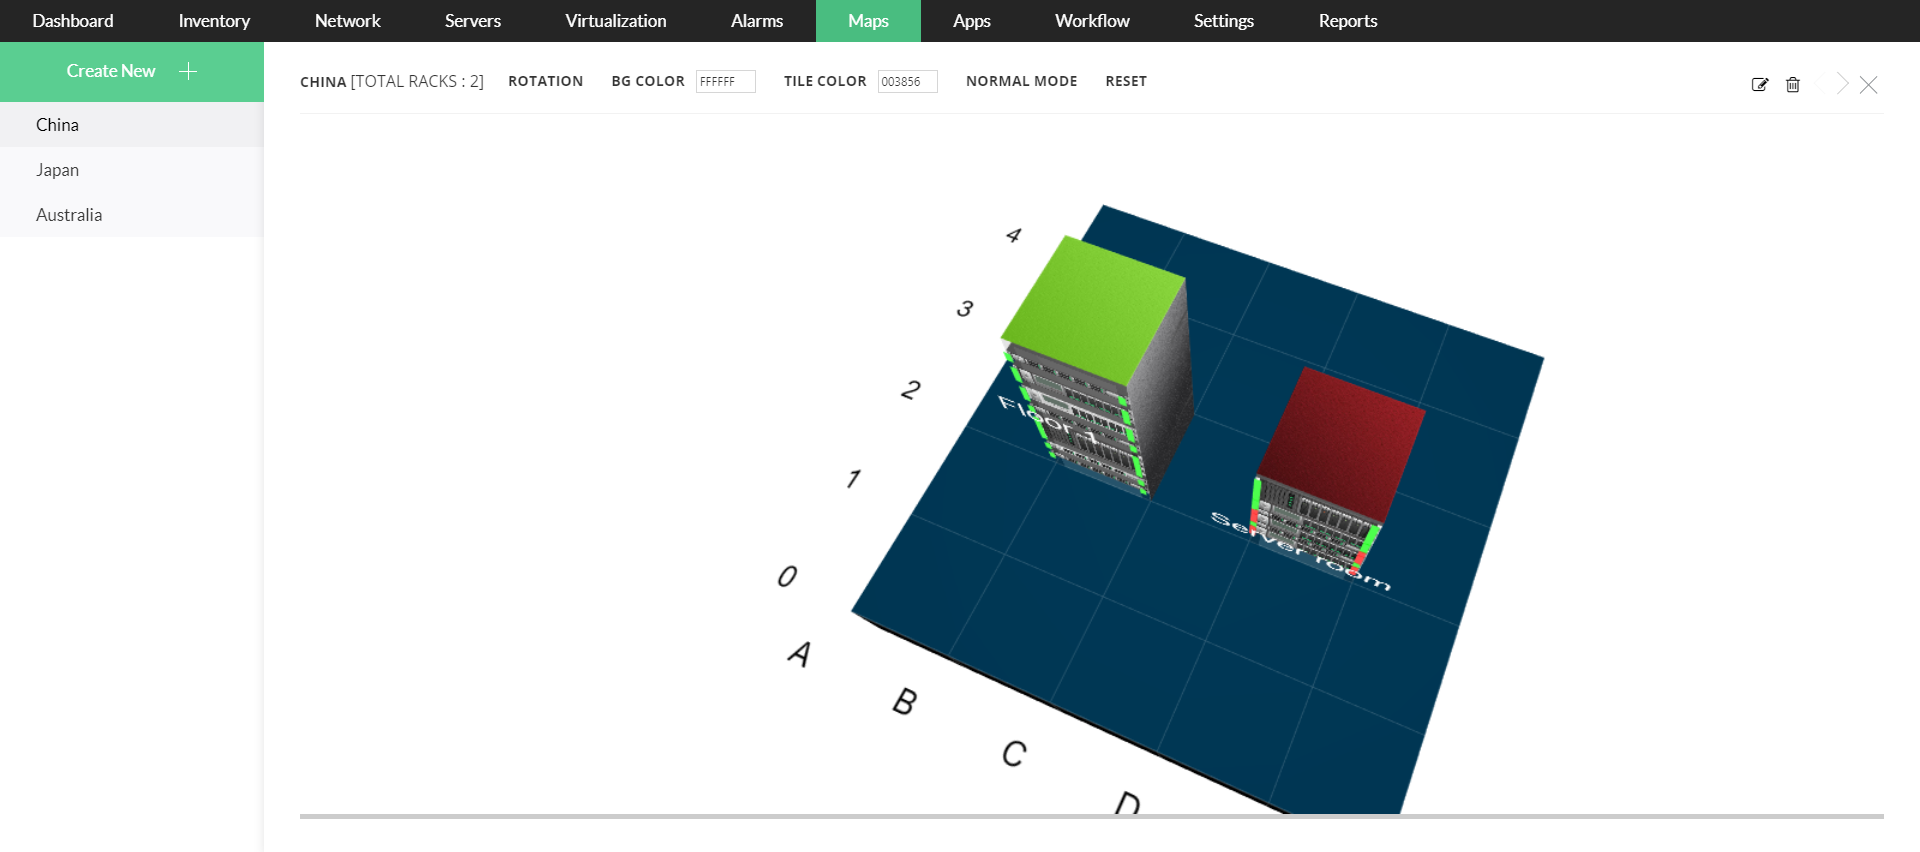
A network monitoring tool should be able to monitor hybrid network architectures effectively. OpManager is a comprehensive network monitoring tool that monitors and manages all types of network infrastructure. Be it on-premises, remote, or hosted.
OpManager can push remote probes from a centralized network operations center (NOC) to monitor datacenters and multiple sites from one location. You can monitor network apps and websites for response times and availability.
When it comes to virtualization, OpManager can monitor hosts, guests, and data stores in the virtual environments of major vendors like VMware, Nutanix, Hyper-V, and Xen. Monitoring can be done for general performance metrics, virtualization specific-metrics like CPU ready, as well as virtual events.
Another requirement for network monitoring tools are remote network monitoring support through smartphones. OpManager has a network monitoring app that is supported on both android and iOS. Unlike other network monitoring apps, OpManager is specialized for ease of use. One look at the network monitoring app gives you a complete overview of the network.
Read more use cases for network monitoring tools from our customers section.
 Recognized as a May 2019 Gartner Peer Insights Customers' Choice for Network Performance Monitoring and Diagnostics SoftwareRecognised as an April 2019 Gartner Peer Insights Customers' Choice for IT Infrastructure Monitoring Tools.
 Network Management and Monitor Vendor of the Year 2018, 2019
 Entered the 2019 Gartner NPMD Magic Quadrant.
 Ranked #2 in the Infotech Research Software Reviews Data Quadrant 2018.