Maximizing efficiency with cloud performance monitoring tools
Category: Cloud monitoring
Published on: Sept 28, 2025
10 minutes
Cloud computing has redefined enterprise IT, enabling scalability, flexibility, and operational efficiency. Yet with this transformation comes heightened complexity. Applications and infrastructure are no longer confined to static, predictable environments but are instead distributed across multi-cloud and hybrid ecosystems. In this context, sustaining optimal performance requires precision, visibility, and control; capabilities that only dedicated cloud monitoring tools can provide.
What is cloud performance monitoring?
Cloud performance monitoring is the systematic process of measuring, analyzing, and maintaining the performance and availability of cloud-based applications, services, and infrastructure. Unlike traditional data centers, cloud resources are dynamic and ephemeral, scaling in response to demand. Monitoring, therefore, must address elasticity, distributed architectures, and real-time workload fluctuations.
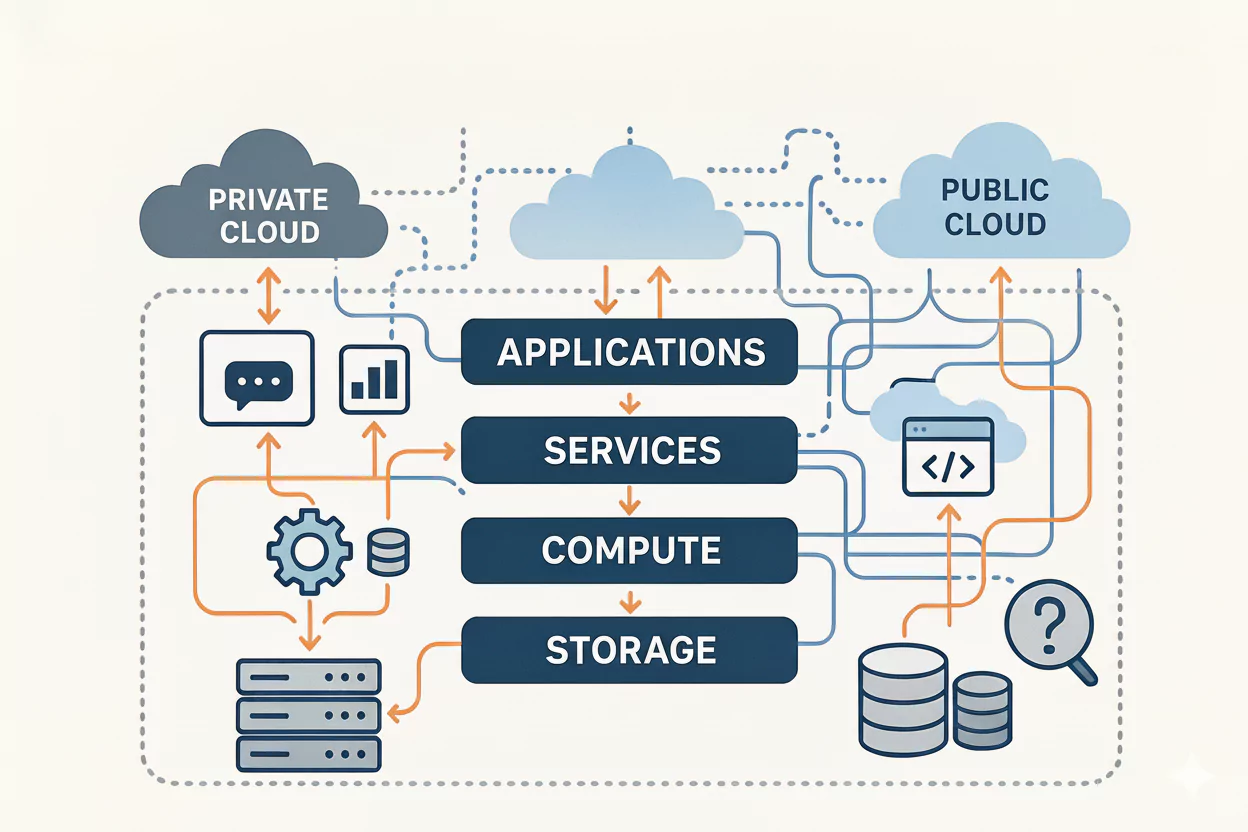
An effective approach captures and correlates metrics, traces, and logs to identify bottlenecks and ensure systems function as intended. Inadequate monitoring exposes organizations to risks: degraded performance, service disruptions, unchecked costs, and security blind spots. Robust cloud performance monitoring tools mitigate these challenges by transforming telemetry into actionable insights, enabling teams to maintain reliability, optimize resource utilization, and align cloud operations with business outcomes.
Why is cloud performance monitoring important?
Cloud performance monitoring ensures that systems operate reliably, resources are used efficiently, and potential issues are identified before they impact users. Its necessity can be understood across several interconnected layers:
Operational complexity:
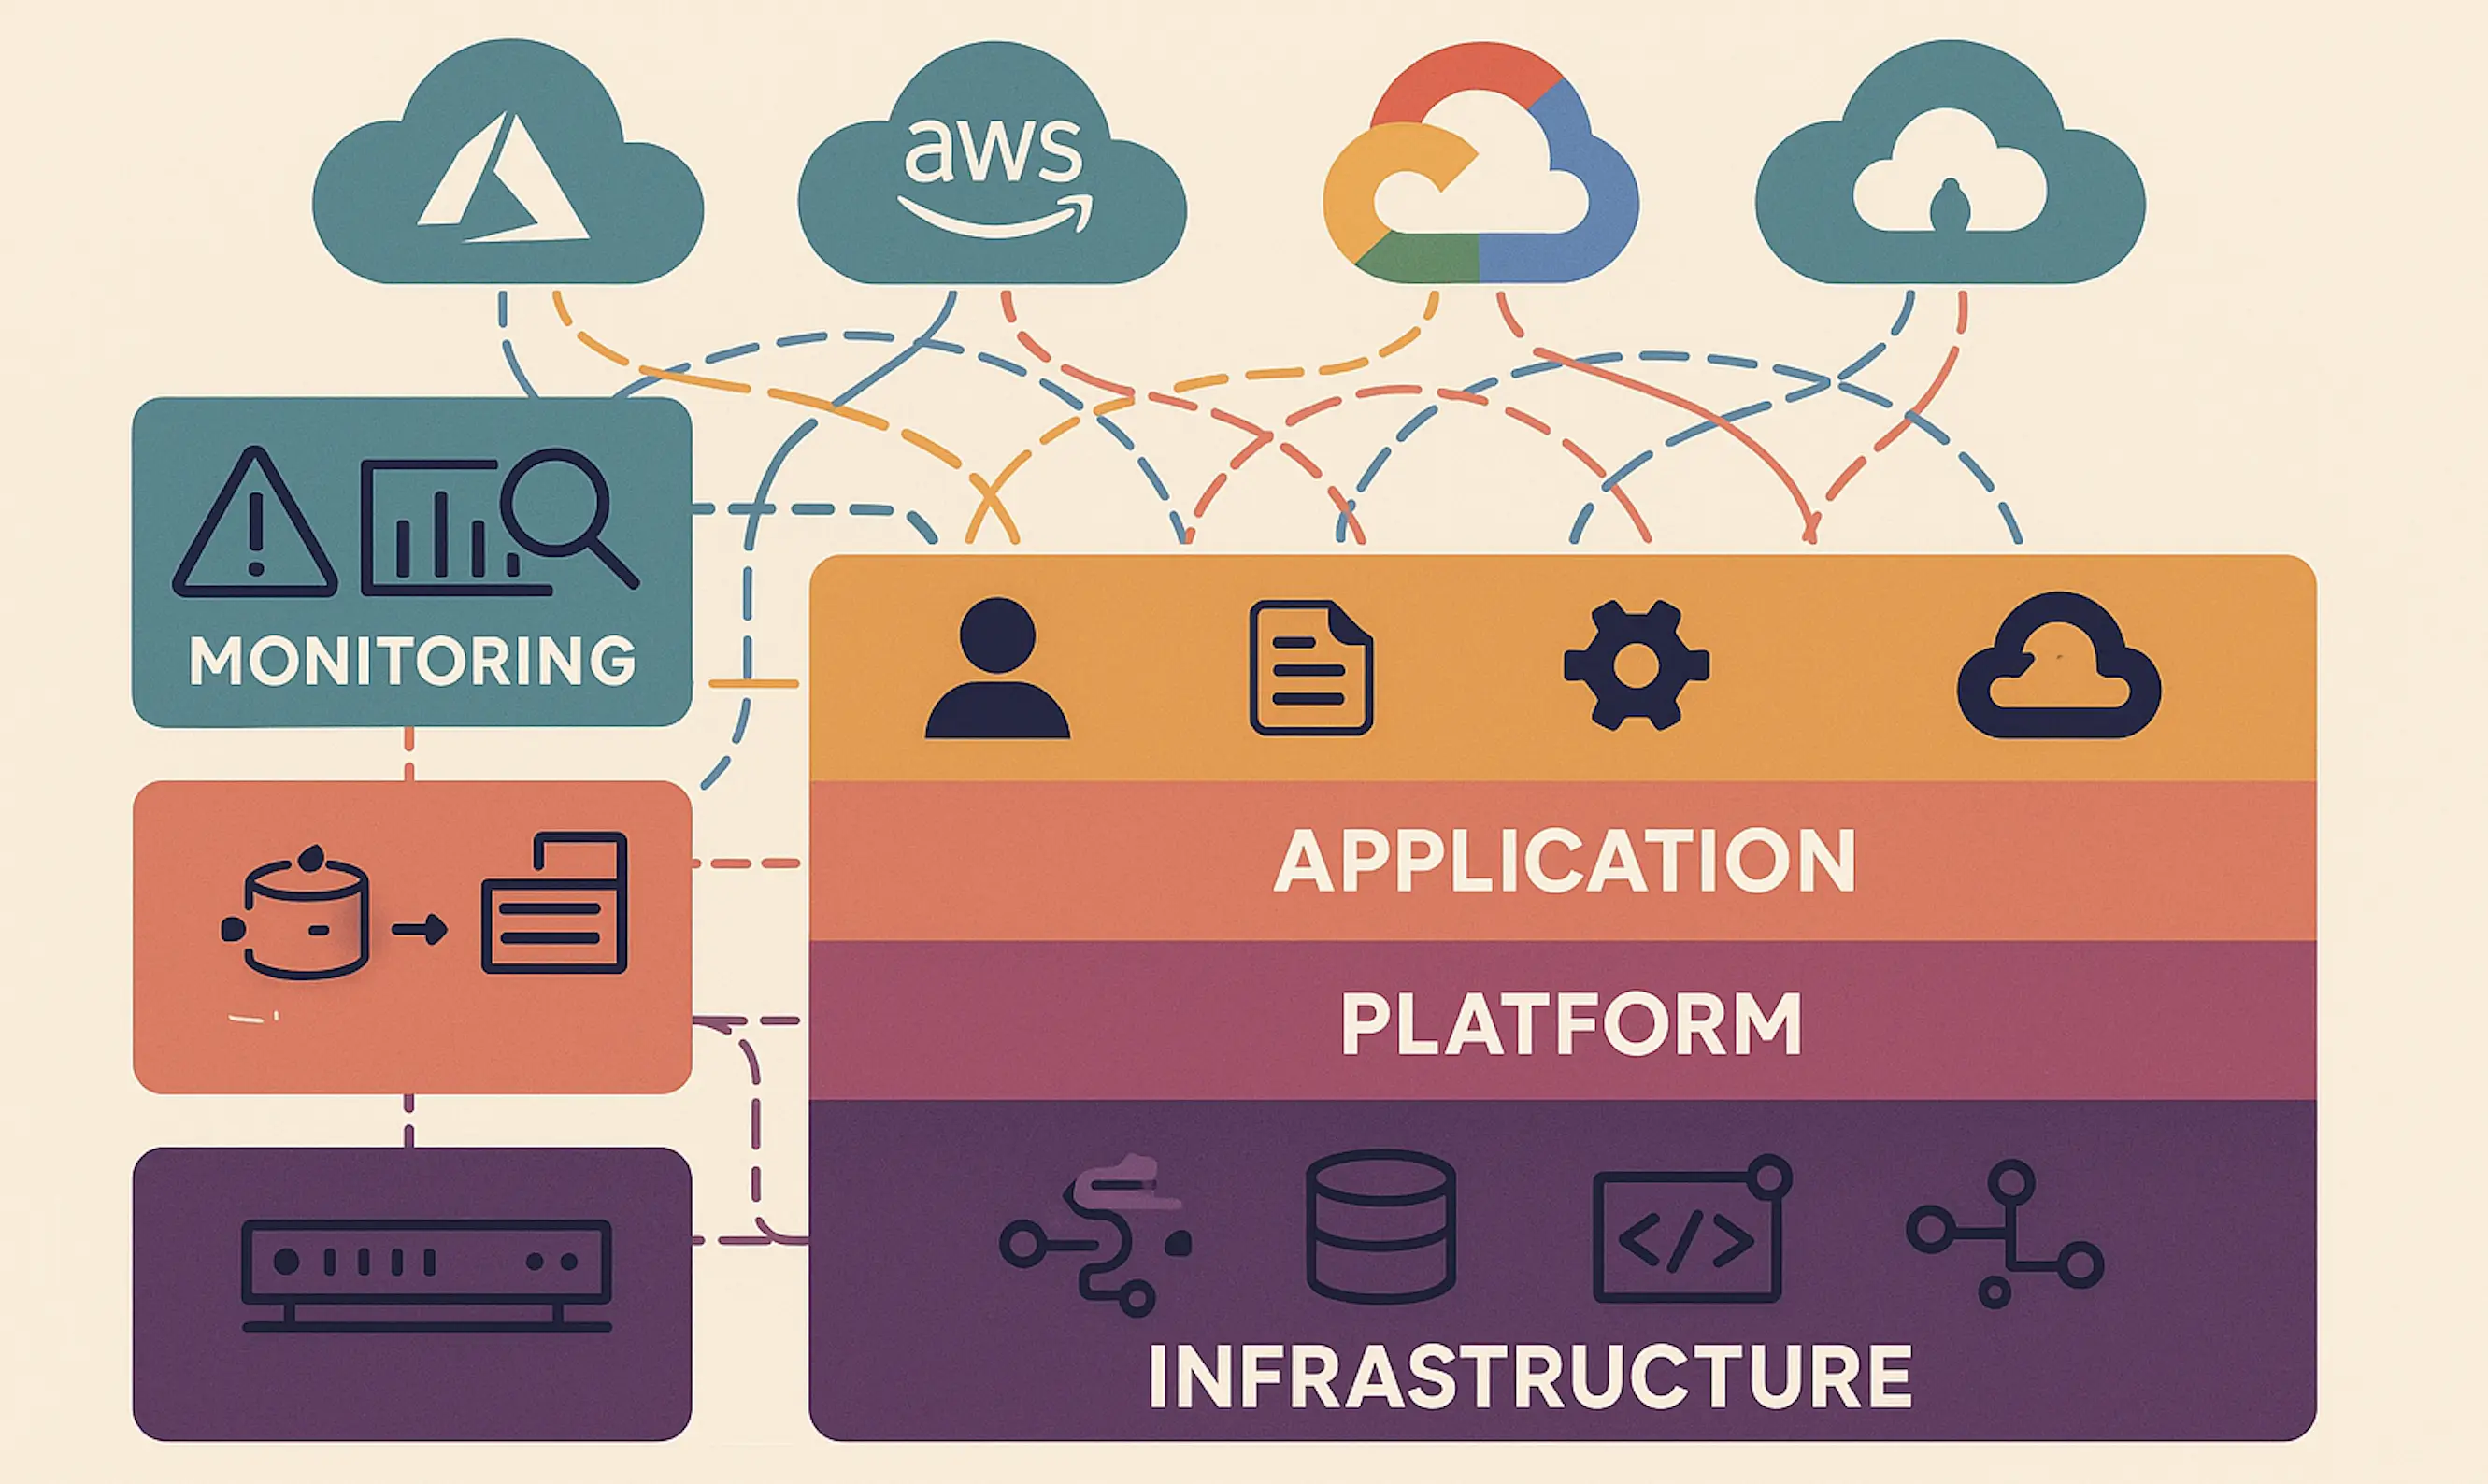
With microservices, containers, serverless functions, and multi-cloud architectures, the scale and dynamic nature of cloud environments generate overwhelming amounts of telemetry. Manual oversight isn’t feasible. Proactive monitoring is the only way to filter signals from noise, ensuring that the right issues are surfaced before they cascade into outages.
User experience and business impact:
End users today expect fast, seamless digital experiences. In cloud environments, even a minor latency spike or short outage can cascade across distributed services. By combining cloud performance monitoring with proactive digital experience monitoring, organizations can detect anomalies early and prevent them from turning into full disruptions. This keeps cloud services responsive, customer journeys smooth, and revenue streams protected.
Cost optimization:
The elasticity of cloud resources is a double-edged sword. While scaling is effortless, uncontrolled provisioning or idle workloads can inflate costs. Continuous monitoring of usage patterns prevents waste, aligns resources to demand, and ensures organizations maximize their cloud ROI. Common examples include VMs orphaned after tests, idle load balancers incurring charges without traffic, or oversized instances consuming more capacity than needed.
Support for DevOps and SRE
Unified monitoring provides real-time telemetry for faster debugging, improved release cycles, and reliability engineering. It strengthens development agility without compromising stability.
Security and compliance:
Cloud environments expand the attack surface through distributed identities, APIs, and network endpoints. Monitoring login attempts, permission changes, and traffic anomalies provides an early defense against threats. Additionally, organizations bound by GDPR, HIPAA, PCI DSS, or similar mandates must continuously track configurations and activity logs to remain audit-ready.
Proactive problem resolution:
Traditional monitoring is reactive: it alerts when things break. Modern cloud monitoring emphasizes prediction and prevention. By identifying unusual trends, forecasting capacity issues, and enabling faster MTTR, monitoring reduces firefighting and helps teams to innovate instead of constantly triaging. This extends to automated remediation; such as restarting failing pods, or rolling back a misconfigured deployment before it causes downtime.
Capacity planning
Historical performance data informs scaling decisions, guiding auto-scaling and preventing under-provisioning or resource sprawl. Scaling happens purposefully while keeping costs in check.
Essential cloud performance metrics
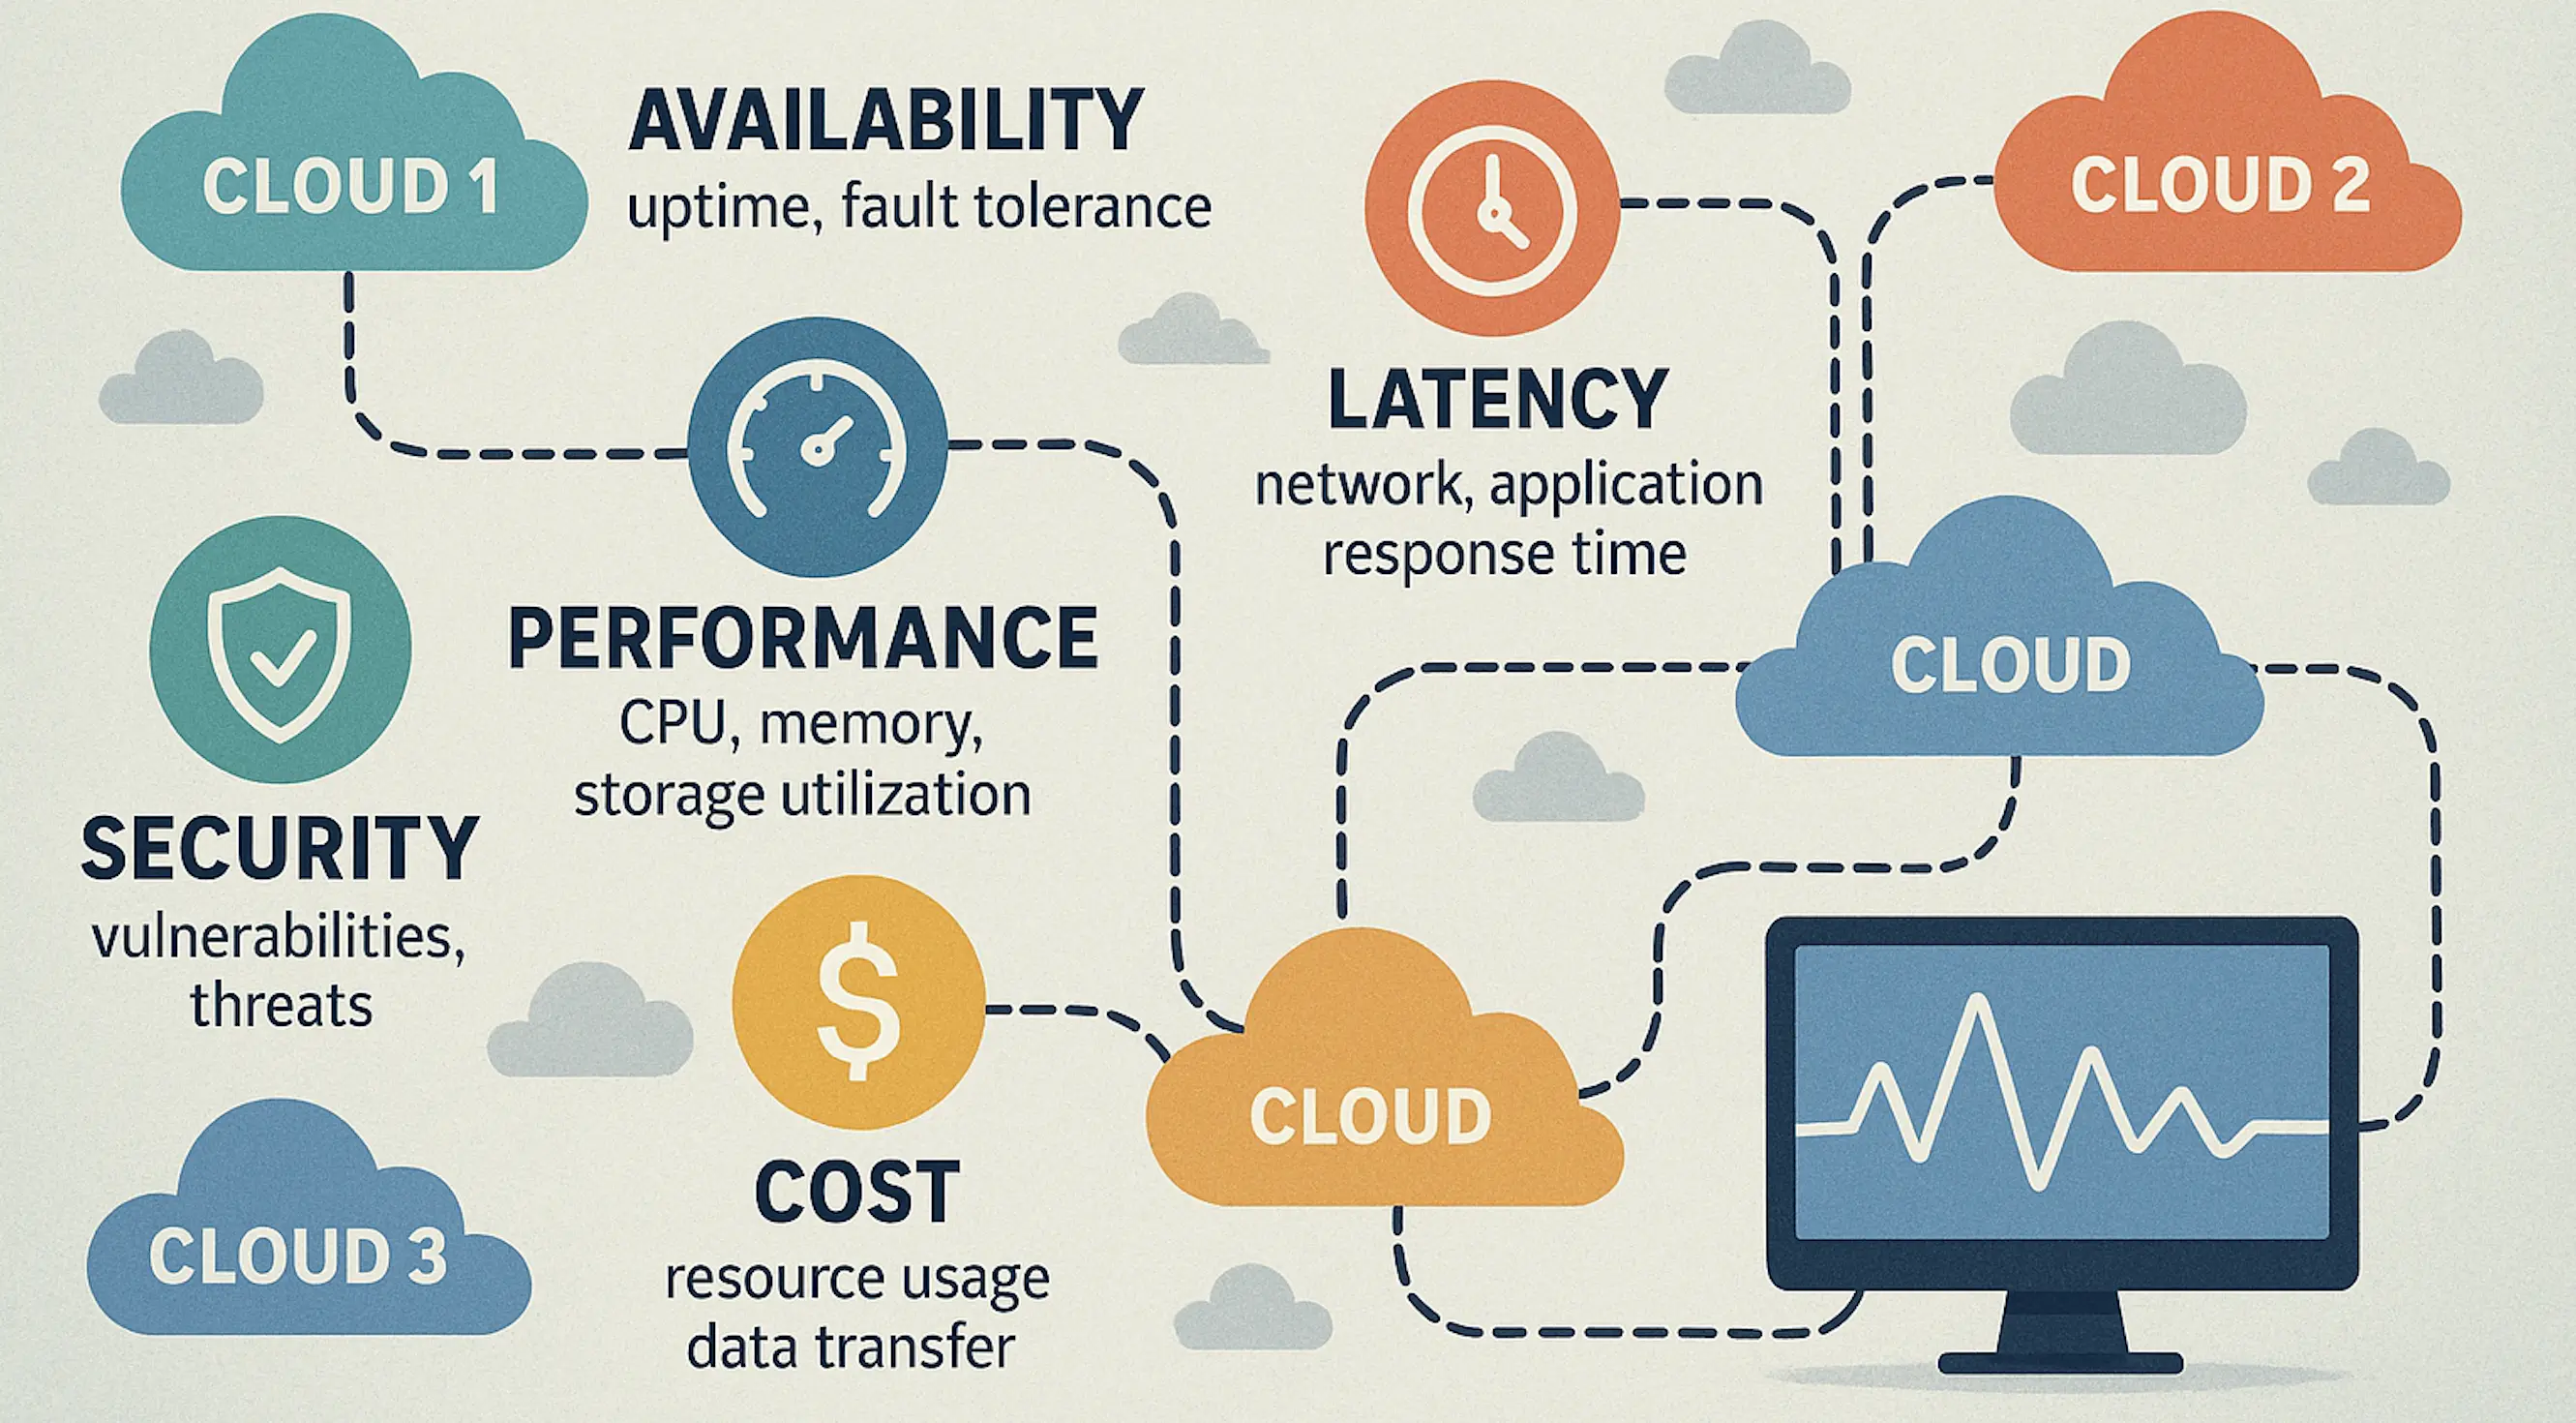
Performance monitoring spans both infrastructure and service layers of the cloud stack. Key categories of metrics ensure holistic visibility:
Infrastructure health metrics
Monitoring CPU, memory, disk usage, and network throughput provides the baseline for system performance. In cloud environments, this must scale across hundreds of instances, with auto-scaling events and ephemeral resources adding complexity. Beyond these, additional indicators such as process/thread counts, load averages, and storage IOPS help uncover deeper resource constraints. Without infrastructure-level insights, downstream service metrics lose context.
Application performance metrics
Transaction response times, error rates, and throughput remain central, but cloud-native apps require deeper tracing across distributed microservices, APIs, and serverless functions. Correlating these metrics with real-time user interactions is key: a single slow microservice can cascade into latency spikes across dependent services, inflate transaction failures, and ultimately disrupt the end-user experience.
For example, if an API gateway queues requests because one backend is lagging, overall performance metrics may look healthy until you drill down into service-level traces. These interdependencies highlight why APM tools that capture end-to-end distributed traces are essential.
Cloud performance metrics
Every cloud provider exposes service-specific telemetry—such as database query performance (RDS, Cosmos DB, BigQuery), queue processing times (SQS, Pub/Sub, Service Bus), and storage I/O latency (S3, Blob Storage, Cloud Storage). Tracking these metrics uncovers bottlenecks that may not surface at the infrastructure level but directly impact end-user experience.
Network and connectivity metrics
In multi-cloud and hybrid environments, monitoring VPN gateways, VPC/virtual network flows, DNS resolution times, and CDN edge performance is crucial. Latency introduced by misconfigured routes or congested links can cascade into major availability issues.
Cost and resource utilization statistics
Utilization metrics tied to cloud billing; such as idle VM hours, underutilized reserved instances, and excessive egress traffic are essential for controlling spend. Continuous visibility ensures resources match demand without waste.
Security and compliance indicators
Failed login attempts, IAM policy changes, misconfigured security groups, and suspicious API calls need to be monitored alongside performance metrics. These signals protect both uptime and compliance posture.
Together, these metrics form a layered monitoring approach; where infrastructure, application, and cloud-native service data converge to provide full-stack visibility.
Core features of cloud performance monitoring tools
A strong cloud monitoring platform connects infrastructure, applications, services, and user experience into one system of intelligence. The most effective tools deliver real-time visibility, diagnostic depth, and cost-aware insights that improve both operations and business outcomes.
Automatic service discovery
Cloud environments are highly dynamic, with resources spinning up and down continuously. Automated service discovery ensures that new VMs, containers, databases, APIs, or serverless functions are detected and monitored without manual intervention. This reduces blind spots, maintains consistent observability, and keeps monitoring aligned with the actual state of the environment.
Multi-vendor monitoring
Healthy infrastructure is the foundation of reliable applications. Tools must monitor cloud VMs, containers, Kubernetes clusters, and serverless platforms, while also tracking configuration changes. Supporting services from multiple cloud vendors (AWS RDS, Azure Cosmos DB, and Google BigQuery) ensures organizations avoid vendor lock-in and gain consistent visibility across providers. This breadth of coverage enables true multi-cloud and hybrid strategies without sacrificing control.
Anomaly detection and intelligent alerts
Cloud monitoring produces massive volumes of telemetry. Smart and configurable alerts that are based on static thresholds, dynamic baselines, or anomaly detection; help teams locate actionable issues early.
Adaptive thresholds automatically adjust to normal fluctuations such as time-of-day traffic spikes; reducing false positives. Anomaly detection goes further by learning behavioral patterns across metrics, spotting deviations that may not breach thresholds but still indicate emerging risks.
Also, integrating with ITSM tools and collaboration platforms route alerts into existing workflows instead of leaving them as isolated signals.
Root cause analysis
Identifying a problem is only half the job. Effective monitoring maps dependencies across services, transactions, and infrastructure layers. With automated RCA and code-level diagnostics, teams can pinpoint the true source of degradation, resolve incidents faster, and reduce the likelihood of repeat issues.
Log management and analysis
Centralizing logs enables cross-correlation with metrics and traces, turning raw text into actionable insights. Advanced search, filtering, and anomaly detection help teams isolate security issues, misconfigurations, and performance degradations quickly.
Application performance management (APM)
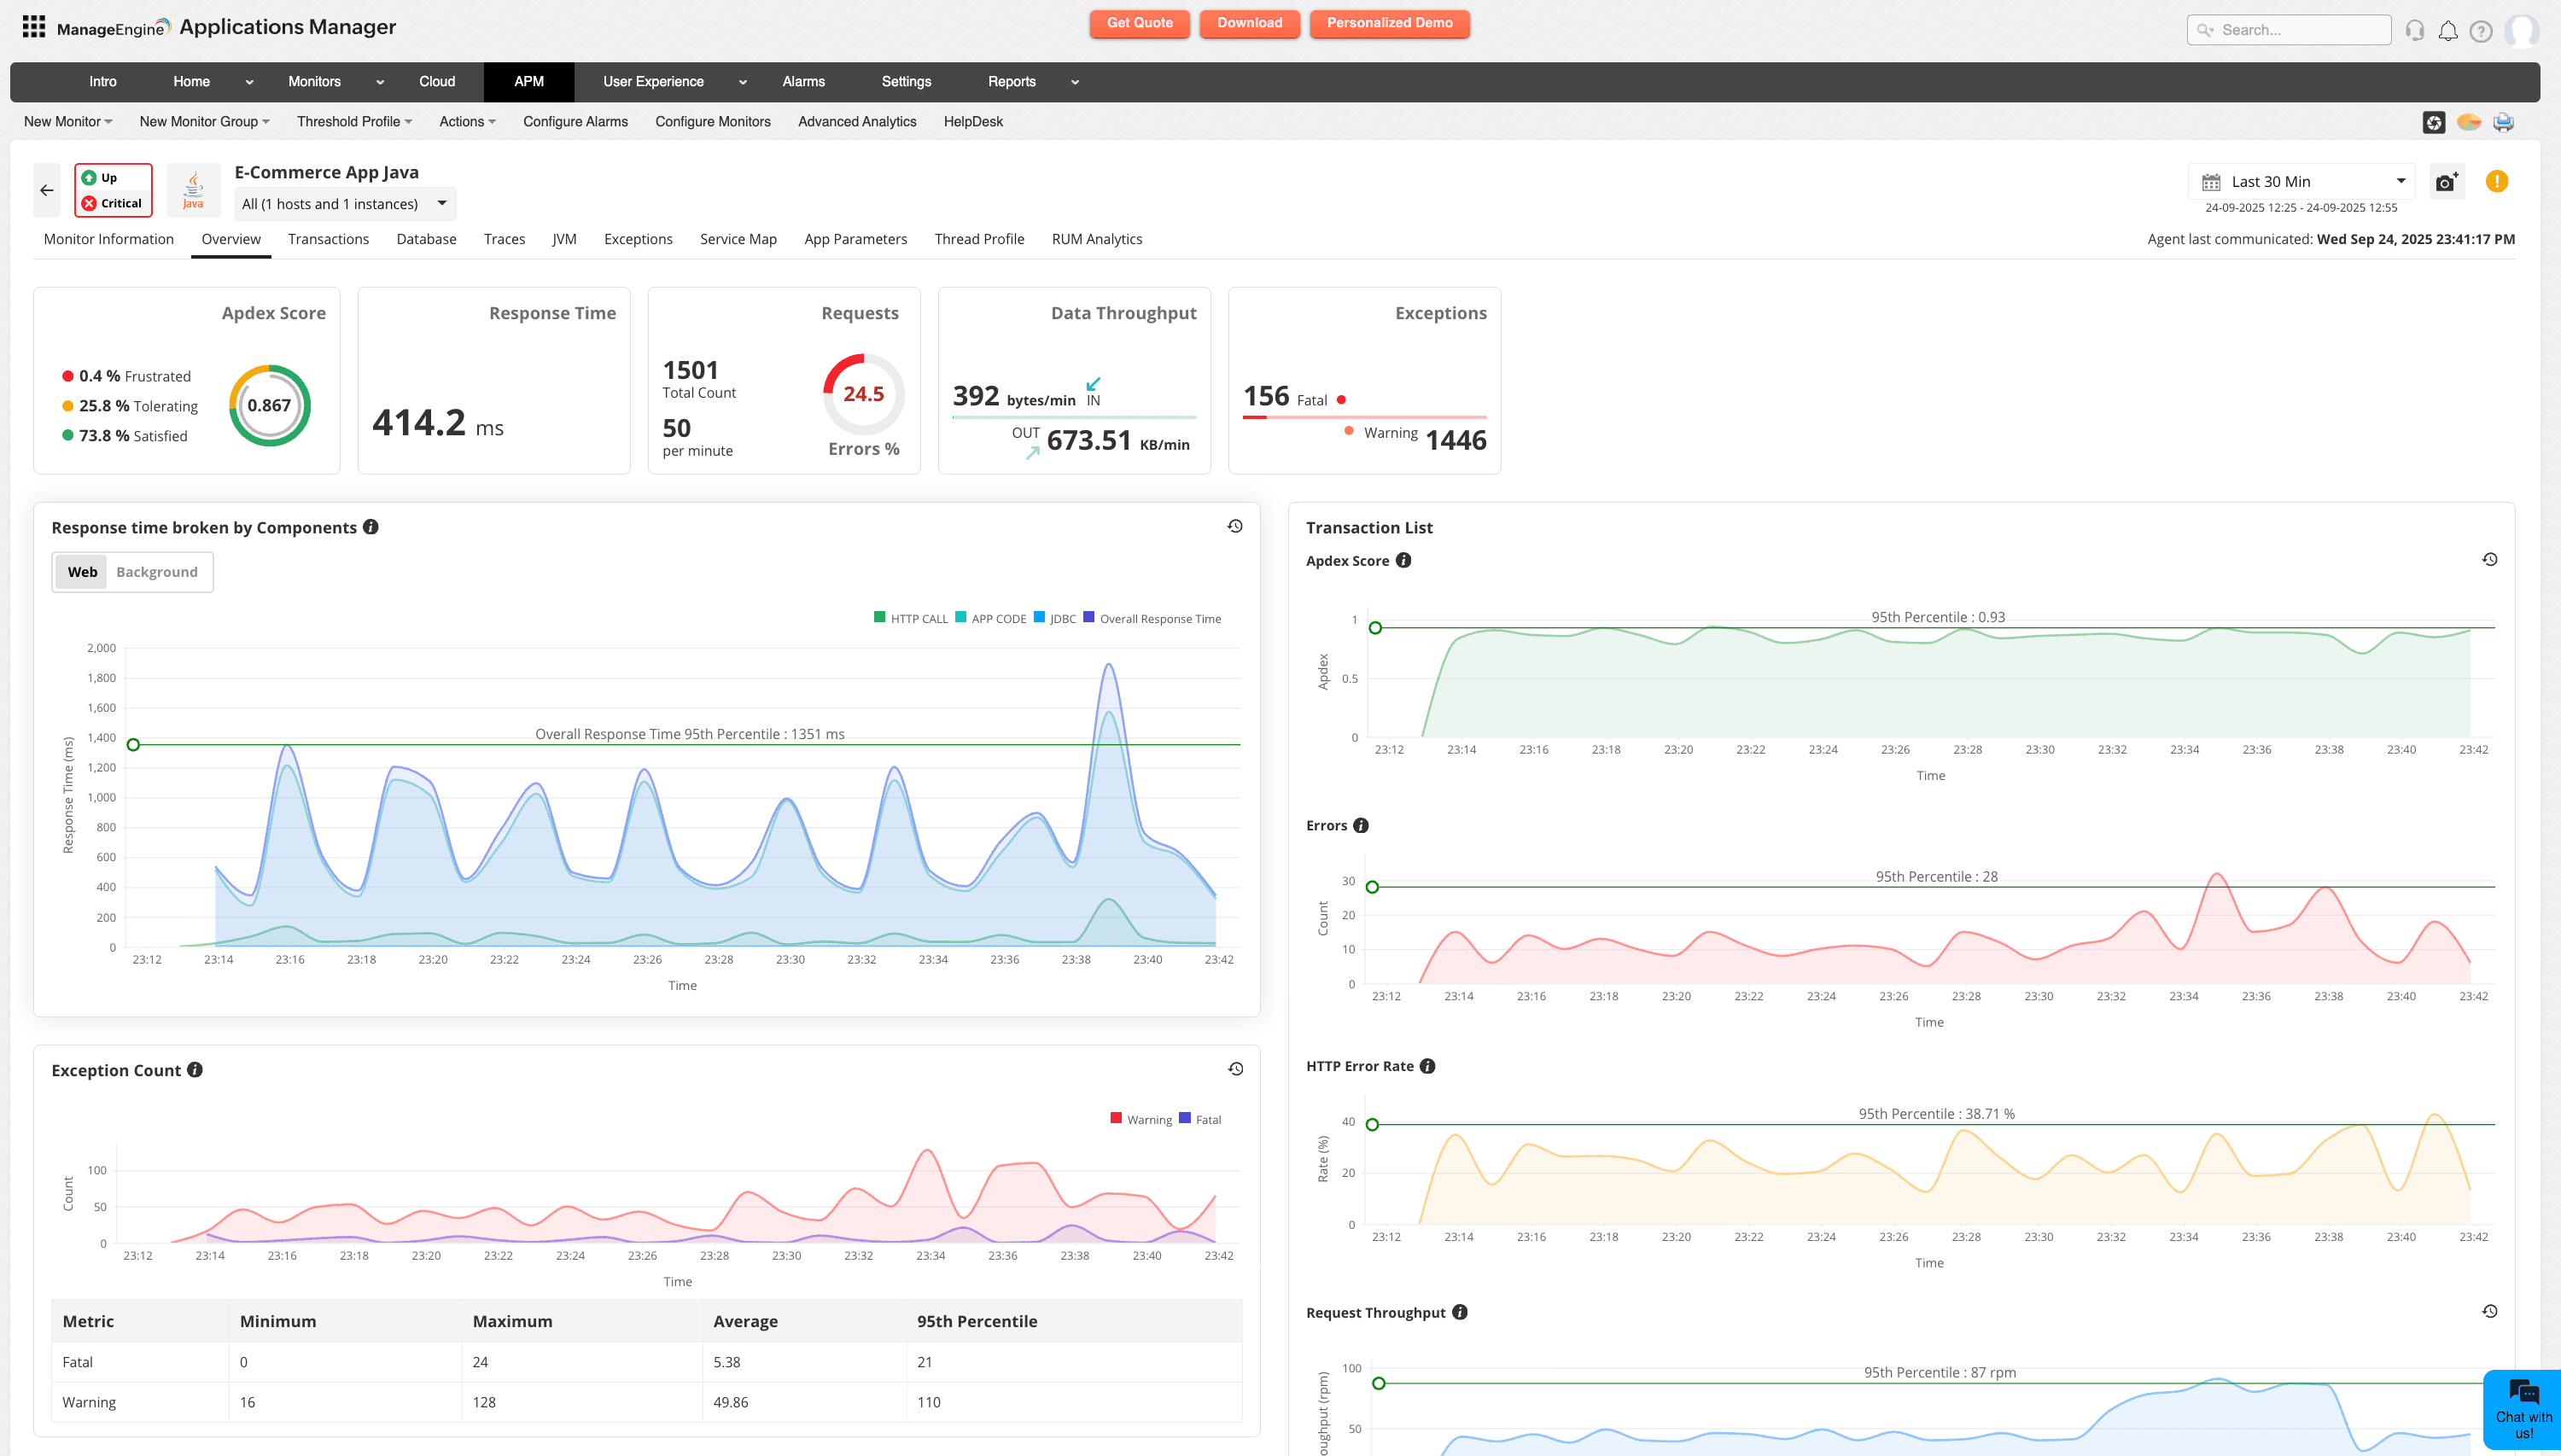
Modern cloud-native applications are composed of distributed services, APIs, and serverless functions where a single transaction may traverse dozens of components. Application performance management (APM) brings code-level execution visibility, SQL query insights, and user interaction tracking, while distributed tracing connects these details end-to-end. Together, they expose where latency originates, highlight cascading failures, and reveal bottlenecks within specific services or dependencies. This combined view enables developers to not only detect slowdowns but also optimize performance before they impact end users.
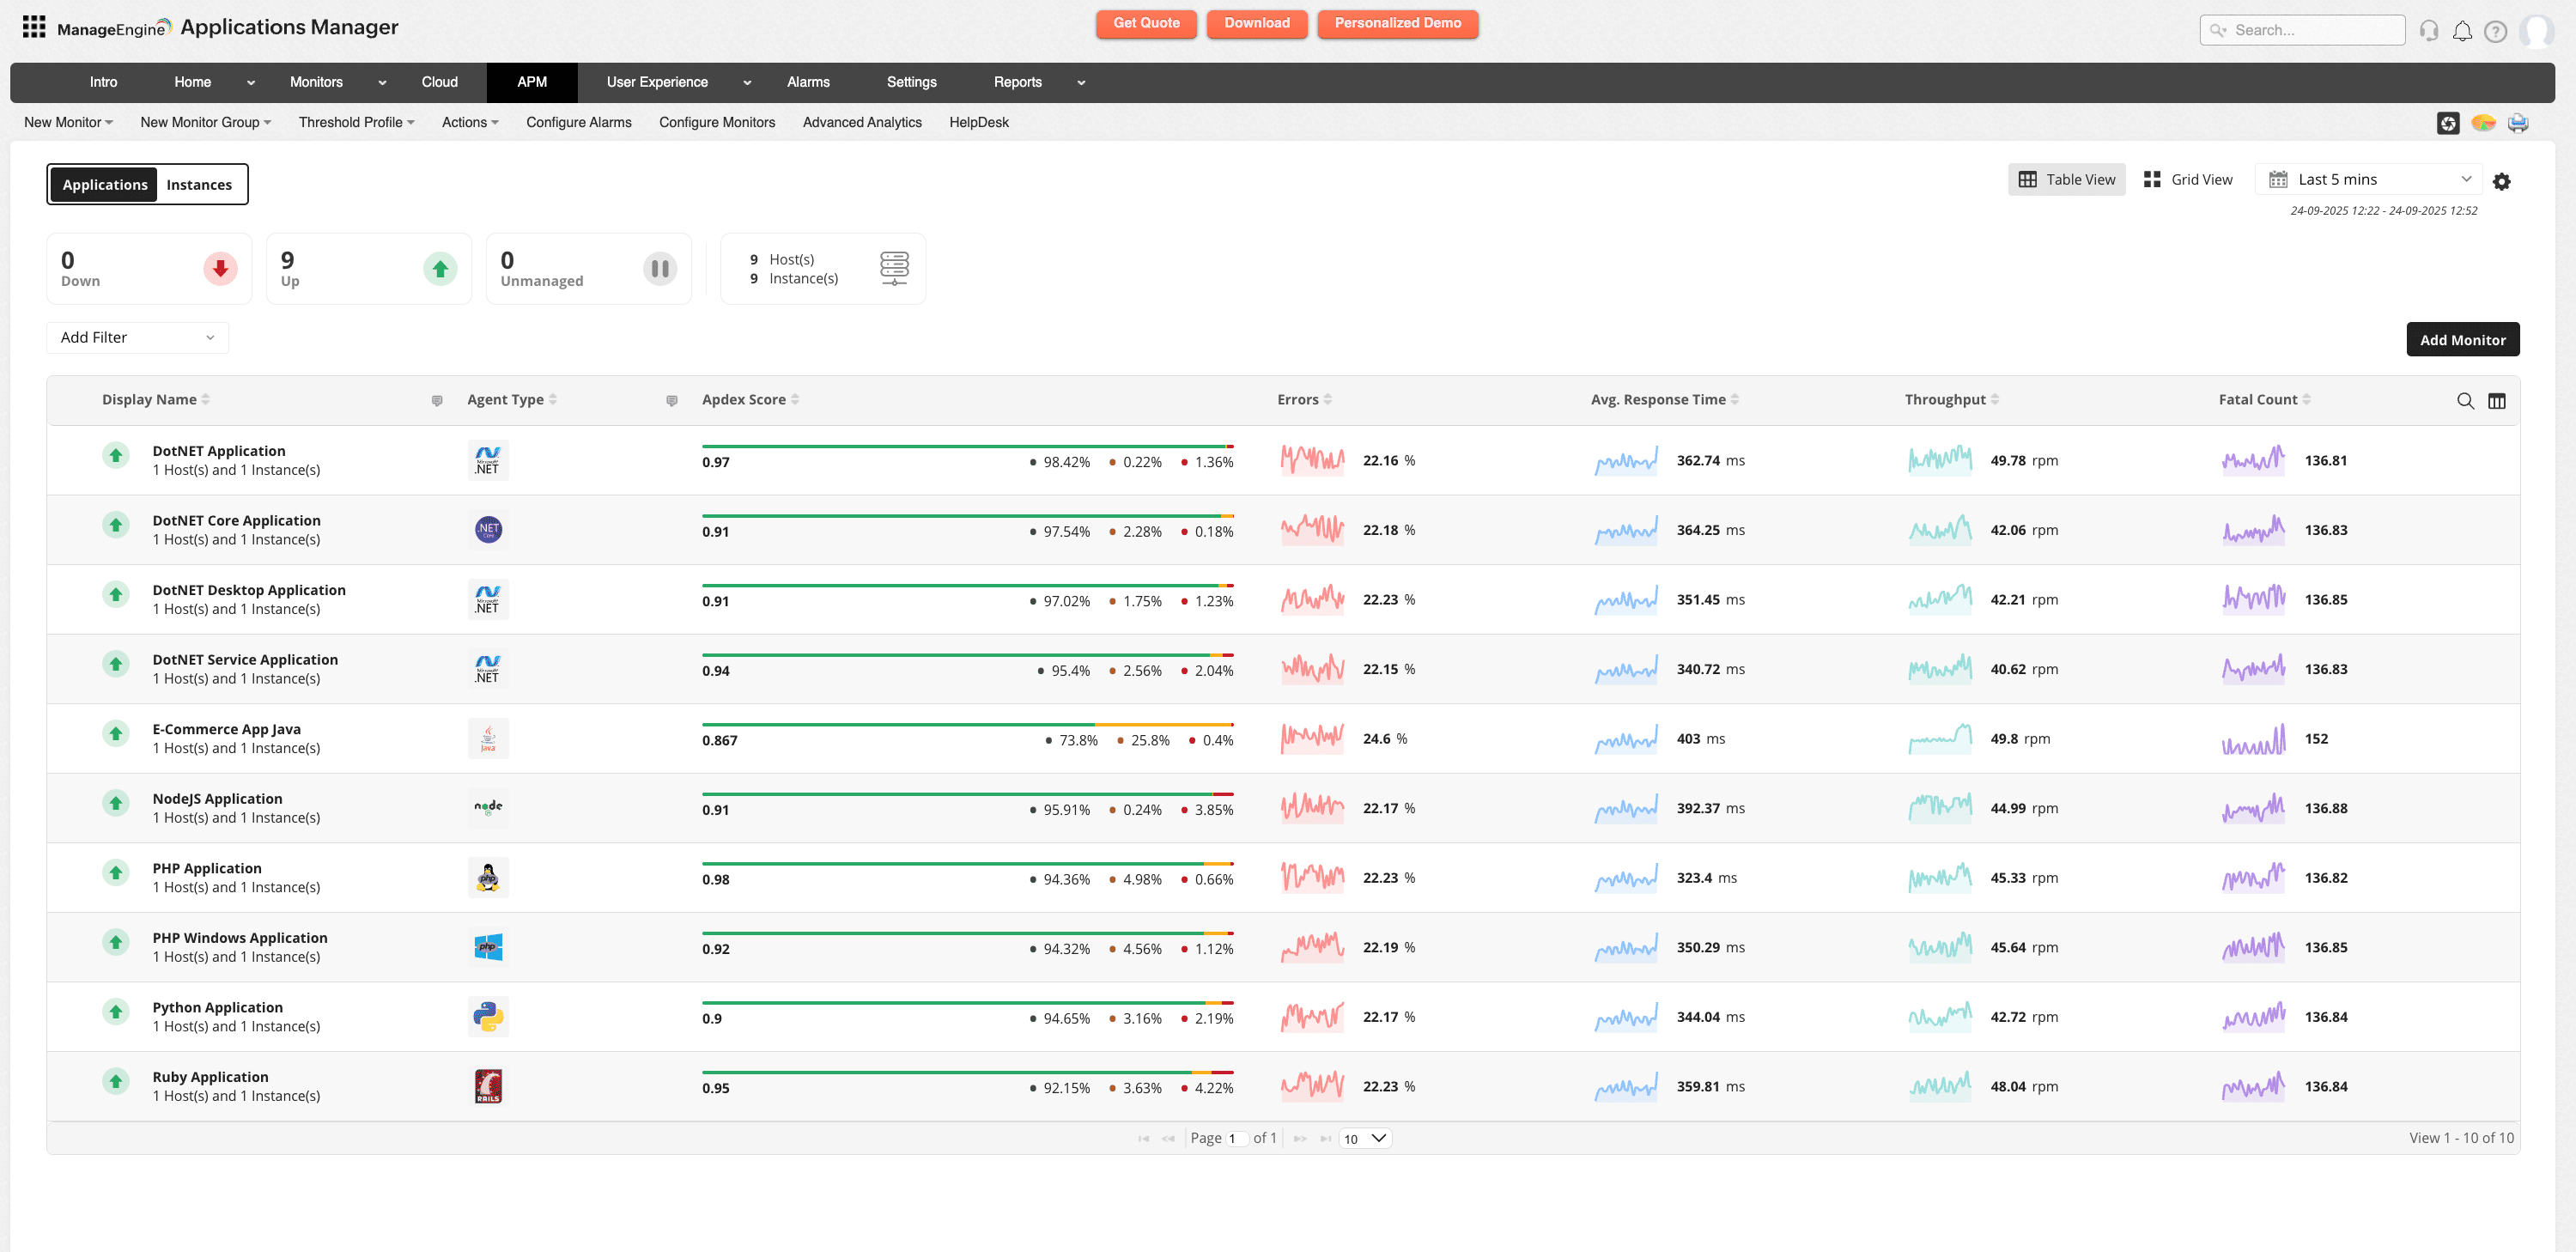
Real-time monitoring and dashboards
Dynamic cloud environments demand continuous visibility. Unified dashboards bring together metrics, logs, and traces across providers, offering customizable views for operations, development, and business teams. This consolidated perspective reduces context switching and accelerates detection and response.
Cost optimization insights
Cloud flexibility can inflate costs when resources go unused or misconfigured. Effective monitoring ties utilization back to business priorities, highlighting idle assets, rightsizing opportunities, and usage anomalies. This makes cost efficiency part of the monitoring practice.
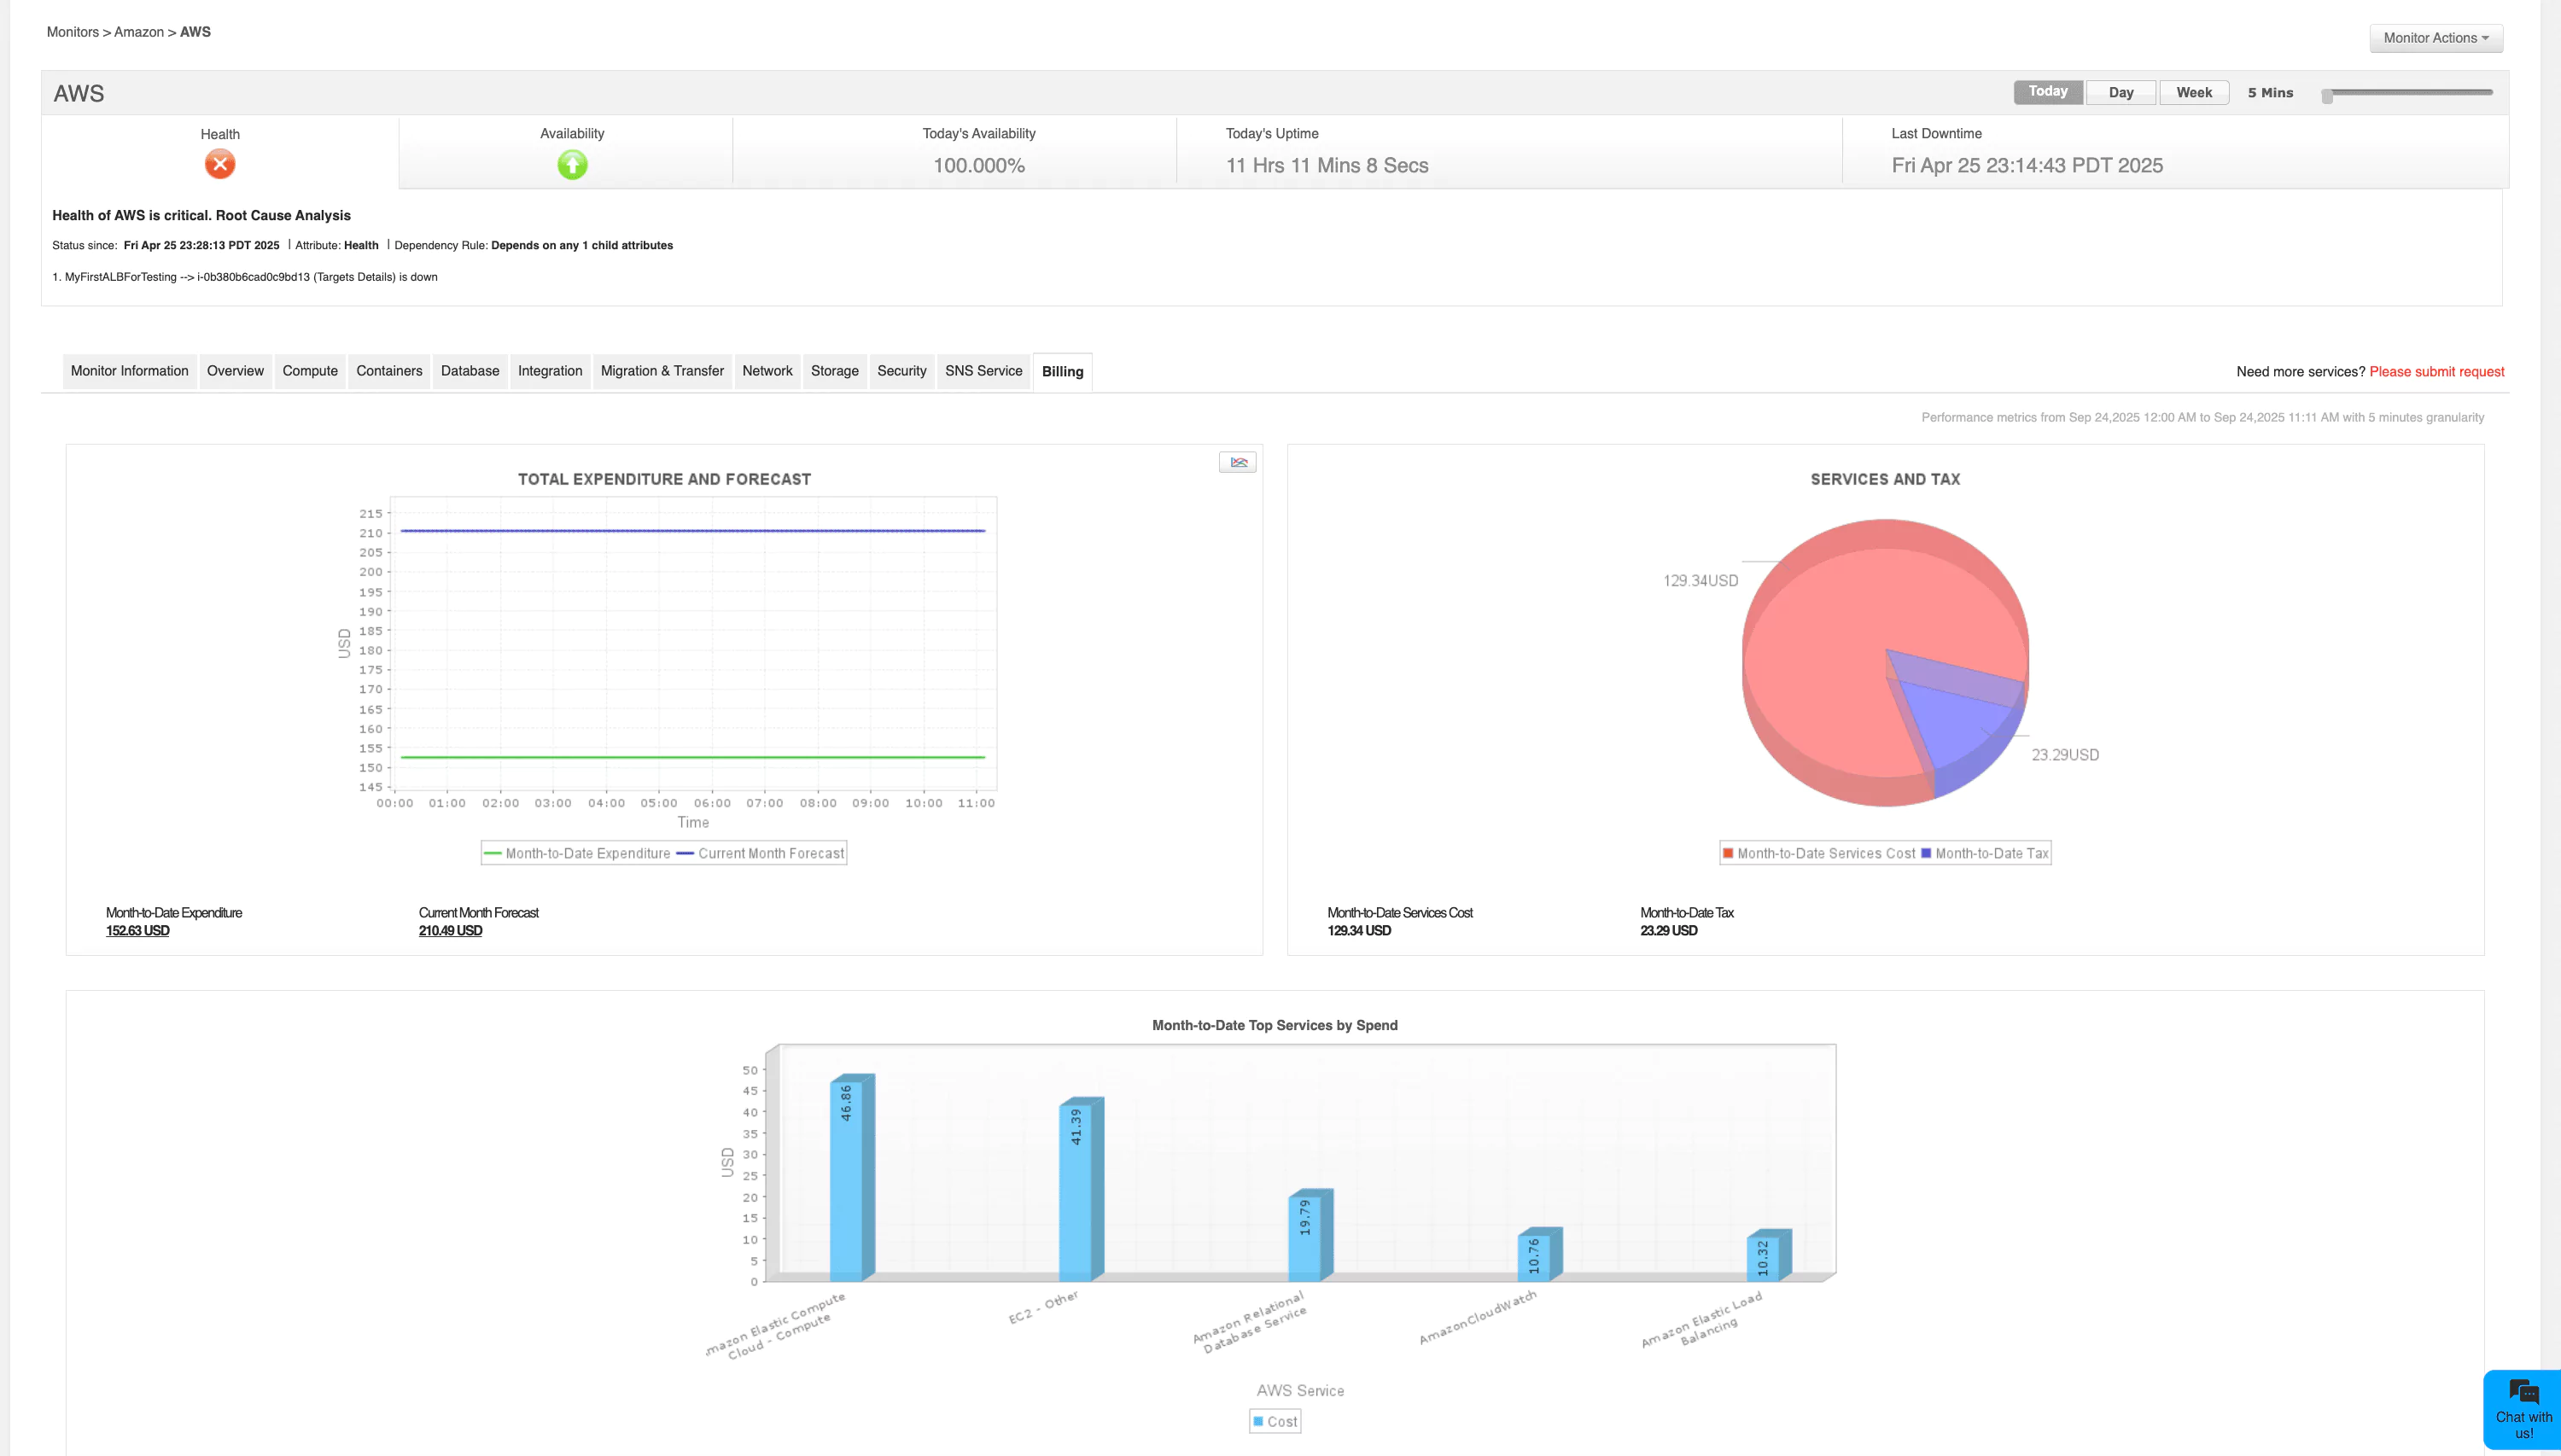
AI/ML-driven insights
Machine learning elevates monitoring beyond reactive management. By detecting anomalies, predicting capacity needs, and correlating signals across layers, AI-driven insights enable proactive decision-making. Instead of chasing alerts, teams can anticipate issues, reduce downtime, and align performance with business goals.
Common malpractices and how to avoid them in cloud monitoring
Cloud performance monitoring delivers the most value when approached with clarity and discipline. The following cloud monitoring mistakes frequently occur and can be avoided with best practices:
Monitoring too much or too less
Malpractice: Either focusing only on basic metrics or collecting excessive data without context.
How to avoid it: Define KPIs aligned with application SLAs and business outcomes. Customize monitoring profiles to balance depth with efficiency, ensuring meaningful data without overwhelming teams.
Ignoring baselines
Malpractice: Misinterpreting normal fluctuations as issues due to lack of historical reference.
How to avoid it: Establish baselines during stable operating periods. Compare new data against these references to differentiate between expected variations and genuine anomalies.
Alert fatigue
Malpractice: Poorly tuned alerts that overwhelm teams and dilute focus on critical issues.
How to avoid it: Implement intelligent alerting with prioritization, escalation paths, and anomaly detection. Focus attention on alerts with tangible business or service impact.
Siloed monitoring
Malpractice: Relying on fragmented tools that limit end-to-end visibility.
How to avoid it: Consolidate monitoring into a unified platform capable of correlating application, infrastructure, and service data for faster diagnosis.
Weak integration with incident management
Malpractice: Adapting monitoring systems that operate separately from incident handling workflows.
How to avoid it: Integrate monitoring with ITSM platforms to alerts trigger tickets, workflows, and escalation automatically, reducing mean time to resolution.
Applications Manager: Comprehensive cloud performance monitoring
ManageEngine Applications Manager delivers unified monitoring across infrastructure, applications, and services. Its capabilities include:
- Visibility: Centralized dashboards unify metrics, traces, and logs, reducing the manual effort in correlating multiple monitoring interfaces. Teams gain contextual insights rather than isolated data points, which accelerates troubleshooting and supports proactive decision-making.
- Diagnostics: Deep-dive capabilities like transaction tracing, distributed monitoring, and APMuncover bottlenecks at the code, database, or service level. This granularity ensures issues are identified before they cascade into outages, keeping both performance and user experience intact.
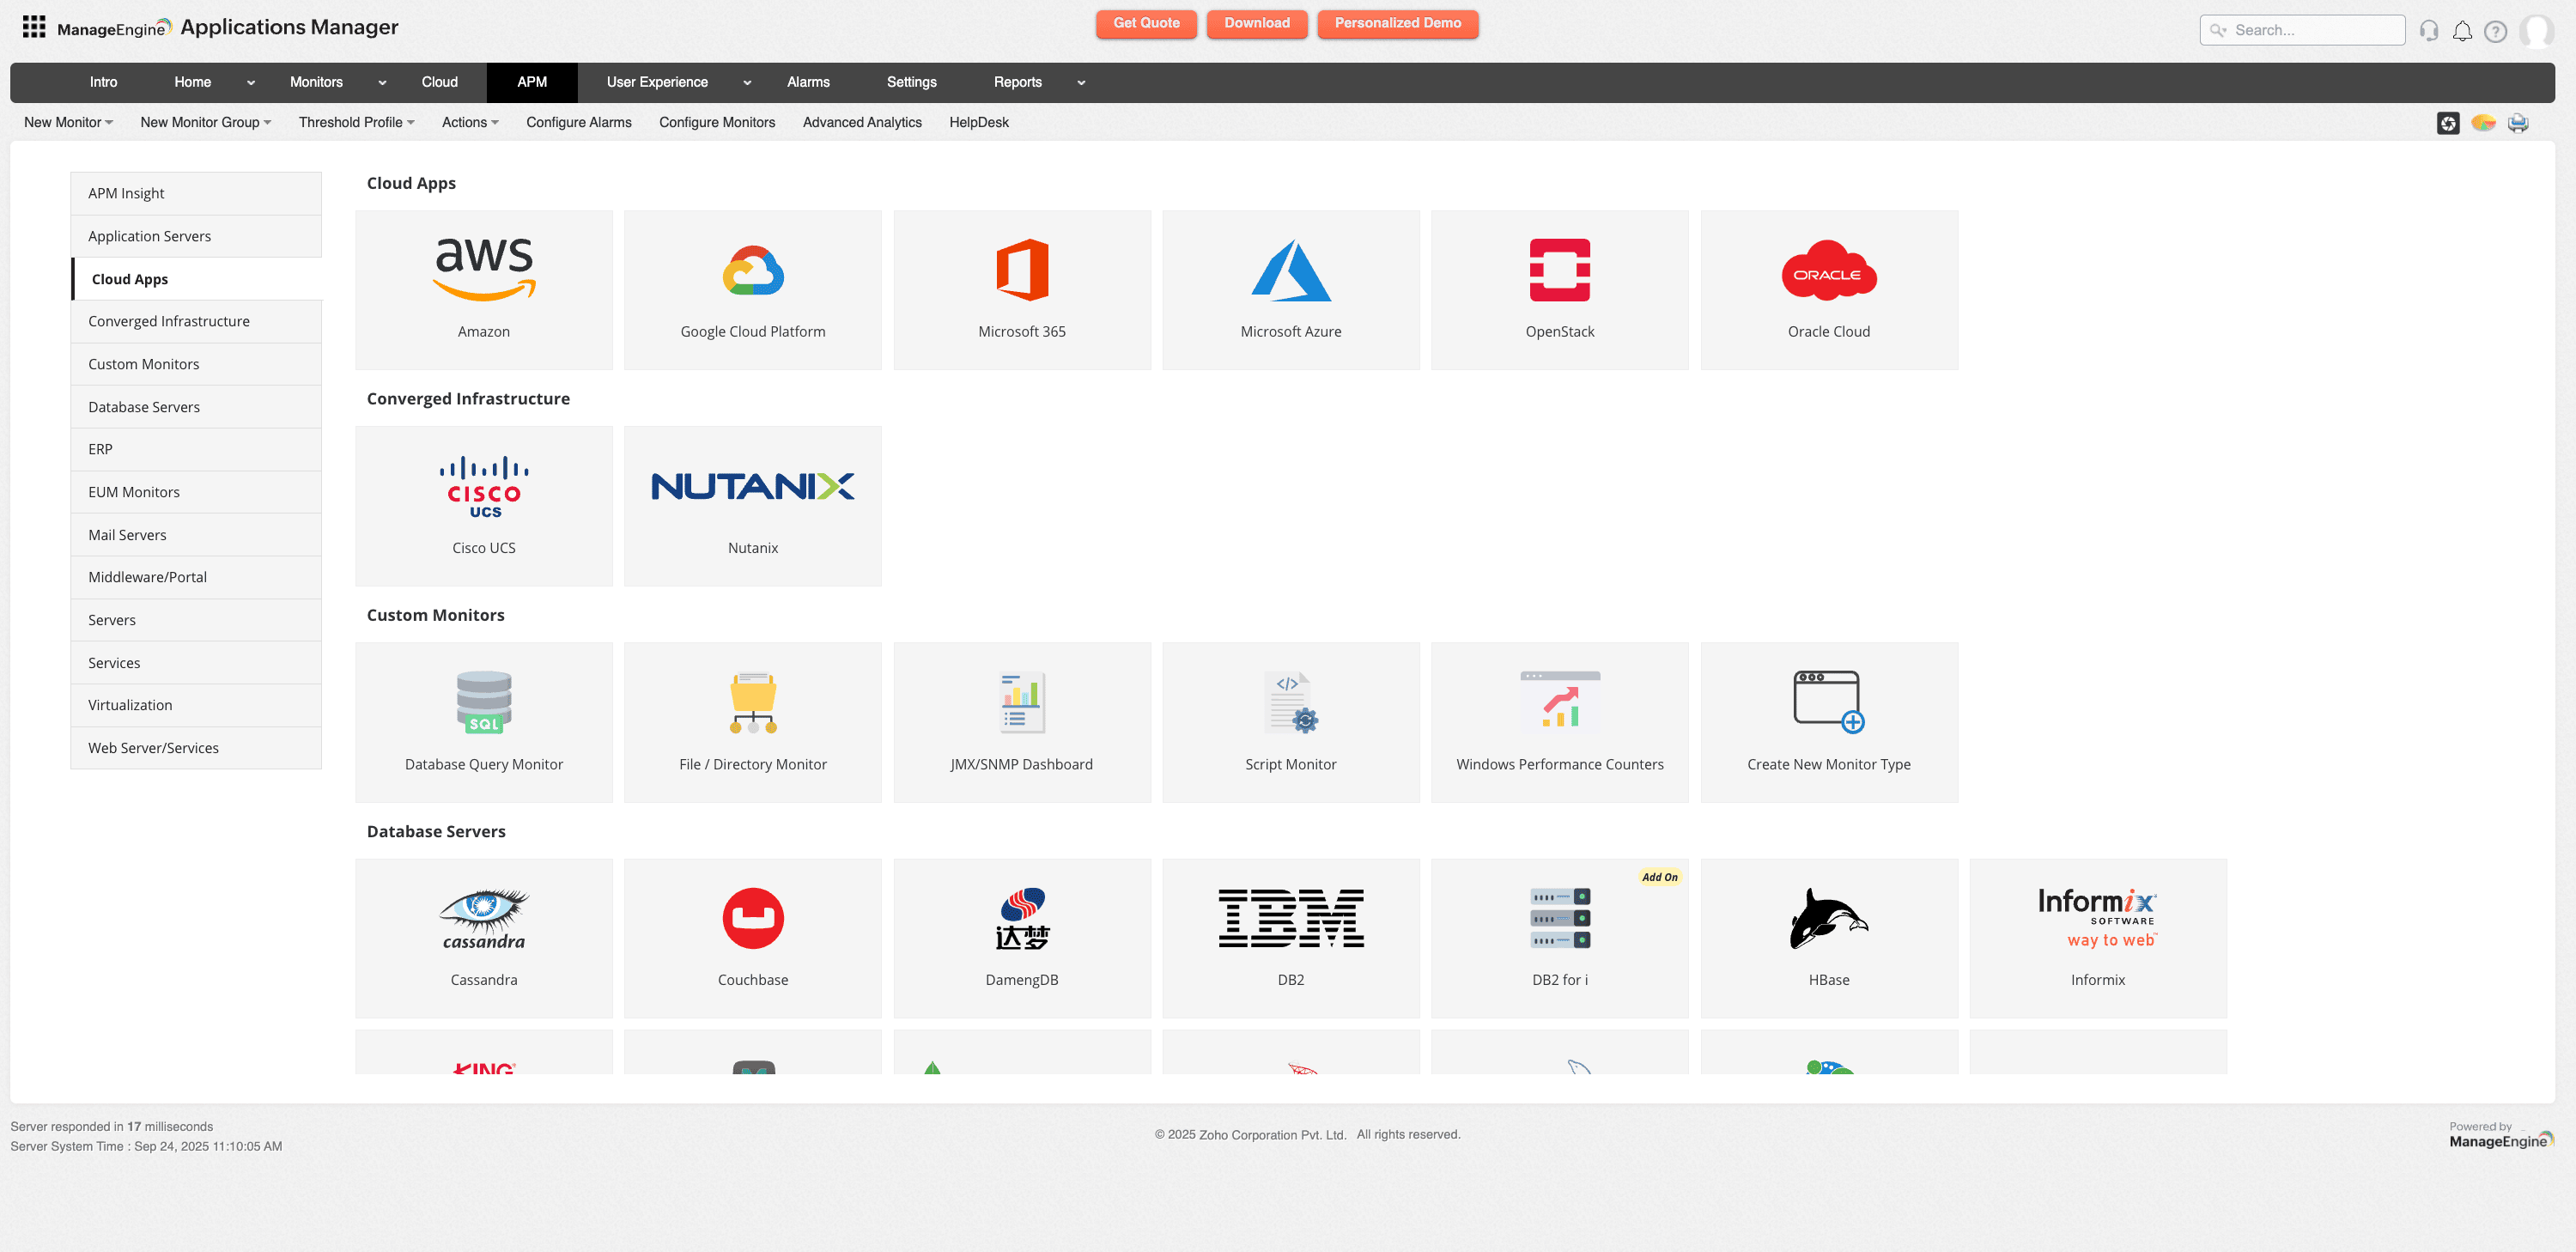
- Coverage: Applications Manager extends across virtual machines, containers, Kubernetes clusters, and serverless workloads. By covering both traditional and cloud-native components, it ensures organizations can monitor the full stack as they evolve toward hybrid and multi-cloud strategies. It helps you dodge vendor lock-in by centralizing cloud monitoring with monitoring support for AWS, Azure, Google, Oracle, Openstack and Microsoft 365 cloud ecosystems.
- Cost optimization: Built-in advanced analyticsidentify idle or underutilized resources, providing actionable insights for rightsizing. This helps align cloud expenditure with business priorities, avoiding waste and ensuring maximum return on investment.
Conclusion
ManageEngine Applications Manager delivers unified monitoring across infrastructure, applications, and services. Its capabilities include:
Cloud performance monitoring has become a cornerstone of modern IT strategy. It safeguards user experience, optimizes resource consumption, and provides the operational intelligence needed for scalability and resilience. The dynamic nature of cloud computing requires continuous measurement and proactive management.
Tools like ManageEngine Applications Manager deliver the visibility, analytics, and automation required to maintain high-performing environments. Organizations that invest in effective monitoring transform operational complexity into a competitive advantage, sustaining performance and ensuring long-term business success.

