Understanding AWS Metrics and Dimensions: A complete guide for effective Cloud Monitoring
Category: Cloud Monitoring
Published on: Nov 18, 2025
10 minutes
In today’s cloud-first world, AWS monitoring is critical for ensuring application reliability, controlling infrastructure costs, and delivering seamless user experiences. At the core of this strategy are AWS metrics and dimensions — the building blocks of actionable insights in Amazon CloudWatch.
Metrics provide raw performance data such as CPU utilization, request latency, or storage size. Dimensions act as filters that add context, letting you drill down by instance ID, region, API stage, or bucket name. Together, they allow precise analysis, trend detection, and issue isolation across your cloud environment.
This guide explains how metrics and dimensions work, and how tools like Applications Manager extend CloudWatch by simplifying metric collection, visualization, and alerting across multiple AWS services.

AWS Metrics: The foundation of Cloud Monitoring
A metric in AWS represents a time-ordered measurement of the performance and health of your cloud resources. Think of metrics as numerical measurements that gauge your infrastructure's behavior.
Key Characteristics of Metrics with Examples:
- Time-series data: Each metric comprises data points with timestamps, allowing trends to be tracked over time. For example, EC2’s CPUUtilization metric tracks CPU usage at regular intervals so you can see if performance changes during peak traffic hours.
- Numerical values: Metrics represent quantifiable measurements such as CPU percentage, response times, or error counts. For instance, S3’s NumberOfObjects metric measures the number of files stored in a bucket, enabling accurate monitoring of storage growth and cost forecasts.
- Resource-specific: Each AWS service generates metrics relevant to that service. EC2 publishes metrics like CPUUtilization, NetworkIn/Out, and DiskReadOps, while RDS provides DatabaseConnections and FreeableMemory.
- Retention periods: Data points have varying retention schedules based on resolution, allowing both short-term troubleshooting and long-term performance analysis.
These metrics are automatically collected and stored in Amazon CloudWatch, which acts as the central monitoring framework across AWS services.
Standard vs. Custom Metrics
Standard AWS Service Metrics
AWS automatically publishes standard service metrics to CloudWatch, providing a reliable foundation for monitoring. These built-in metrics cover essential health indicators and can be visualized directly in dashboards for quick insights. For example, EC2 instances report metrics like CPUUtilization , NetworkIn/Out , and DiskReadOps , while RDS tracks DatabaseConnections and FreeableMemory . Collected automatically at regular intervals (typically every 1–5 minutes), these metrics give you a consistent view of infrastructure performance.
Custom Metrics
Custom metrics let you track application-specific or business-relevant KPIs that go beyond standard metrics. These might include API response times, transaction counts, or latency for critical functions. Combined with dimensions, custom metrics make dashboards more meaningful by aligning technical data with business outcomes.
You can publish custom metrics via the CloudWatch Agent, AWS SDKs, application code, or Lambda functions. Each unique custom metric (name + dimensions + namespace) incurs costs, so careful design is essential to avoid unnecessary charges.
What are AWS Dimensions?
Dimensions are key-value pairs that bring context to raw AWS metrics. They categorize metrics by grouping related data points (for example, all CPU metrics grouped by InstanceId), enable filtering so you can drill down to specific resources rather than monitoring averages across the entire environment, create unique identities that distinguish between similar resources, and support aggregation by rolling up data across multiple resources, like calculating average CPU usage across all EC2 instances in a region.
Without dimensions, CloudWatch would only show environment-wide averages, making it difficult to pinpoint which specific resource is under stress.
Examples:
- EC2: InstanceId=i-12345 highlights CPU usage for a single application server. If that server hits 90% CPU, dimensions let you isolate the issue to that server instead of assuming your entire EC2 fleet is overloaded.
- Lambda: FunctionName=PaymentProcessor tracks invocation errors for just the payment workflow, preventing noise from unrelated functions and helping teams debug customer-facing issues faster.
Other Key Components of AWS CloudWatch Metrics
Beyond standard and custom metrics, CloudWatch uses a few additional components that shape how monitoring data is collected, stored, and interpreted:
- Namespaces Every metric in CloudWatch lives within a namespace , which acts like a container. For
example, EC2 metrics are
grouped under
AWS/EC2, while RDS metrics live underAWS/RDS. This structure prevents naming conflicts and helps organize metrics by service. - Timestamps Each metric data point is tied to a timestamp , which makes CloudWatch a true time-series database . This allows you to trend performance over time — for instance, viewing how CPUUtilization for an EC2 instance fluctuated during peak traffic hours.
- Units Metrics can include units of measurement such as Percent, Bytes,
Seconds, or Count. For
example, EC2’s
CPUUtilizationis expressed as a percentage , while S3’sBucketSizeBytesis expressed in bytes . Units help you interpret metrics consistently across dashboards and alarms. - Resolution CloudWatch supports both standard (1-minute granularity) and high resolution (as fine as 1-second). High-resolution metrics are useful in scenarios like monitoring latency for a high-frequency trading app or debugging short-lived spikes in API errors.
As a combination, namespaces, timestamps, units, and resolution give context to CloudWatch metrics and ensure they can be meaningfully analyzed, aggregated, and acted upon.
How Metrics and Dimensions Work Together
The relationship between metrics and dimensions creates the foundation for effective monitoring. Each metric can have up to 10 dimensions, and the combination of metric name, namespace, and dimensions creates a unique metric identity.
Example – EC2 CPUUtilization
- Metric Name: CPUUtilization
- Namespace: AWS/EC2
- Dimension: InstanceId=i-12345
This combination means you can:
- Per-instance view : View the CPU utilization for that one EC2 instance.
- Filtering : Focus only on a specific instance or group of instances.
- Aggregation : Round up data (e.g; average CPU across all instances in us-east-1).
This identity mapping is how CloudWatch uniquely tracks and displays each metric. The flexibility of this method enables both resource-specific monitoring and broad infrastructure visibility.
AWS Metrics and Dimensions by service
Monitoring in AWS isn’t just about raw numbers — it’s about pairing metrics (the data points) with dimensions (the context that makes the data meaningful). Metrics tell you what is happening, while dimensions tell you where or to which resource it applies.
Together, they allow you to filter, drill down, and create precise monitoring views in CloudWatch or tools like Applications Manager . Knowing these combinations is vital when building AWS monitoring dashboards, as it ensures that both performance and business-level insights are captured in a structured way.
| Category |
Service |
Key Metrics |
Common Dimensions |
Example Use Case |
|---|---|---|---|---|
| Compute |
EC2 |
CPUUtilization, NetworkIn/Out, DiskRead/WriteOps, StatusCheckFailed |
InstanceId, InstanceType, ImageId |
If CPUUtilization > 85% for InstanceId=i-12345, you know one app server
is overloaded instead of
assuming the whole fleet is. |
| Lambda |
Duration, Errors, Invocations, ConcurrentExecutions |
FunctionName, Resource, ExecutedVersion |
Filtering FunctionName=PaymentProcessor shows if errors are isolated to
payments, avoiding noise from
other functions. |
|
| Database |
RDS |
CPUUtilization, DatabaseConnections, FreeableMemory, Read/WriteLatency |
DBInstanceIdentifier, DBClusterIdentifier, EngineName |
If orders-db-1 has high ReadLatency, you can correlate it with query spikes
from the order app instead
of assuming all RDS nodes are impacted. |
| Storage & Apps |
S3 |
BucketSizeBytes, NumberOfObjects, AllRequests, 4xx/5xxErrors |
BucketName, StorageType, Region |
Tracking customer-uploads bucket isolates errors to that bucket, rather than
the entire S3 service. |
| API Gateway |
Count, Latency, IntegrationLatency, 4xx/5xxErrors |
ApiName, Stage, Method |
Filtering ApiName=CheckoutAPI + Stage=prod highlights issues in production
checkout endpoints, not test
environments. |
How to Use Metrics and Dimensions in AWS CloudWatch
- Filter Metrics with Dimensions: Use dimensions in CloudWatch dashboards or queries to isolate specific resources (e.g., only EC2 instances with a given InstanceId).
- Create Precise Alarms: Create precise alarms by tying them to specific dimensions—such as InstanceId, FunctionName, or BucketName—rather than overall CPU usage. This reduces noise and prevents false positives.
- Aggregate for Trends: Roll up data by dimensions like Region or InstanceType to see broader trends while still being able to drill down.
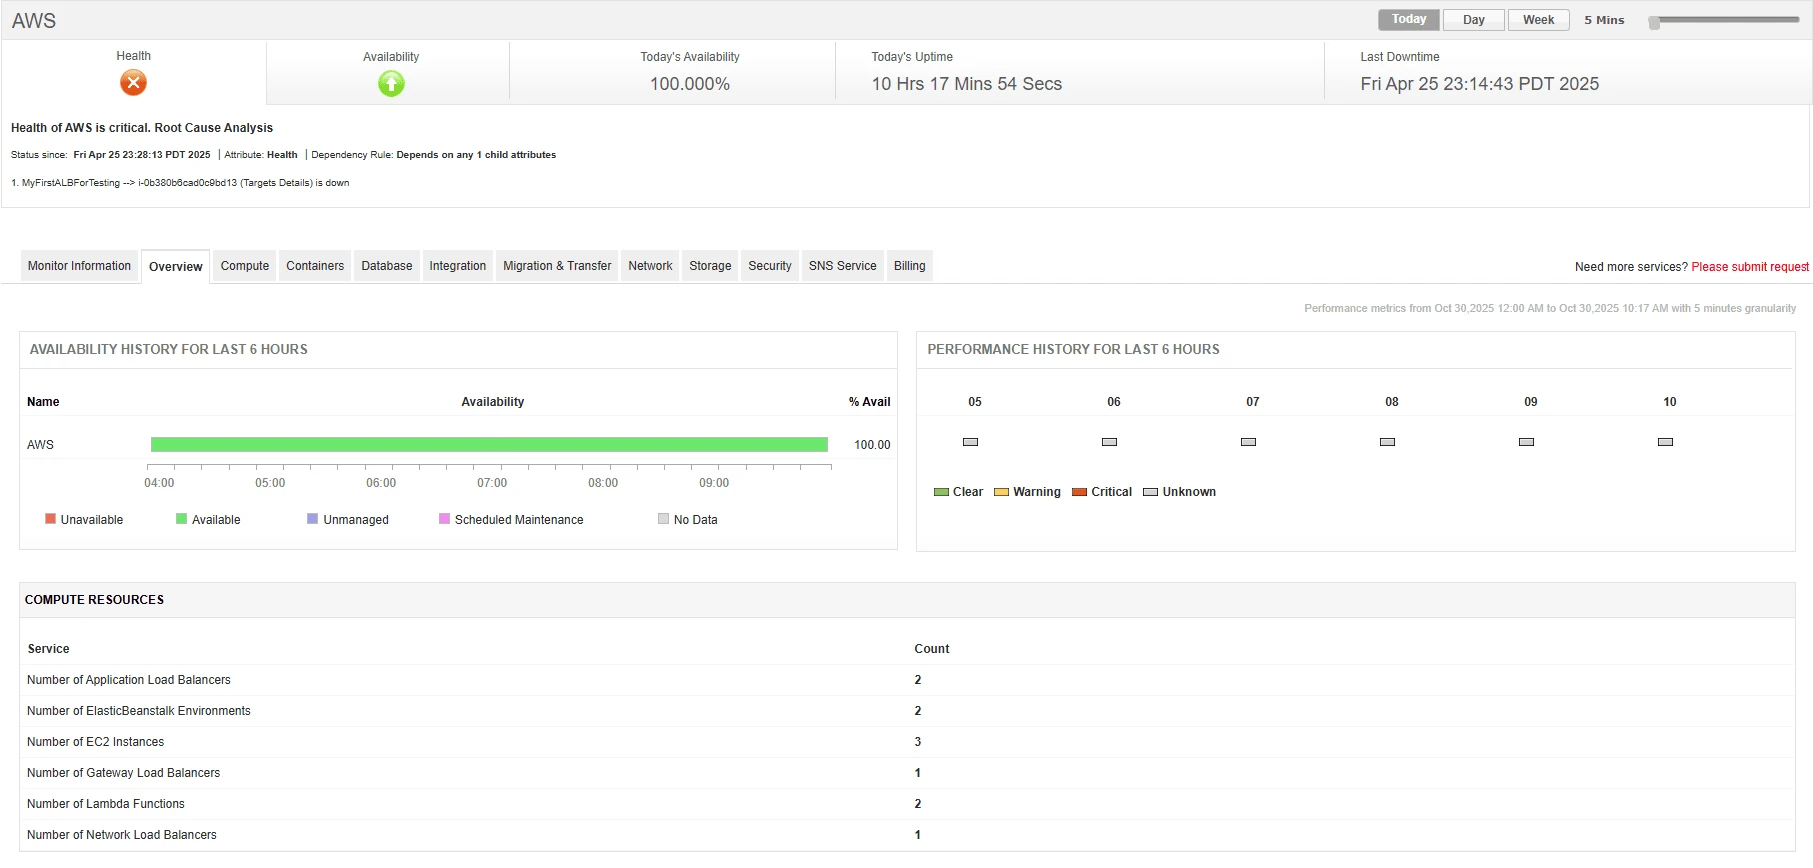
- Applications Manager Integration: When AWS metrics are pulled into Applications Manager, dimensions work like instance-level attributes or filters. For example, you can track CPUUtilization per EC2 instance, or aggregate all RDS connections in a region.
Best Practices for AWS Metrics and Dimensions
1. Strategic Dimension Pattern
Do’s:
- Use consistent naming conventions across the organization to keep dashboards readable and scalable.
- Include environment identifiers (e.g., prod, staging, dev) for clear filtering.
- Add business-relevant dimensions like team or cost-center to connect monitoring data with ownership and cost allocation.
Don’ts:
- Avoid high-cardinality dimensions such as timestamps or request IDs, which increase storage costs.
- Don’t exceed the 10-dimension limit per metric, as CloudWatch will reject the data.
2. Metric Organization Strategy
Namespace Design:
- Use hierarchical structures like MyCompany/Application/Component to keep metrics logically grouped.
- Separate custom metrics from AWS service metrics for better retention and dashboard management.
Naming Conventions:
- Use descriptive names (e.g., ResponseTimeMs, ErrorCount) so the metric meaning is clear.
- Include units where helpful (e.g., LatencyMs, RequestSizeKB).
3. Cost Optimization Techniques
Efficiency Strategies:
- Consolidate related data points into single metrics where possible.
- Use metric filters to extract values from logs instead of publishing separate custom metrics for each event.
- Set metric retention policies aligned with business needs—keep detailed data short-term and rely on aggregates for long-term.
4. Alerting and Visualization Setup
Threshold Configuration:
- Base thresholds on historical performance baselines.
- Use the right statistical function (e.g., Average for CPU, Maximum for latency spikes).
- Configure evaluation periods that balance noise reduction with timely detection.
Dashboard Design:
- Group metrics logically by service or business function.
- Use appropriate visualization types—line charts for trends, gauges for utilization, stacked bars for breakdowns.
- Include both technical and business KPIs for full visibility.

Streamline AWS Metrics and Dimensions with Applications Manager
Managing metrics and dimensions in AWS can get messy and expensive. CloudWatch is powerful, but without discipline, you’ll drown in high-cardinality data, complex configs, and rising costs.
That’s where ManageEngine Applications Manager steps in — making CloudWatch monitoring simpler, smarter, and cheaper .
Why choose Applications Manager?
1. Unified Application + Infrastructure Monitoring
AWS CloudWatch provides robust infrastructure monitoring for resources like EC2, RDS, Lambda, and S3, but it mostly offers raw data and basic dashboards. Applications Manager builds on this by unifying infrastructure metrics with application performance and end-user experience data, automatically correlating insights across layers. This helps IT teams quickly pinpoint whether an issue comes from code, resource exhaustion, or external dependencies — insights that would otherwise require extra configuration in CloudWatch.

2. Proactive Cost Management
While AWS offers billing alarms, Applications Manager goes further with detailed cost forecasting and detection of redundant metrics that inflate expenses. Instead of reacting after costs spike, teams can anticipate spending trends and optimize CloudWatch usage proactively, making budgeting more predictable.

3. Simplified Setup & Governance
CloudWatch Agent deployment can be complex, involving IAM roles, JSON configs, and manual roll outs. Applications Manager automates this process across Linux and Windows, ensuring seamless OS-level metric collection. Beyond setup, it enforces consistent naming conventions, dashboards, and alerting policies across environments — reducing silos and preventing misconfigurations.
4. Predictive Insights & Enterprise Templates
CloudWatch surfaces raw and historical data, but Applications Manager adds predictive analytics to forecast utilization, growth, and bottlenecks. Combined with pre-built monitoring templates for services like EC2, RDS, and Lambda, IT teams gain proactive intelligence and comprehensive coverage from day one — without the heavy lifting of manual setup.
Bottom line: AWS CloudWatch lays the foundation for monitoring, but Applications Manager elevates it with enterprise-grade intelligence, cost optimization, predictive insights, and business alignment. Together, they help IT teams shift from reactive monitoring to strategic, outcome-driven observability.
Elevate your Cloud environment today
Understanding AWS metrics and dimensions is key to effective cloud monitoring. But scaling them requires planning, consistency, and the right tools.
Success comes from balancing coverage with cost, keeping metrics consistent yet flexible, and tying technical data back to business value. Monitoring isn’t one-and-done—it’s an iterative process. Start with the essentials, expand as you gain insights, and refine as your needs grow.
That’s where ManageEngine Applications Manager helps. It removes the hassle of manual metric and dimension management with automated discovery, intelligent alerting, and business-driven insights—so you can focus on outcomes, not configuration.

