Bandwidth Management
See real-time bandwidth usage by user, application, and protocol, get alerted when traffic breaks its ML-predicted limits, and forecast capacity needs with NetFlow Analyzer.
- One console for wired, wireless, cloud, and hybrid network traffic
- Early warning when usage drifts from normal or a spike conceals an attack
- Bandwidth prioritisation for business-critical apps, with forecasts that guide upgrades

What is bandwidth management in NetFlow Analyzer?
NetFlow Analyzer turns flow records into live utilization data broken down by source, destination, port, protocol, and application. It supports NetFlow, sFlow, J-Flow, IPFIX, NetStream, and AppFlow, so it works in any environment where devices export a supported format, from routers, switches, and firewalls to wireless LAN controllers and AWS VPC flow logs. Problems are identified sooner, for faster root cause analysis.
How NetFlow Analyzer's bandwidth management works
Traffic snapshot
Arrange the dashboard around the bandwidth metrics your team relies on, switch to the NOC view to display top utilization graphs over the intervals you choose. Top talker data helps identify heaviest consumers on the network.
- NOC dashboard of top utilization trends across chosen intervals
- Heaviest users and applications pinpointed to shape policy decisions
- Access policies rest on evidence rather than assumptions

Traffic pattern analysis
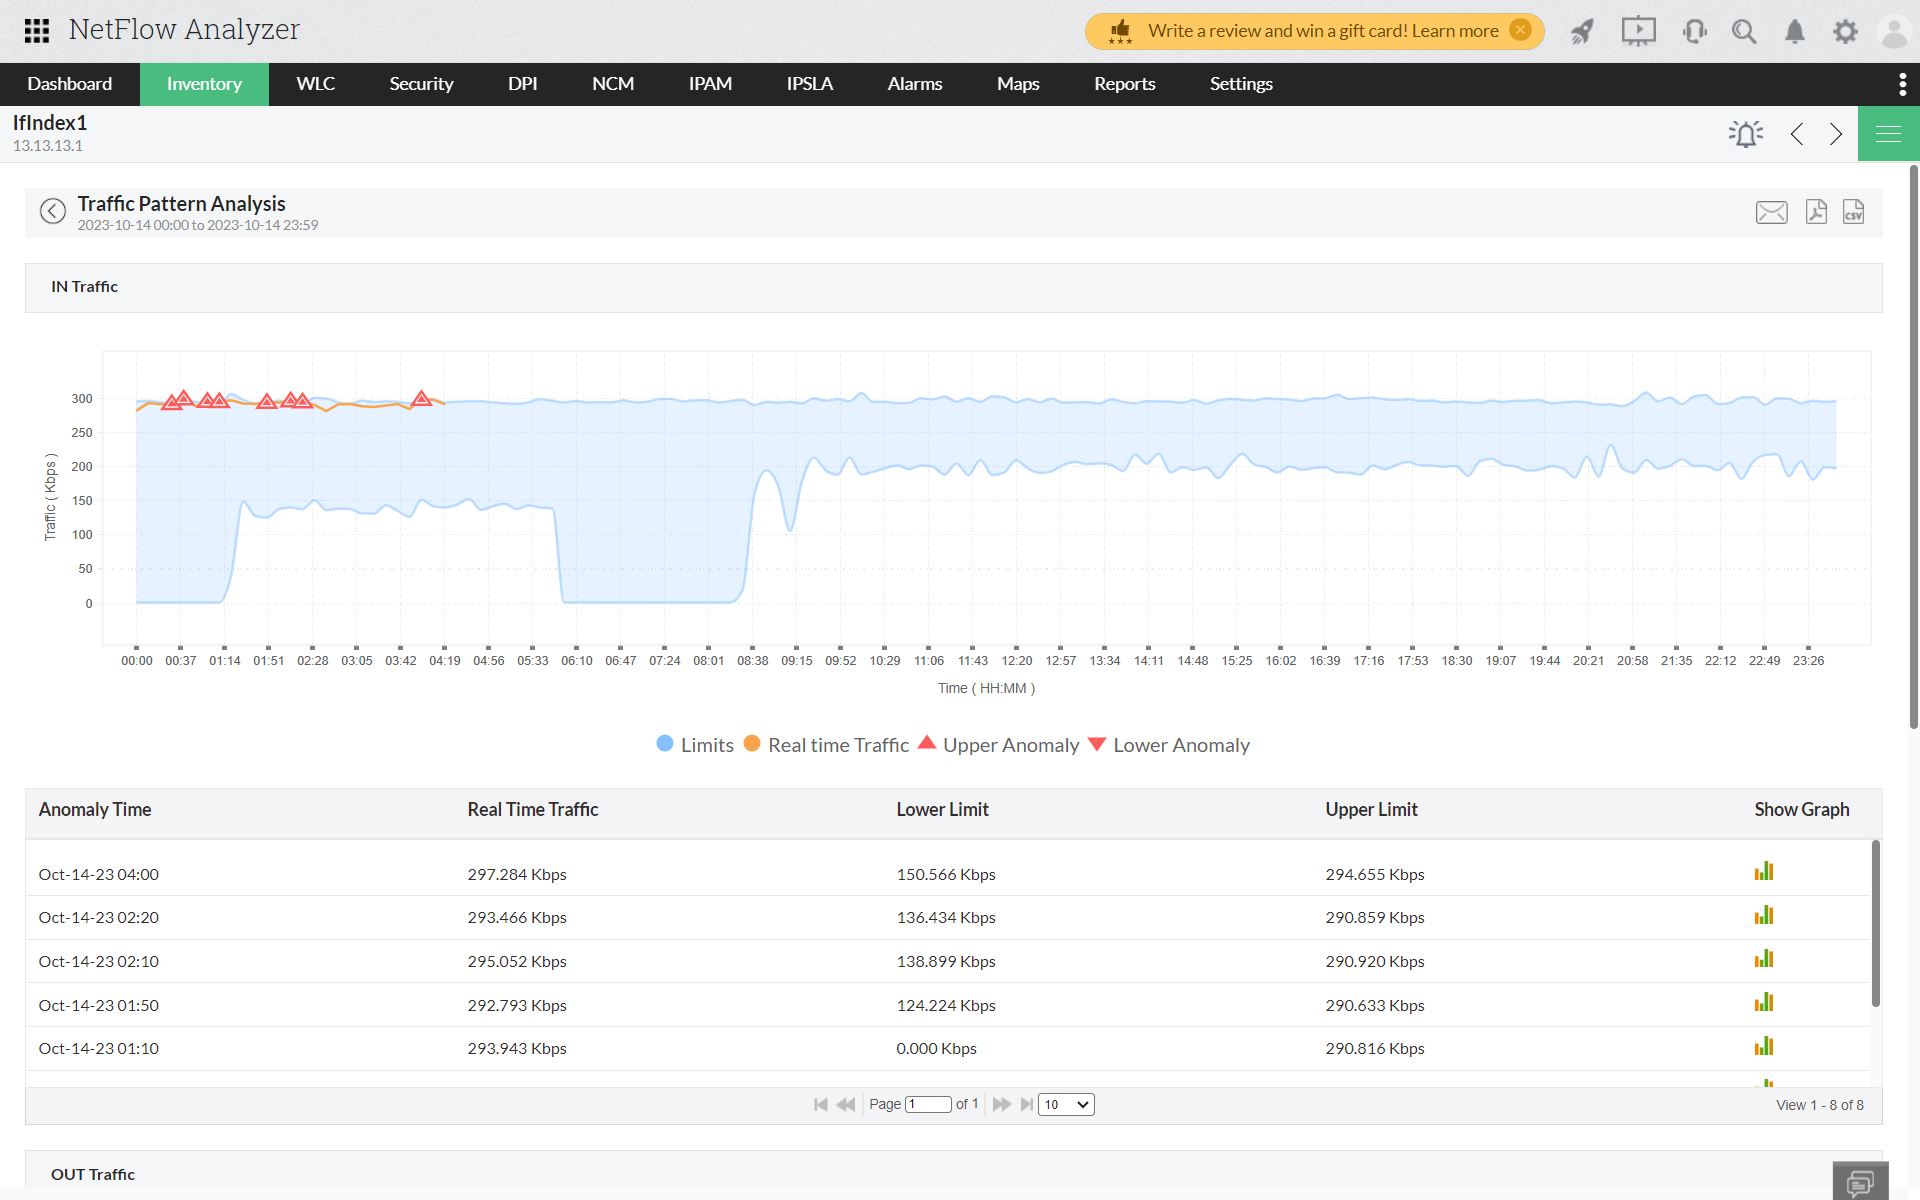
Traffic Pattern Analysis applies machine learning to your bandwidth data, calculates expected upper and lower bounds, and compares live usage against them. You choose how much variance to tolerate, and anything beyond it raises an alert.
- Baselines that keep pace as usage behavior changes
- Expected upper and lower bounds calculated by machine learning
- Get alerted only when variance crosses the limit you define
Threat detection
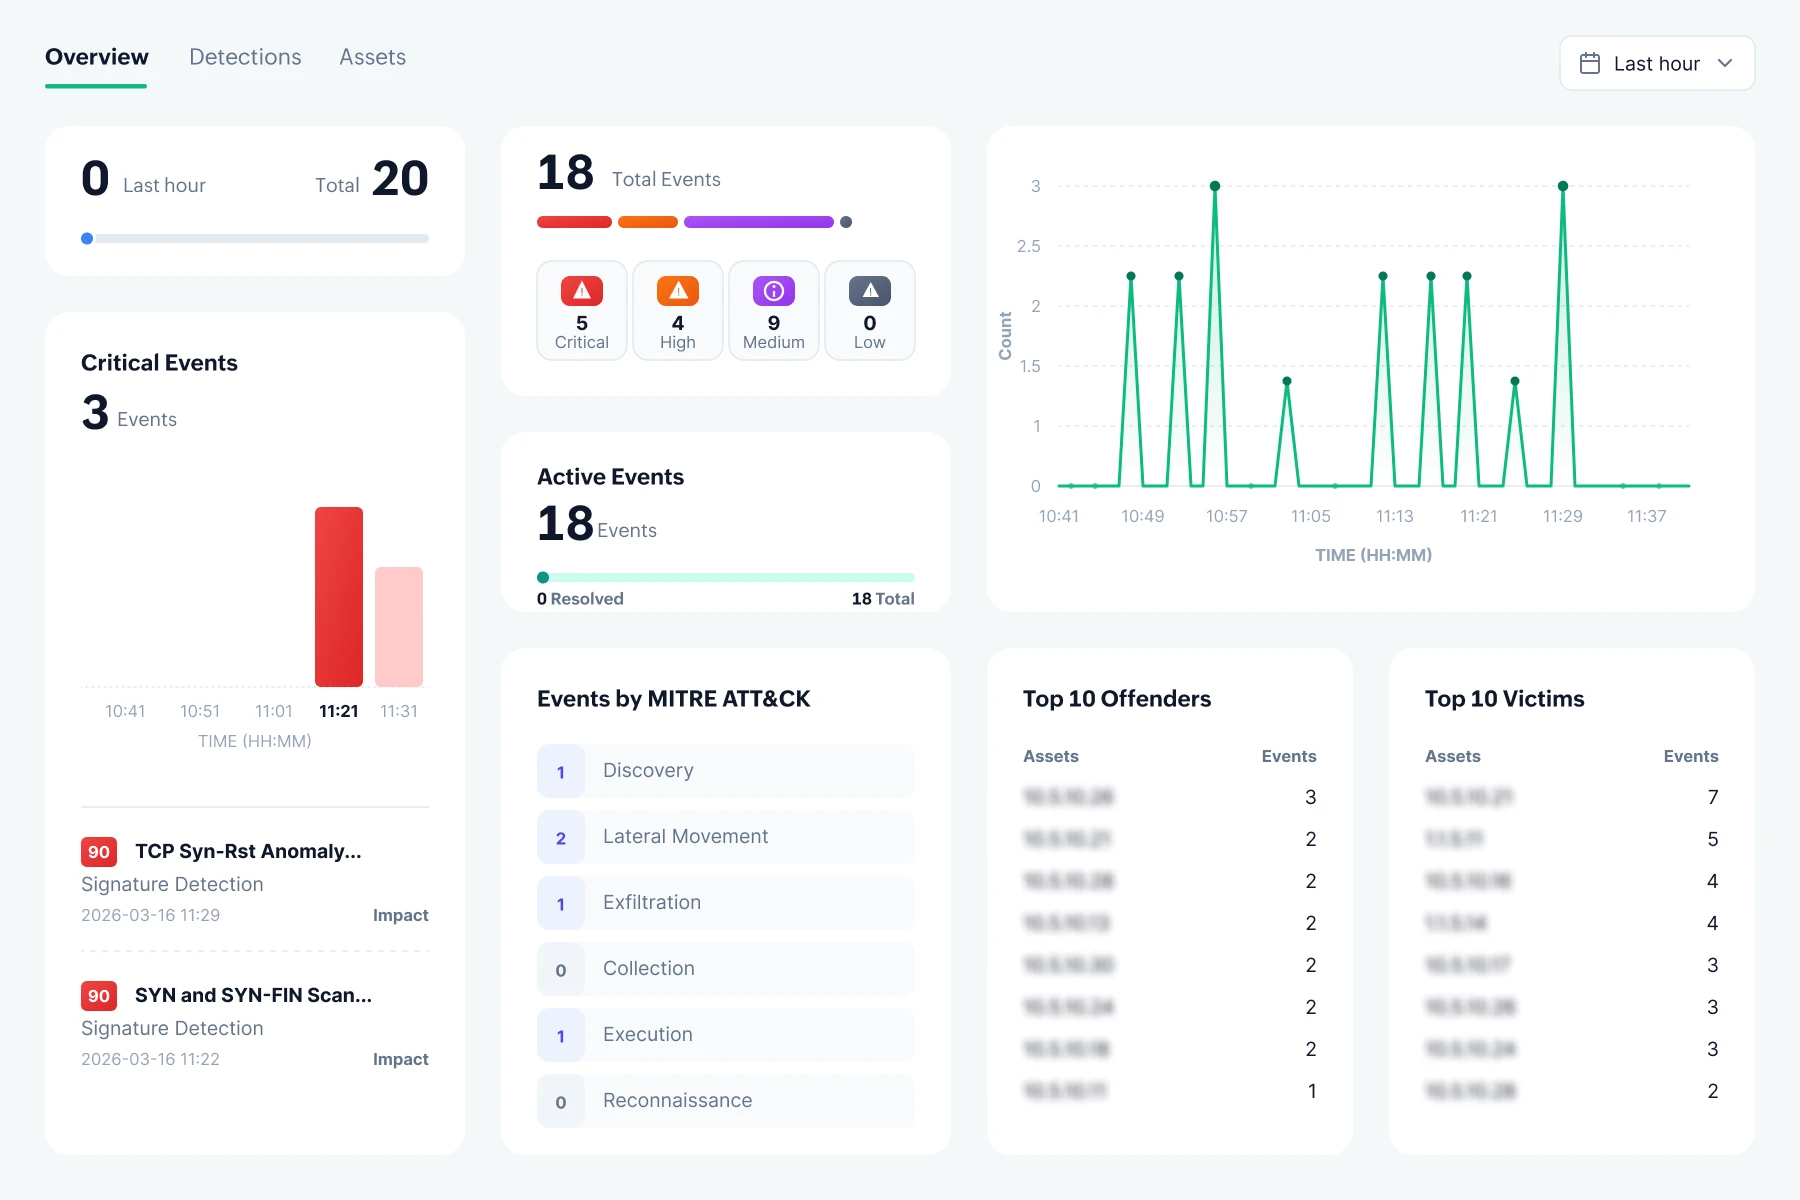
Heavy traffic and hostile traffic can look identical, Security Analytics separates them using built-in detection rules. Each event arrives with the context an investigation needs, so you can judge how far an attack has spread, including zero-day intrusions.
- Victim IP addresses and offending hosts listed per event
- Severity scored on observed behavior
- Custom detection logic alongside built-in algorithms
Traffic shaping
Create and update QoS policies on your devices, reserving bandwidth for critical traffic classes and shaping lower-priority traffic. CBQoS reports then show drops and queuing for each class, so you can confirm the policy works as intended.
- Shaping at the application, interface, or router level with Network Configuration Manager add-on
- QoS policies created and updated from one console
- Verify results with per-class drops and queue depth

Traffic trend reporting
Usage reports track consumption against data caps and project future demand, and the same data can be examined to investigate a congestion event, explain an outage, or justify additional capacity.
- Search, Consolidated, Comparison, and Forensic views
- Capacity planning and Forecast reports for the months ahead
- Raw flow data for detailed forensic work

Frequently Asked Questions
Find answers to common questions about our platform and services.