Chapter 3: Leveraging logs for better IT performance
Troubleshooting issues in the IT environment
We troubleshoot the issue in our IT environment by two modes:
- Active troubleshooting
- Passive troubleshooting
Active troubleshooting
Active troubleshooting is when developers troubleshoot after the issue is reported to them. Log files come in handy to troubleshoot issues such as application crashes, configuration issues, hardware failures, etc.
Use case:
Our team planned to implement a new feature in our service management application and decided to beta test it with a specific group of users. Following the rollout of the new feature, our beta users reported an issue with the existing ticket tracking feature within the application.
The new update had introduced a set of parameters that conflicted with the existing feature. Whenever a user tried to add a comment to an existing ticket, the system would throw an error and prevent the comment from being added. This caused a great deal of frustration among users, who relied heavily on the ticket tracking feature to keep track of their IT issues.
The development team began investigating the issue using a variety of tools. They analyzed the application's logs to find errors or warning messages related to the problem. This led them to a particular function in the code that had been modified during the update.
After more analysis and testing, the team found that the function was misconfigured and interfering with the ticket tracking feature. They promptly adjusted the code and released a new version of the application that resolved the issue.
By using troubleshooting techniques and log analysis, the development team identified and resolved the conflict between the new update and existing feature promptly. Their rapid response minimized the impact on users and ensured smooth application performance.
Passive troubleshooting
We are always on the lookout to ensure that our applications are performing optimally. While the applications may seem fine on the surface, we know that deeper analysis is often necessary to uncover potential threats that may cause trouble in the long run. To achieve this, we monitor our logs closely and run queries to investigate application performance.
For instance, our service management application may be running smoothly, but a sudden increase in garbage collection (GC) could go unnoticed and cause issues down the line. We can quickly identify and resolve such issues before they affect the user experience by
monitoring GC logs.
We also pay close attention to seemingly minor issues that could impact performance or security, such as when a URL like "/download" is saved permanently instead of temporarily. These issues may seem trivial, but they can have a big impact on the overall application performance.
At ManageEngine, we use log analysis to proactively troubleshoot issues before they become major problems. Our alerts module helps us enhance this process by allowing users to create alerts that trigger a query every 15 minutes, and provide email alerts when certain criteria are met. With this system in place, our users can quickly identify and resolve issues, without needing to generate queries regularly.
Improving the performance of applications
Evaluating ManageEngine's overall performance
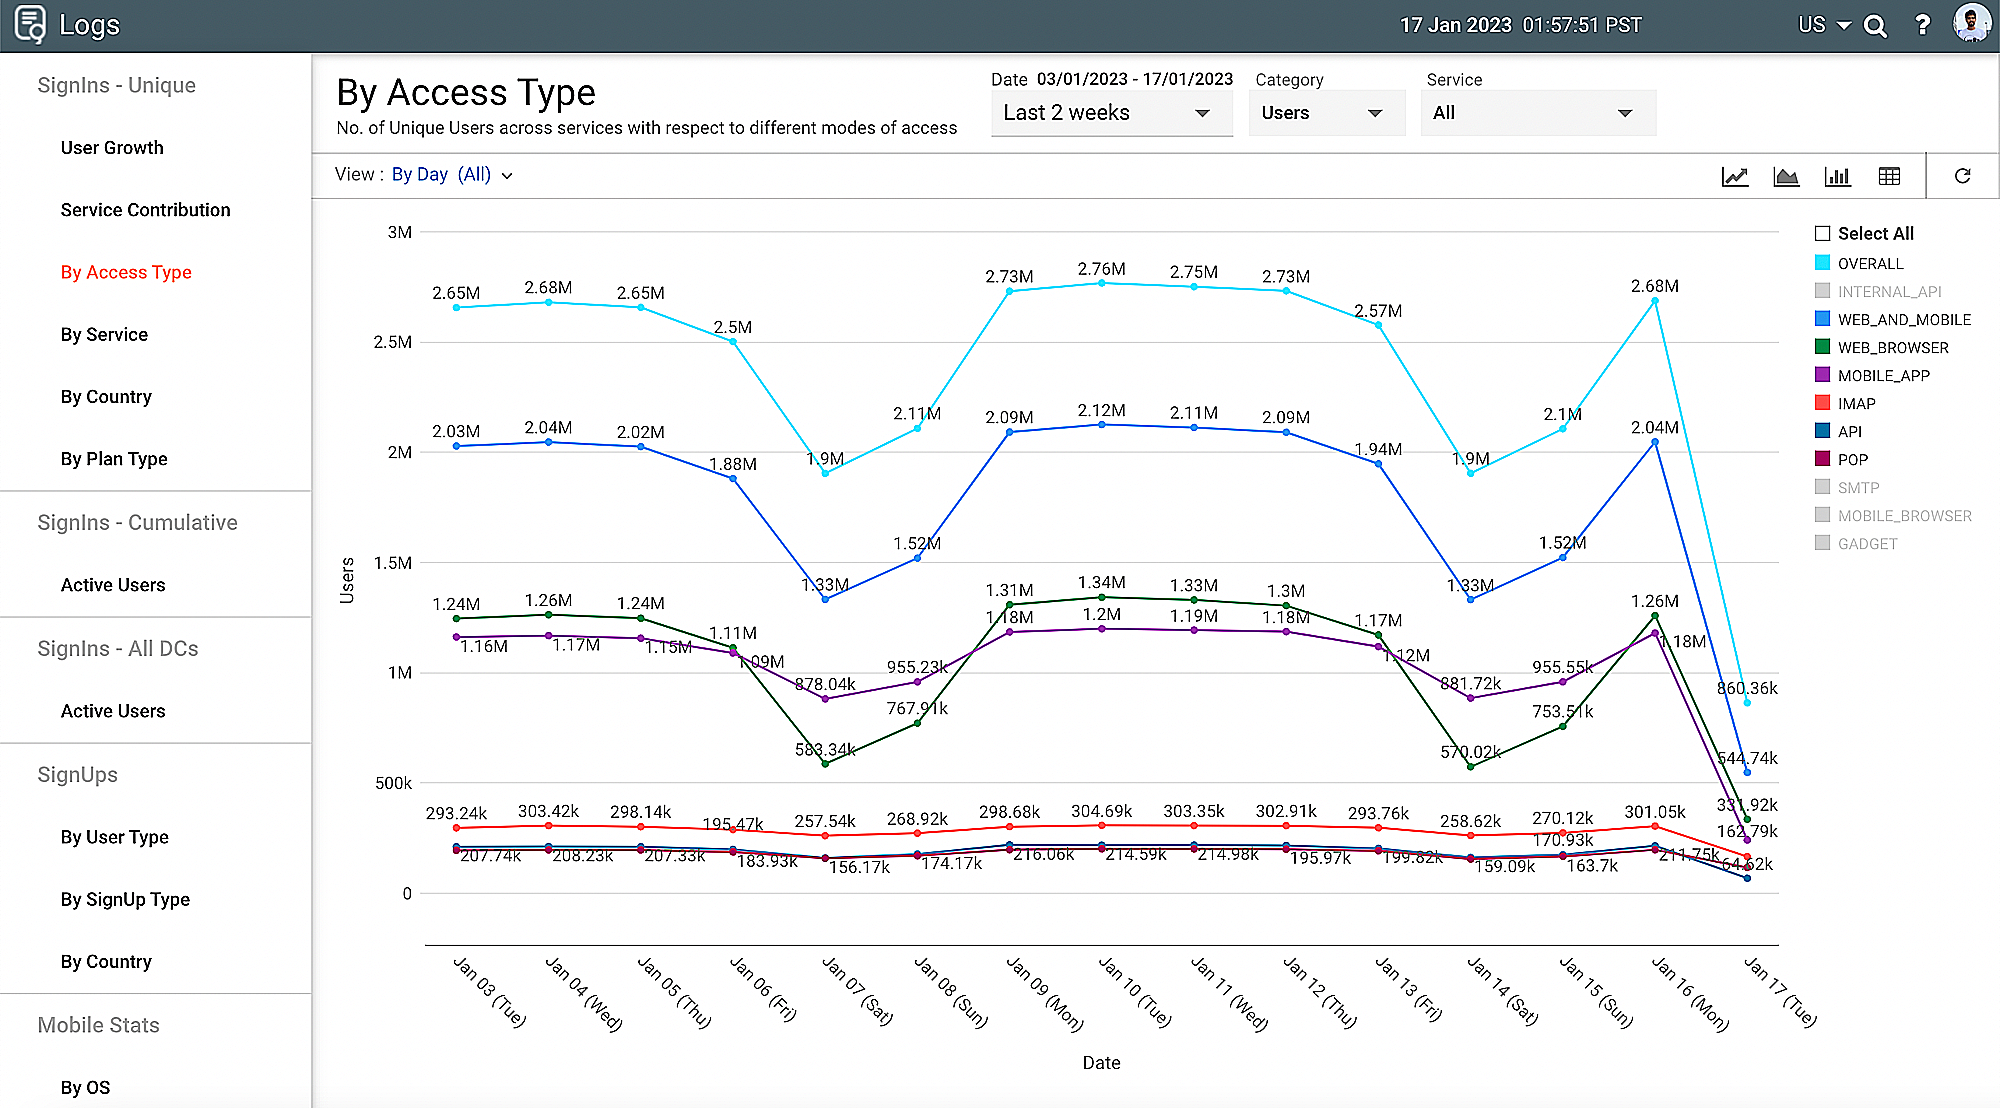
As part of our log management strategy at ManageEngine, we use access logs to retrieve the User ID and the Log ID. Using these parameters, we've built statistical analysis dashboards that provide us with important information on how many users and organizations access our services on a daily basis across the world.

Figure 8: Using logs to analyze performance
Here are some of the key categories that we can analyze as shown in
Figure 8:
User type:
We can see how many web users, mobile users, API users, and other types of users accessed our services on a particular day.
Applications used:
We can see how many users accessed each of our applications, such as our service management application, log management application, and more.
Users or Orgs:
We can also categorize how many individual users or organizations access our services.
Geography:
We can filter out users by country or data center where they are accessing the services from.
Plan:
We can see how many free users or paid users are accessing our services.
Sign-ins and Sign-ups:
We can see how many users are signing in and signing up for our services on a daily basis.
Mobile OS:
For mobile users, we can further categorize by operating system.
We can filter out custom time periods for any of the categories above, giving us granular insights into usage trends over specific time frames. We can also see the growth of our services over quarters and drill down to see which service users signed up through in a particular region.
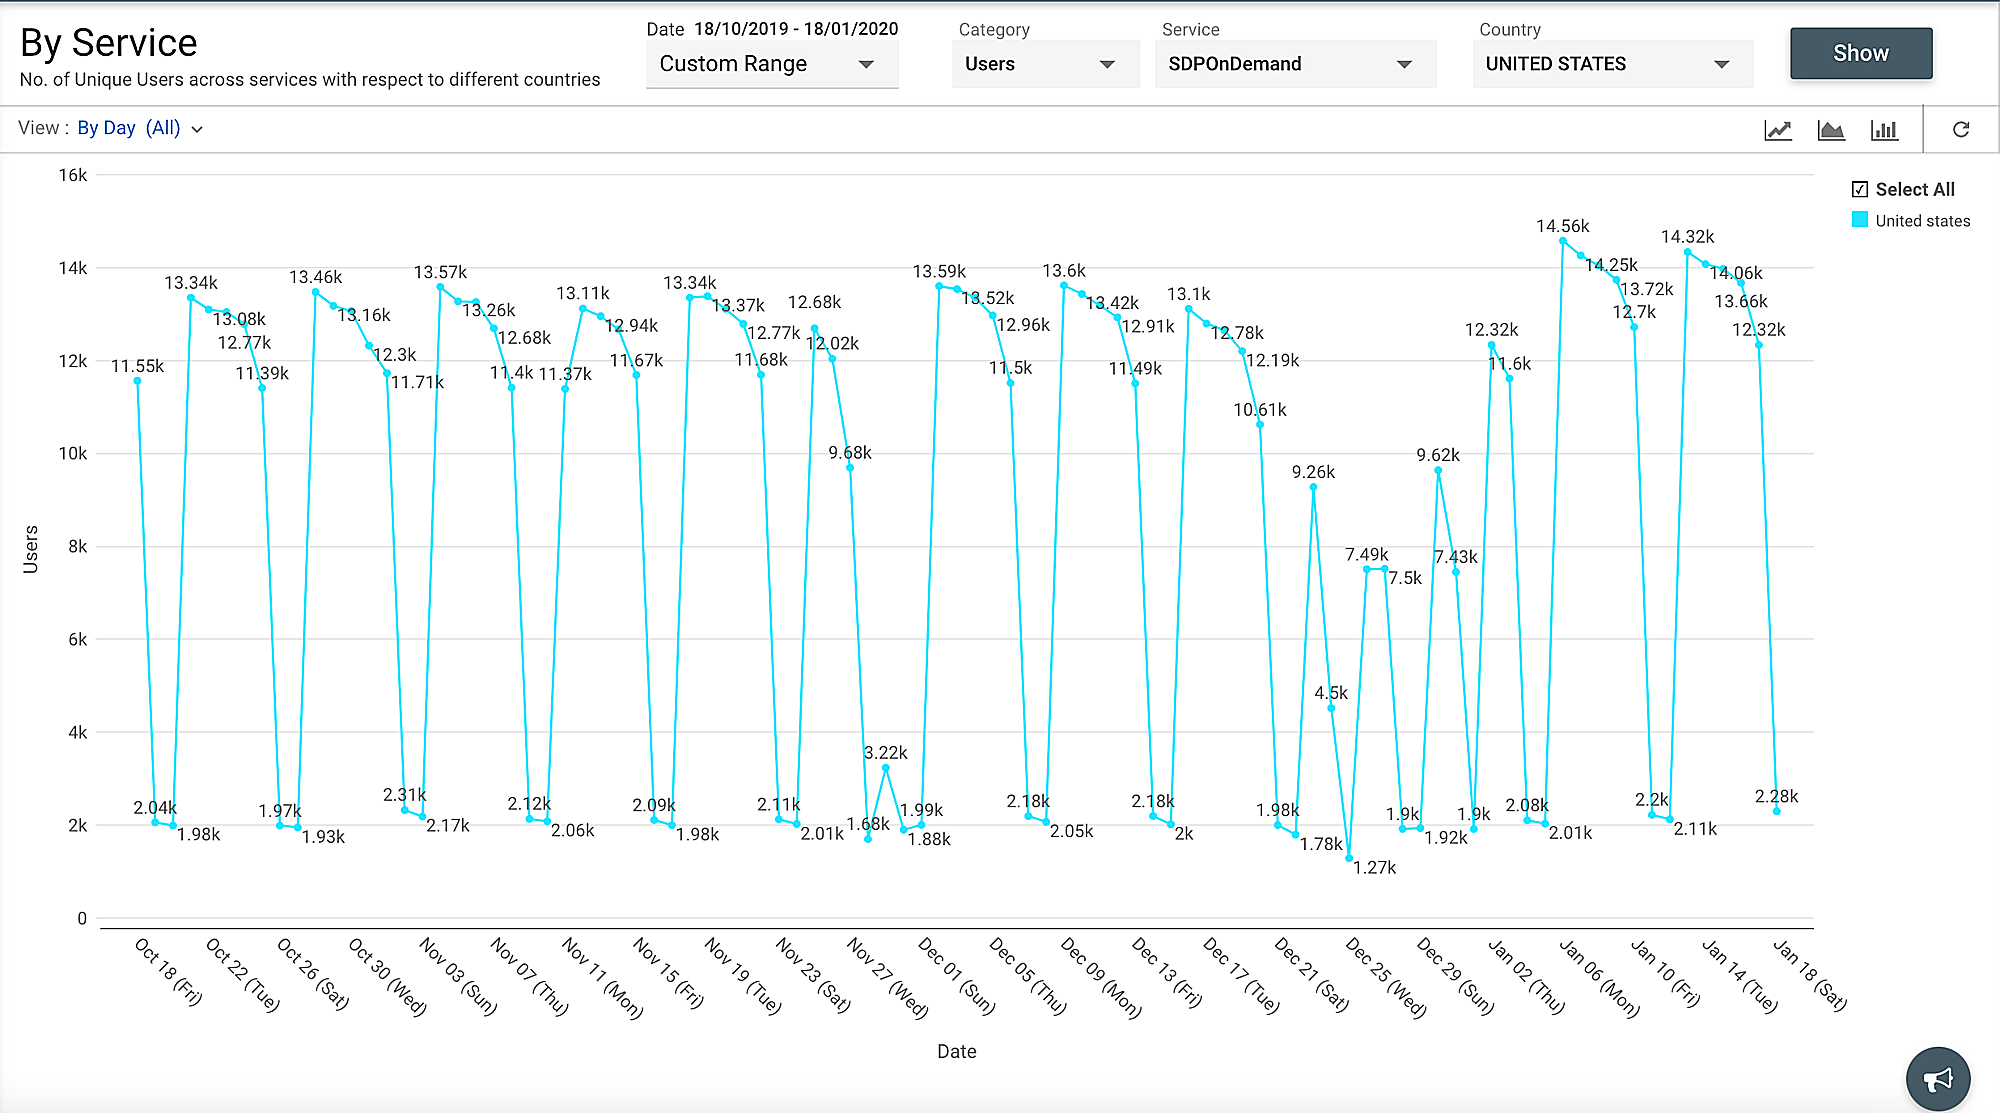
All such data is captured by our logs whenever anyone uses one of our services across the world. We conduct periodic evaluations to analyze trends, patterns, and changes in usage of our services using data from access logs. For example, Figure 9 below shows how many users have accessed our service management application on demand during a specific quarter, allowing teams to analyze trends and make data-driven decisions.

Figure 9: Growth analysis of SDP on demand using log data
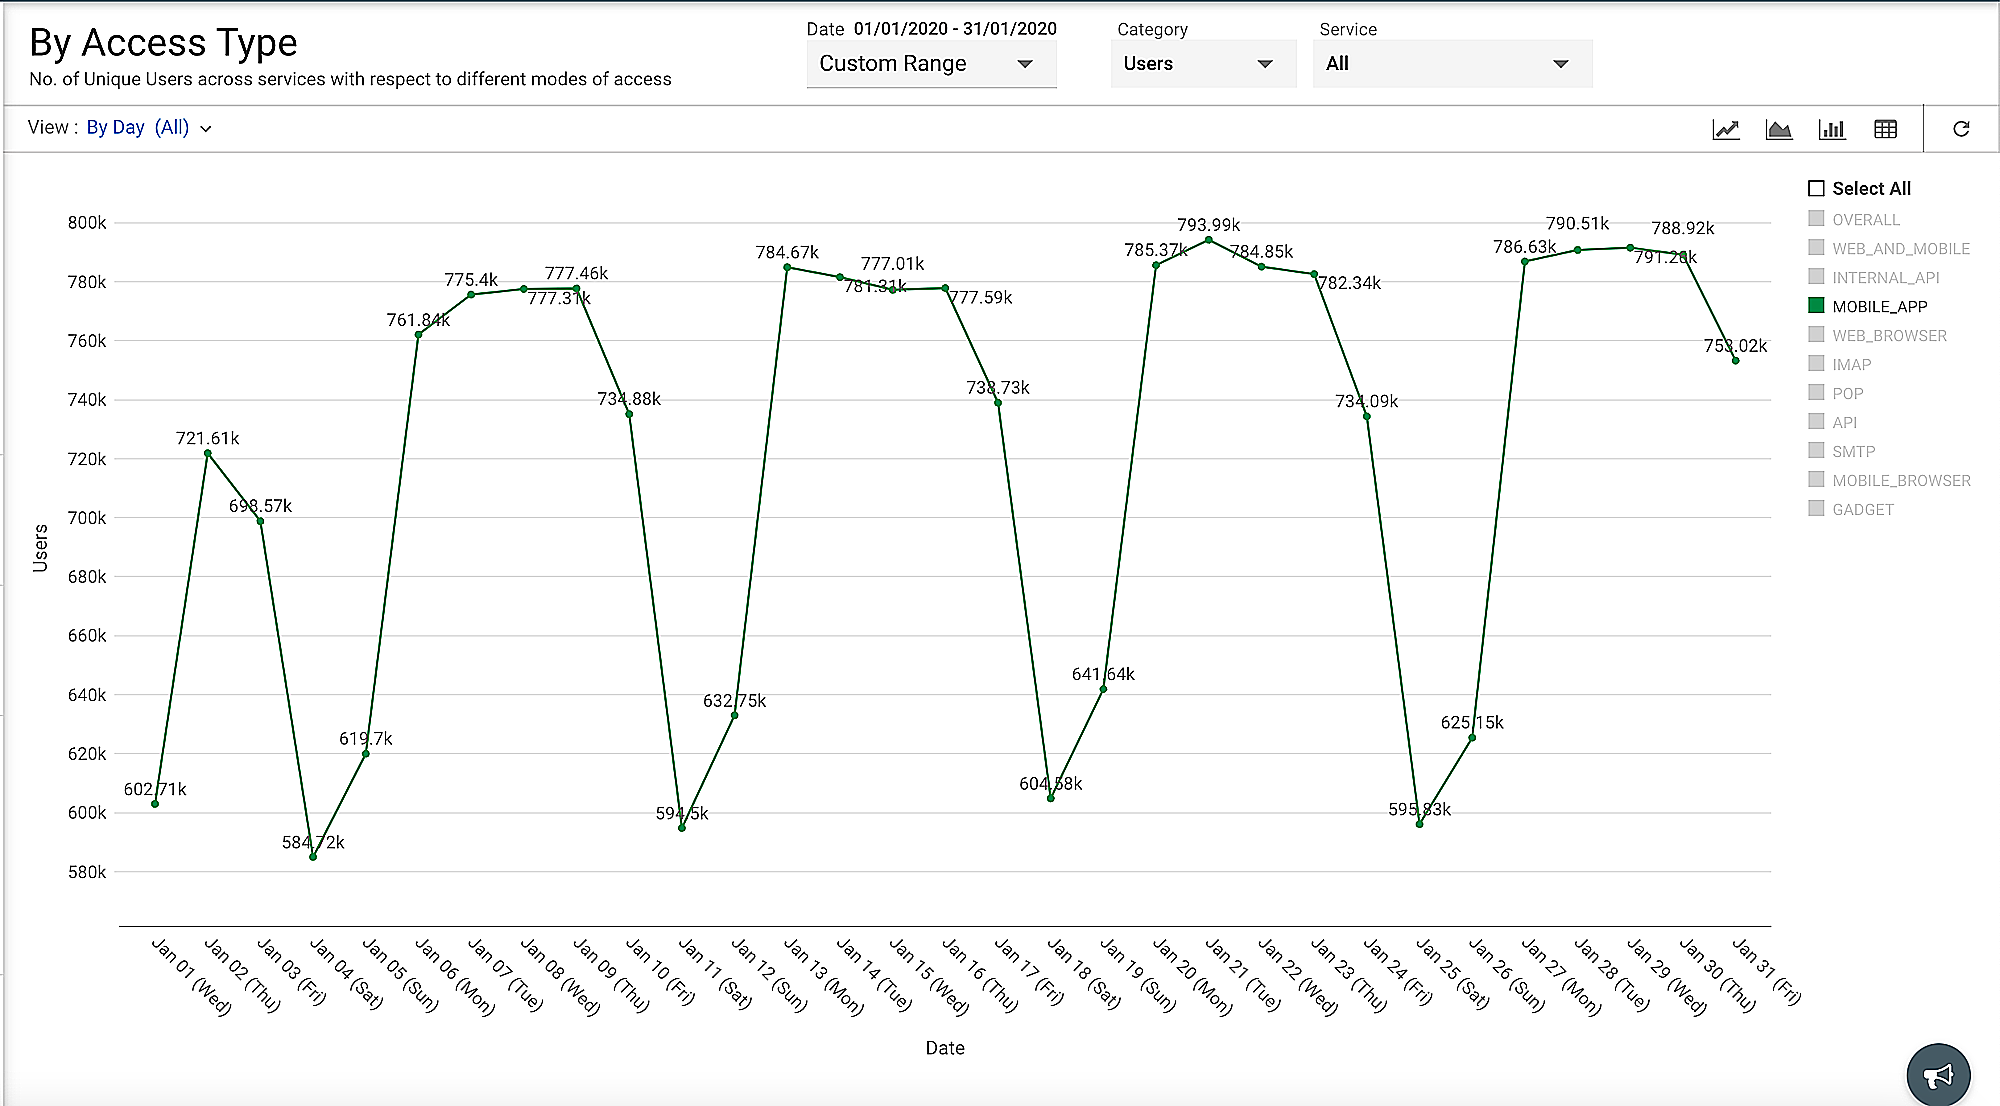
Product managers also use these stats to analyze and improve our products. For instance, they can analyze mobile app usage (shown in Figure 10) for a service by filtering out Android and iOS usage. If our product managers find that iOS users are decreasing steadily over a period, they might rework certain features to improve usage.

Figure 10: Analysis of mobile app usage using log data
In short, access logs provide us with valuable insights into how our services are being used around the world, helping us to make informed decisions about our products and improve our ITOps.
Optimizing application performance
Developers use log data to analyze the performance of applications. For instance, the report used in Figure 4 earlier tells us how many Status 200 log messages were recorded, which means that the application returned a successful response to the client's request. Each of the entries in the logs provides details about the Status 200 messages logged. Alternatively, Status 401 messages tell us how many requests were unauthorized. Developers dig deeper into each category and analyze why those messages were thrown.
Use case
ManageEngine uses log analysis to optimize the performance of its applications in a cloud-native environment consisting of multiple micro services. During one instance, the team noticed an increasing error rate in the authentication service responsible for handling authentication requests.
The team deep-dived into the logs and metrics to identify the source of the errors using log analysis. The analysis revealed that the authentication service was receiving more traffic than it was designed to handle. The team suspected that the authentication service was not optimized to handle the current load.
Further analysis uncovered a bug in another microservice that was causing it to send multiple requests to the authentication service for every transaction. This bug caused the authentication service to work harder than it should have, making it struggle to keep up with the incoming traffic.
To optimize the performance of the authentication service, the team added an auto-scaling feature that would increase the number of instances of the authentication service when the traffic increased beyond a certain threshold. They also improved the authentication service by implementing an asynchronous method to handle the requests, which helped to reduce the load on the service and allowed it to handle more traffic.
With the improvements made, the error rate for the microservice decreased, and the performance improved. The team continued to monitor the logs and metrics to ensure that the service remained optimized and performed efficiently. Through log analysis and troubleshooting, the team was able to identify and resolve the issue, which shows the importance of these practices in optimizing application performance.
Using logs, ManageEngine can evaluate and improve application performance in the following areas:
- Detecting bottlenecks
- Optimizing processes
- Performing load balancing
- Discovering hard-to-find bugs
Spotting security threats
Our IT security team is the first line of defense when it comes to safeguarding our digital assets. They constantly monitor our network and systems for potential security threats and take preventive action before they can cause any harm. In their quest to provide top-notch security, they use log analysis to gain visibility into the network and systems.
Through log analysis, the IT security team is able to spot potential security threats such as unauthorized access attempts, suspicious activity, and malware infections.
Use case
Our IT security team noticed a spike in traffic to a specific server that hosted a critical application. They discovered several failed login attempts with different usernames and passwords upon further analysis of the server's log data. This raised a red flag as there was no legitimate reason for multiple failed login attempts within such a short span of time.
Immediately, the security team initiated an investigation into the source of the login attempts. They were able to trace the origin IP addresses using log data. They found that the source IP addresses were from a known botnet network that was notorious for launching DDoS attacks and spreading malware.
This was a serious threat to the organization's digital assets, and the IT security team quickly took preventive action by blocking the IP addresses, which prevented the botnet from accessing the organization's network and systems. They also conducted a thorough audit of the server and found that it had been vulnerable to a specific type of exploit that the botnet had used to gain unauthorized access.
ManageEngine's IT security team was able to prevent a potential cyber attack and protect the organization's digital assets by using log analysis to spot the security threat. This is just one example of how log analysis has helped the IT security team at ManageEngine to provide top-notch security and protect the organization from cyber threats.