Chapter 2:
A complete breakdown of our log management framework
ManageEngine offers more than 50 applications to more than 80 million users worldwide. This generates a massive amount of log data that needs to be managed. We started our journey towards a semi-automated log management system in 2012 by bringing in major improvements in log collection and storage as follows:
Zoho Logs Server

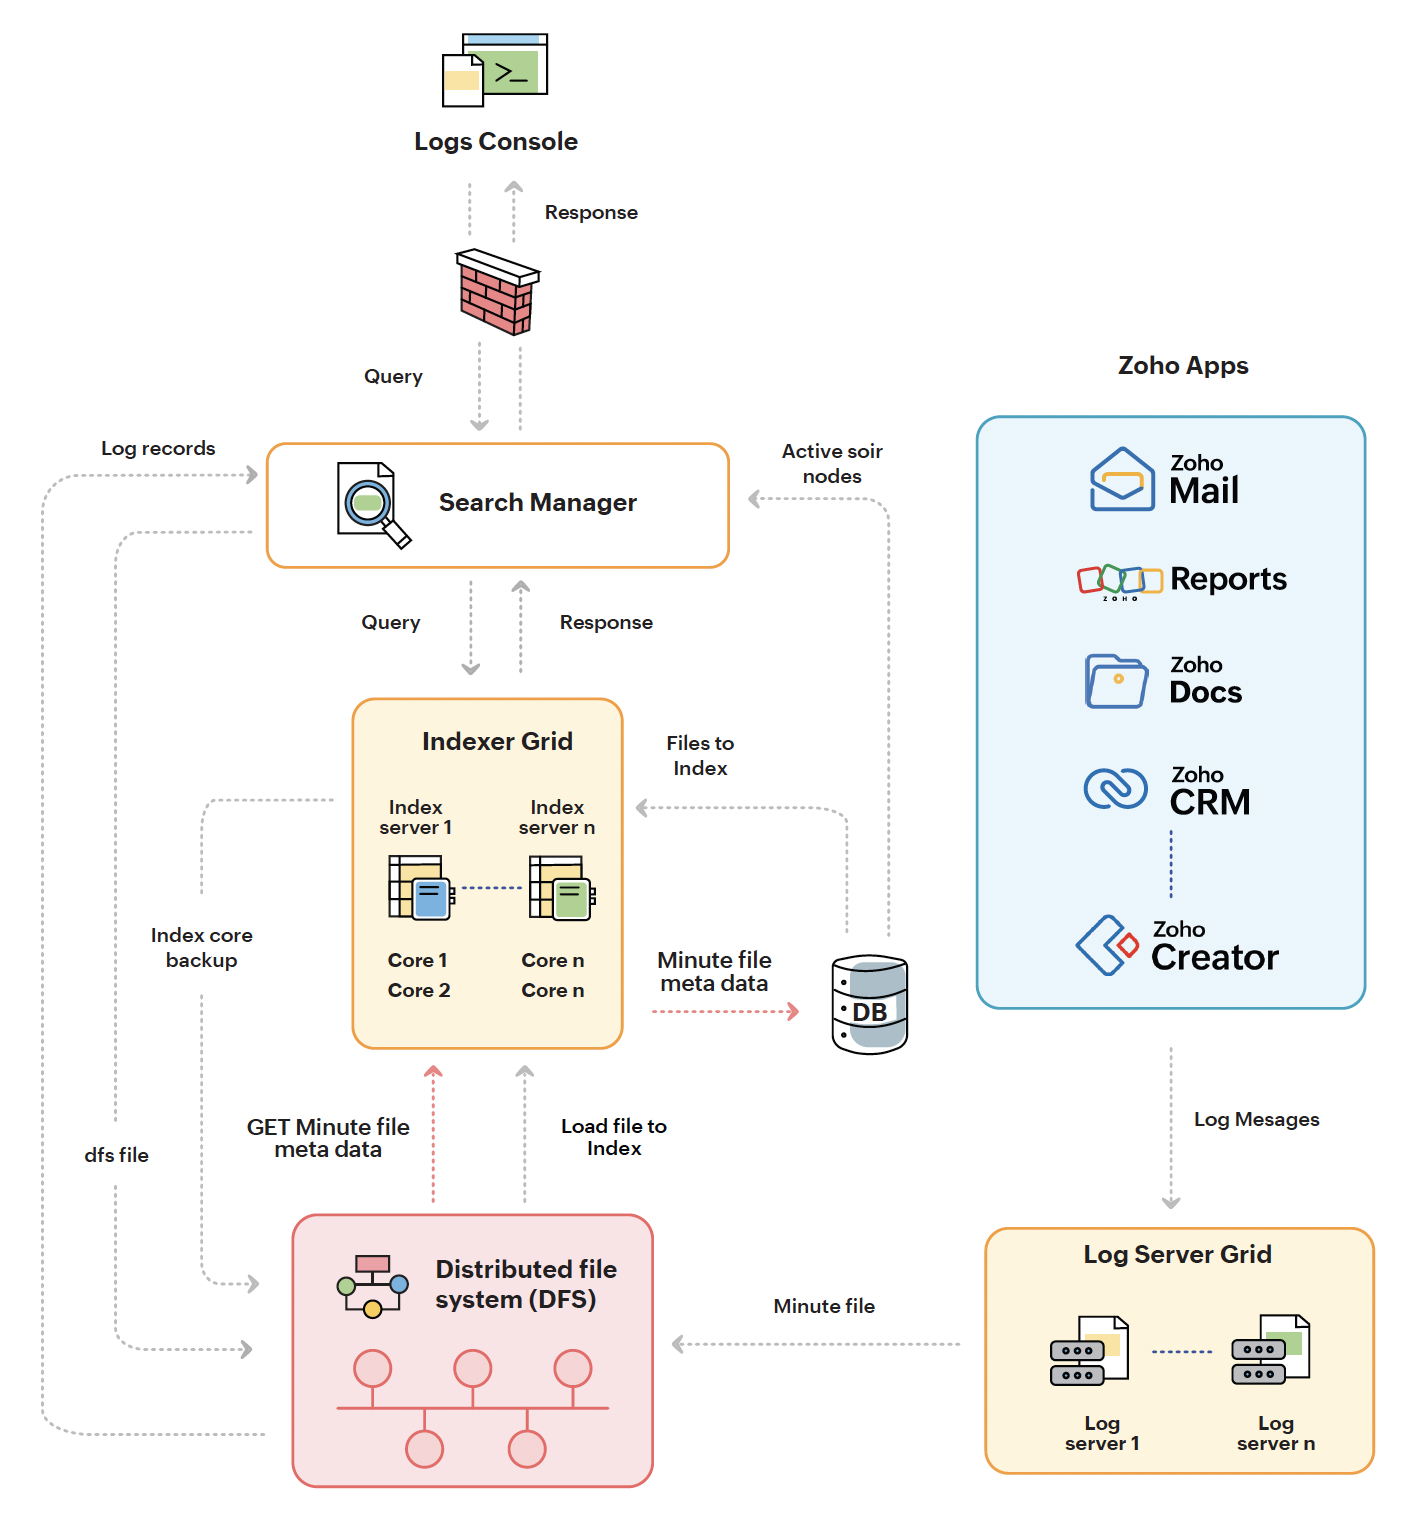
Figure 4: Log management at ManageEngine
Systematic collection of logs
We introduced systematic collection of logs by enhancing three aspects: indexing, searching, and queue management.
Indexing:
We deployed a powerful search server to improve the speed of retrieving log files. This enabled efficient running of a range of queries, making it ideal for indexing log files.
Searching:
We further introduced a distributed document-oriented search engine to enhance the speed of queries. The advanced search engine, with its distributed architecture and familiar JSON formatting, quickly became a vital component of our log management system. We can now perform quick searches using distributed inverted indices, making it easy to search through large amounts of log data.
Queue management:
We added a streaming data platform to handle the queue of log queries more efficiently. This platform helps our log management system run smoothly, even with a high volume of queries, due to its high scalability and speed.
Enhanced storage with distributed file system (DFS)
We brought in DFS for storing log files, which was a major boost to our log management framework. DFS enabled us handle large amounts of log data with high compression and high-throughput data access.
The systematic collection and enhanced storage work together to provide seamless processing of logs as follows:
- The log server grid is the primary log collector. Developers write logs to a lightweight TCP, which writes the logs as files into DFS.
- The database server contains metadata about the users and verifies their permission to access the logs.
- The app servers continuously populate DFS with log files. Schedulers retrieve the logs periodically from the app servers and store them in DFS, supported by the streaming data platform for effective queue management.
- The indexing of log files in DFS is automated by schedulers, while log file retrieval occurs only when a user raises a query in the console. These processes run as jobs periodically to provide a smooth user experience.
- When a user raises a query, the indexing grid searches for the relevant file in DFS. If the file is available, the console returns it to the user. If not, the console informs the user that the file cannot be found.
We chose this system for several reasons:
- It ensures log integrity by making it impossible to tamper with the logs. Any attempt to compromise the logs will render them corrupt and useless.
- The centralized log system frees up memory on the app server, improving overall application performance. DFS also enhances log security with its efficient 80% compression.
- The system simplifies audits and makes it easier to track user activity, which is stored in the database. This information is vital for investigations and helps improve the security of the logs.
- With a centralized, agent-based log system, troubleshooting becomes easier. Logs can be used to identify areas of an application that can be improved, such as wasted processes, underutilized space, etc.
Our log management system has come a long way since its inception in 2012. With the seamless integration of DFS, powerful search servers, advanced search engines, and improved queue management, we've created a semi-automated log management system that is both secure and efficient.
Parsing: Transforming log data into structured insights
At ManageEngine, we understand the importance of log data in improving the performance and security of our applications. Naturally, we have a comprehensive parsing system to transform log data into a structured format that is easy for developers to use.

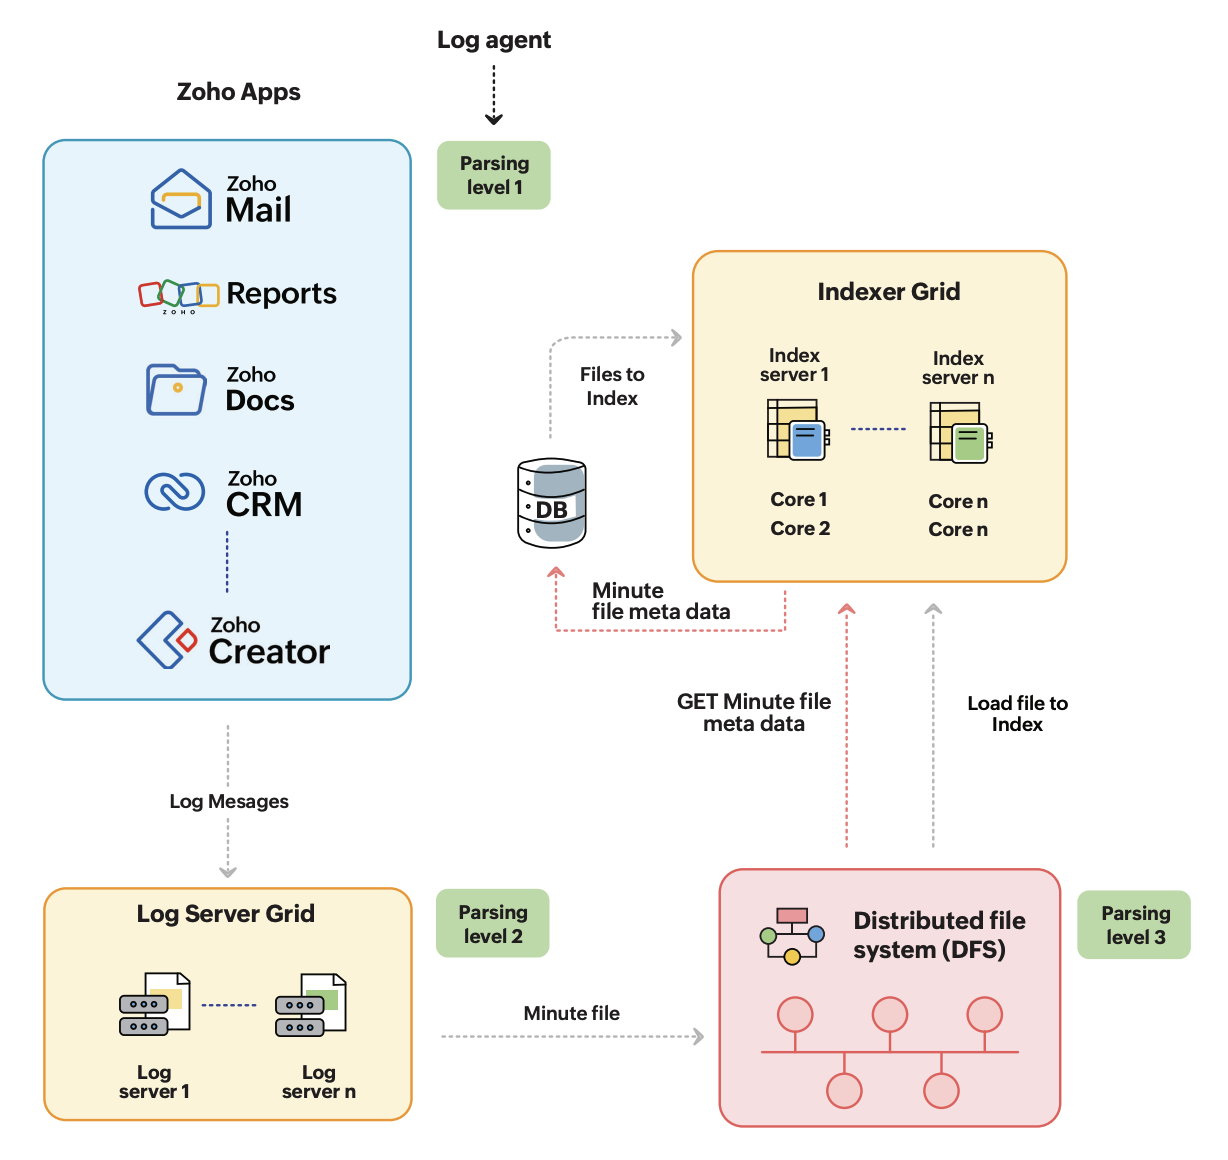
Figure 5: Different levels in parsing log data
As shown in Figure 5, our parsing system consists of three levels:
Level 1: In-agent processing
Our logs team employs log agents, which are pieces of code integrated into the developers' environment, to process logs at the first level. The log agents perform the initial parsing, ensuring that logs are formulated in a way that meets the requirements of both our developers and IT environment.
Level 2: File conversion
The next stage is the conversion of logs from JavaScript to JavaScript Object Notation (JSON) format, making it easier for developers to use. The logs are converted into JSON files and reach the log server grid, as shown
in Figure 3.
Level 3: Adding relevant information
We append additional information to the JSON files to enhance the usefulness of the logs for analysis and reference. This information includes the service the log file belongs to, the type of logs contained in the file, and more. We also append three to five additional fields for further analysis, to provide a more complete picture of the logs. When developers view the log files in the console, these additional fields are displayed as field values.
We continuously update our logs by parsing new data every minute, resulting in a constantly evolving, informative repository of log data. This efficient and effective parsing system, coupled with our log collection and storage system, allows us to make informed decisions based on real-time log data, ultimately leading to improved performance and security of our applications.
Analyzing logs to improve IT environments
Once the log data passes the log-server grid, we store it as JSON in the DFS. The data in DFS is also indexed. This helps us apply algorithms to analyze the logs and generate useful insights about our IT environment as well as our business in general.
Default analysis
a) According to status
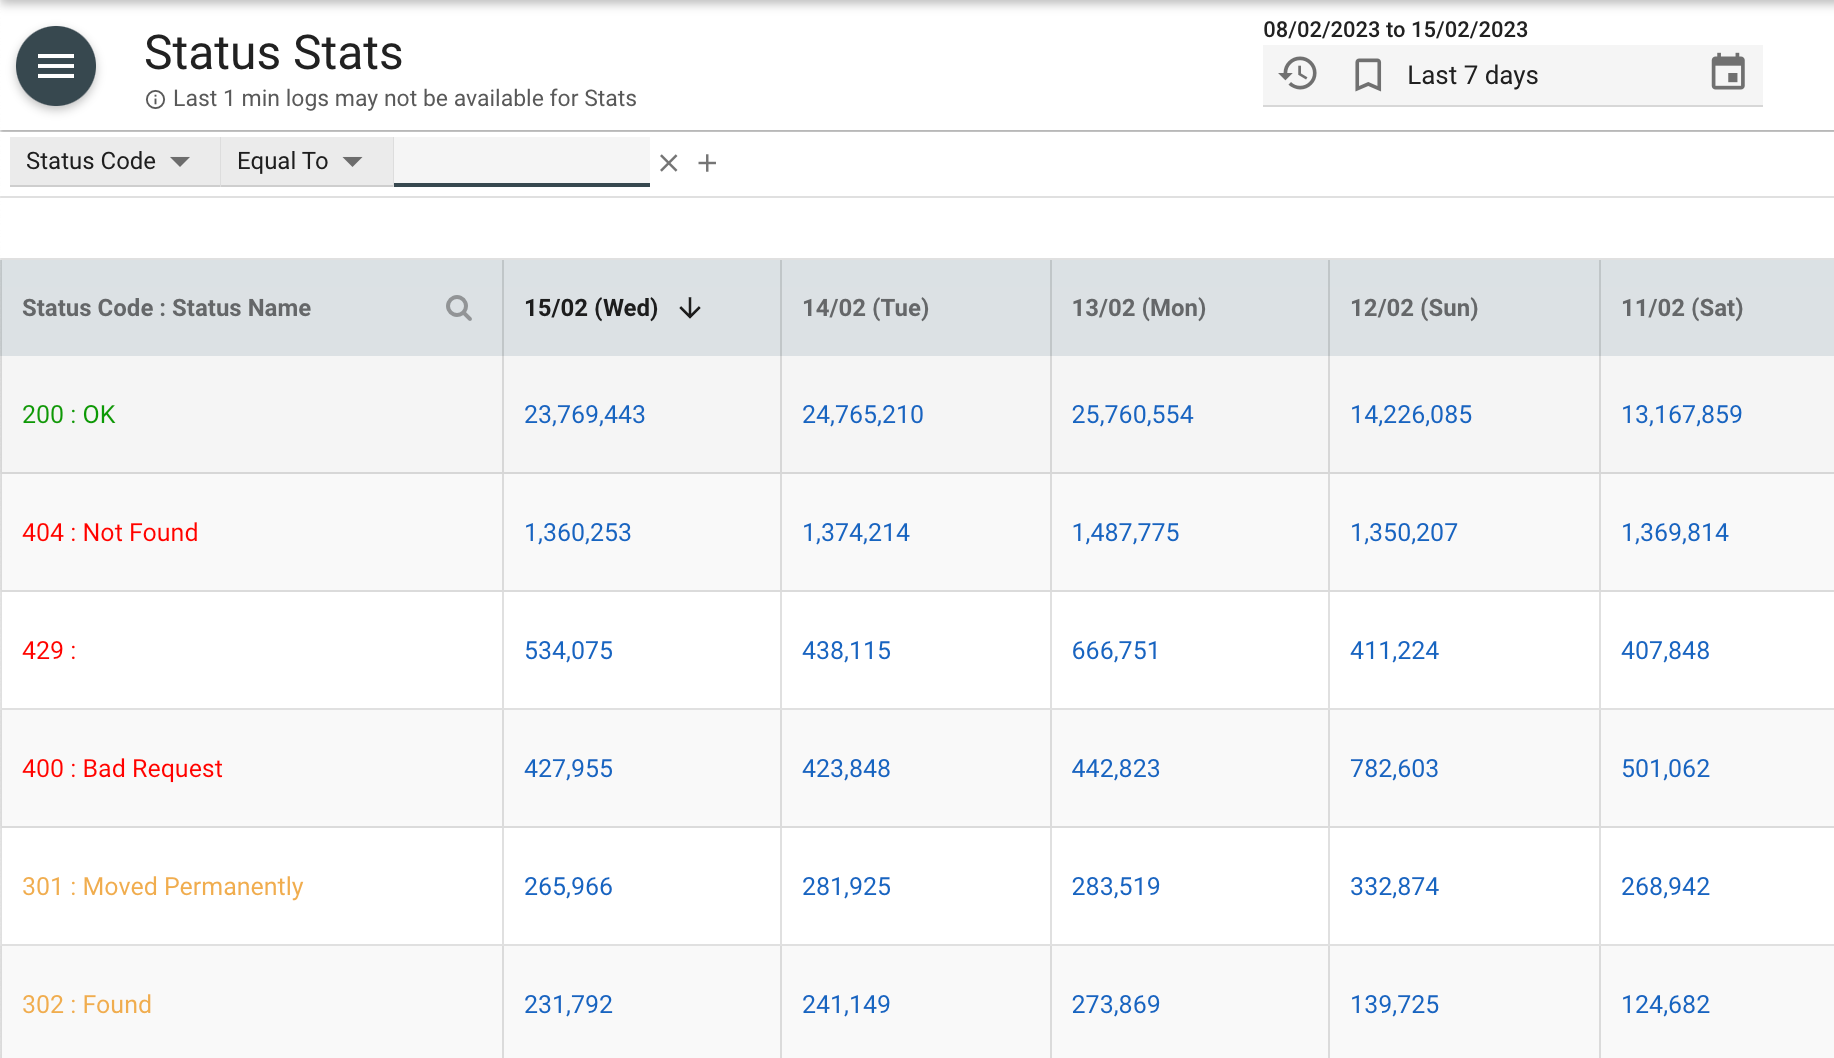
We use access logs to monitor and analyze access to our resources, and group them according to status codes, such as Status 200, Status 300, and Status 400. These status codes have different implications for the production environment, and by default, we analyze these logs and provide a dashboard to admin users that gives a consolidated view of the various status messages.

Figure 6: Overview of the dashboard provided to admin users to monitor the status of requests
The dashboard provides us with a quick overview of how our resources are performing, which helps us identify potential issues that might affect the performance and availability of our resources. For example, if we detect an unusually high number of Status 400 codes, this may indicate a problem with a particular resource or user. This allows us to investigate quickly and resolve the issue before it affects our users.
Besides monitoring the status codes, we also track the number of log files in each category. This helps us determine the success rate of user access attempts. By analyzing this data, we can identify and investigate any access attempts that might have failed, which could be an indication of a security threat.
Our log analysis practices allow us to detect and respond quickly to any issues that arise within our IT infrastructure.
b) According to response time
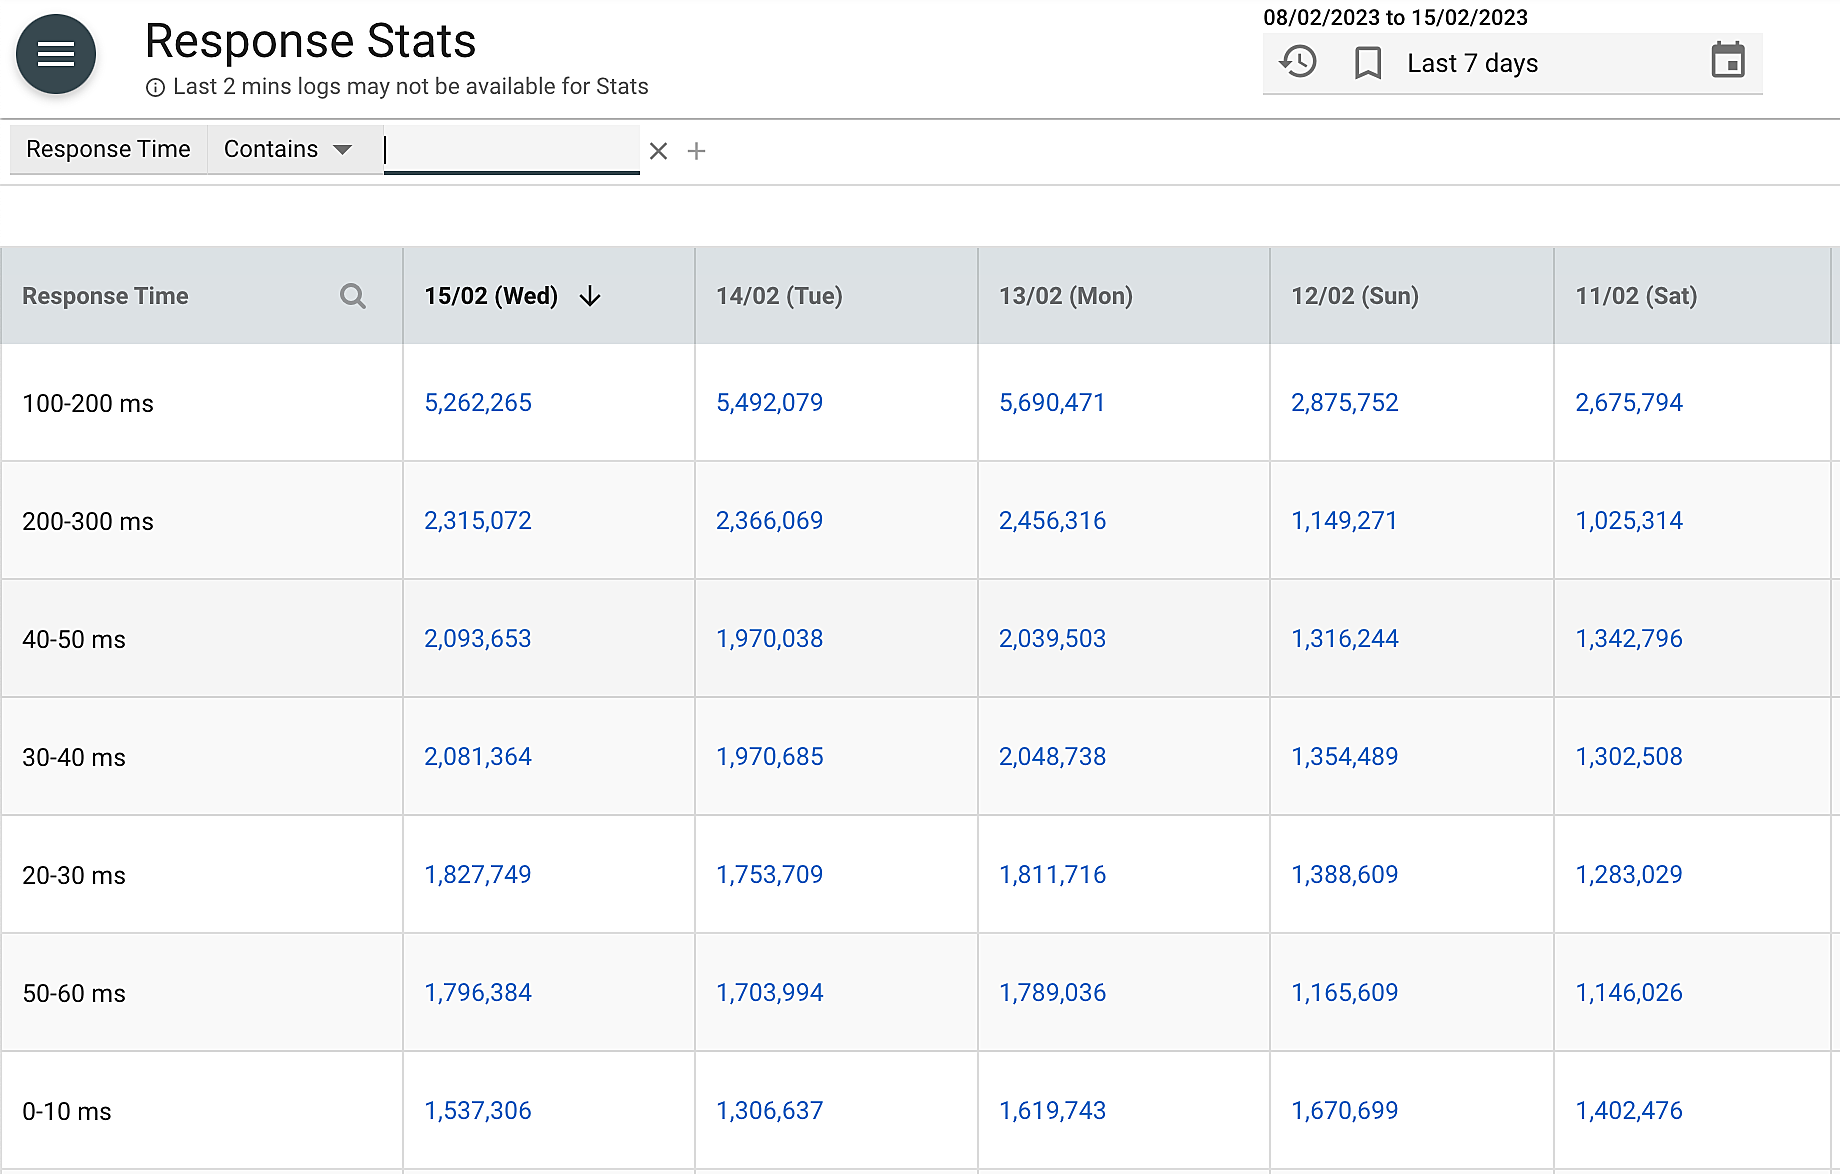
We analyze and categorize log files based on response time. This helps us determine how much time it takes to retrieve various log files and identify potential performance issues. We provide a dashboard that shows the range of time, how many log files, and what types of files were retrieved, as shown in Figure 7 below.

Figure 7: Overview of the dashboard provided to admin users to monitor the response time for requests
The dashboard makes it easy for admin users to understand the analysis by displaying pre-analyzed data in the database. Admin users can view the information they need by searching for a specific range of time or reviewing the pre-analyzed data. However, if they require more specific information, they can also search for it.
By analyzing log files based on response time, we can quickly identify potential performance issues and take corrective action. The dashboard provides us with a clear view of the time it takes to retrieve log files, which helps us identify any slow or unresponsive resources. This allows us to take corrective action before these issues impact our users.
Custom analysis
Although our default analysis provides admin users with an overview of log file retrieval time, in some cases, they may require deeper analysis. By default, we provide analysis for the 1-10 minute range in response time. However, if a user requires analysis for a response time in the range of 10-15 minutes, they can raise a query which will retrieve additional files from DFS to perform a custom analysis.
While our default analysis helps to reduce the number of queries we receive, we recognize that some problems require deeper analysis to resolve. Custom analysis can provide the additional insights required to identify the root cause of an issue and take corrective action.
Despite the need for custom analysis in some instances, the majority of user requirements can be met by the default analysis. The dashboard provides a range of insights that give admin users a quick and easy way to understand how our resources are performing. By providing both default and custom analysis options, we can meet the needs of our users, regardless of their requirements.