Integrating with SupportCenter Plus
Analytics Plus seamlessly integrates with SupportCenter Plus, and enables you to easily analyze your customer support data and keep track of key metrics. This helps managers create intuitive reports and dashboards, with the ability to drill down into specifics.
General
Setup
- How do I integrate Analytics Plus with SupportCenter Plus?
- How long should I wait for my SupportCenter Plus data to initially appear in Analytics Plus?
- What should I do when the data synchronization fails?
- Can I edit the synchronization settings?
- Can I trigger a synchronization of my SupportCenter Plus data on-demand?
- How do I create custom reports over my SupportCenter Plus data?
Reporting Features
- What are the report types supported by Analytics Plus?
- Can I modify the pre-built reports created on integrating with SupportCenter Plus?
- How do I create reports using fields/columns across different SupportCenter Plus modules?
- What are formulas in reports?
- Is it possible to create custom formulas in Analytics Plus?
- Can I modify the tables imported from SupportCenter Plus?
- Can I add new columns to the tables imported from SupportCenter Plus?
- Can I import new tables into the SupportCenter Plus workspace?
- Can I combine data from other sources with the data from SupportCenter Plus, and create reports and dashboards?
- What are Query Tables?
Sharing & Collaboration
- How do I share reports, dashboards, and tables in Analytics Plus?
- Why are my colleagues unable to access the reports I create?
- Can other users create reports using the tables in the SupportCenter Plus workspace?
- Is it possible to share the same report to multiple users such that they each see different data?
- Can I export a report or a dashboard?
- How do I print the reports and dashboards created in Analytics Plus?
- Can I email reports and dashboards at scheduled times?
- Can I embed reports?
Known Issue
Help & Support
- How do I get technical support on Analytics Plus?
- Can I have get a personalized demo of this integration?
General
1. What is Analytics Plus?
ManageEngine Analytics Plus is an on-premises reporting and business intelligence application that helps you analyze your IT data and create insightful reports & dashboards for informed decision-making. It offers the following important capabilities:
Import data from local files, web feeds, local and cloud databases, and cloud storage/drive.
Displays data in an easy-to-view excel format.
Build custom reports and dashboards easily, with the drag-and-drop report builder.
Supports powerful visualizations in the form of charts, pivot tables , summary views, tabular views, and dashboards.
Generate reports and KPIs in seconds with Zia, Analytics Plus' intelligent analytics assistant powered by Machine Learning and Artificial Intelligence.
Create custom formulas using the built in formula engine that contains a wide range of mathematical, statistical and logical functions.
Share reports and dashboards with your colleagues easily, through a wide range of collaboration features.
Export and publish reports and dashboards in various formats, and configure permissions and filters for the views.
Supports out-of-the-box integrations with a wide number of applications, to give you pre-built reports and dashboards on your application's data within minutes.
2. What are the highlights of this integration?
Analytics Plus seamlessly integrates with SupportCenter Plus, to create intuitive reports and live dashboards for a high level view of your customer support data. The data from the following modules will be synchronized into Analytics Plus on setting up this integration.
- Requests
- Billing
- Tasks
- Time Analysis (this covers changes in Ticket Status, Support Group and Support Reps)
- Time Entries
- Solutions
- Survey
Setup
1. How do I integrate Analytics Plus with SupportCenter Plus?
2. How long should I wait for my SupportCenter Plus data to initially appear in Analytics Plus?
After setting up the integration, you might have to wait some time for the initial fetch to happen. Depending on the amount of data in your application, the reports and dashboards might take up to 5 minutes to display all the metrics. If you access the workspace before the initial fetch, it will not display any data.
3. What should I do when the data synchronization fails?
The import or synchronization process of your SupportCenter Plus data can fail sometimes, due to a variety of reasons. Please write to analyticsplus-support@manageengine.com if the issue persists.
4. Can I edit the synchronization settings?
Follow the steps below to edit the connection and synchronization settings.
Open your SupportCenter Plus application and navigate to the Admin tab.
Click the Advanced Analytics option under the Integrations section.
Navigate to the Additional Setup tab and modify the settings as required.
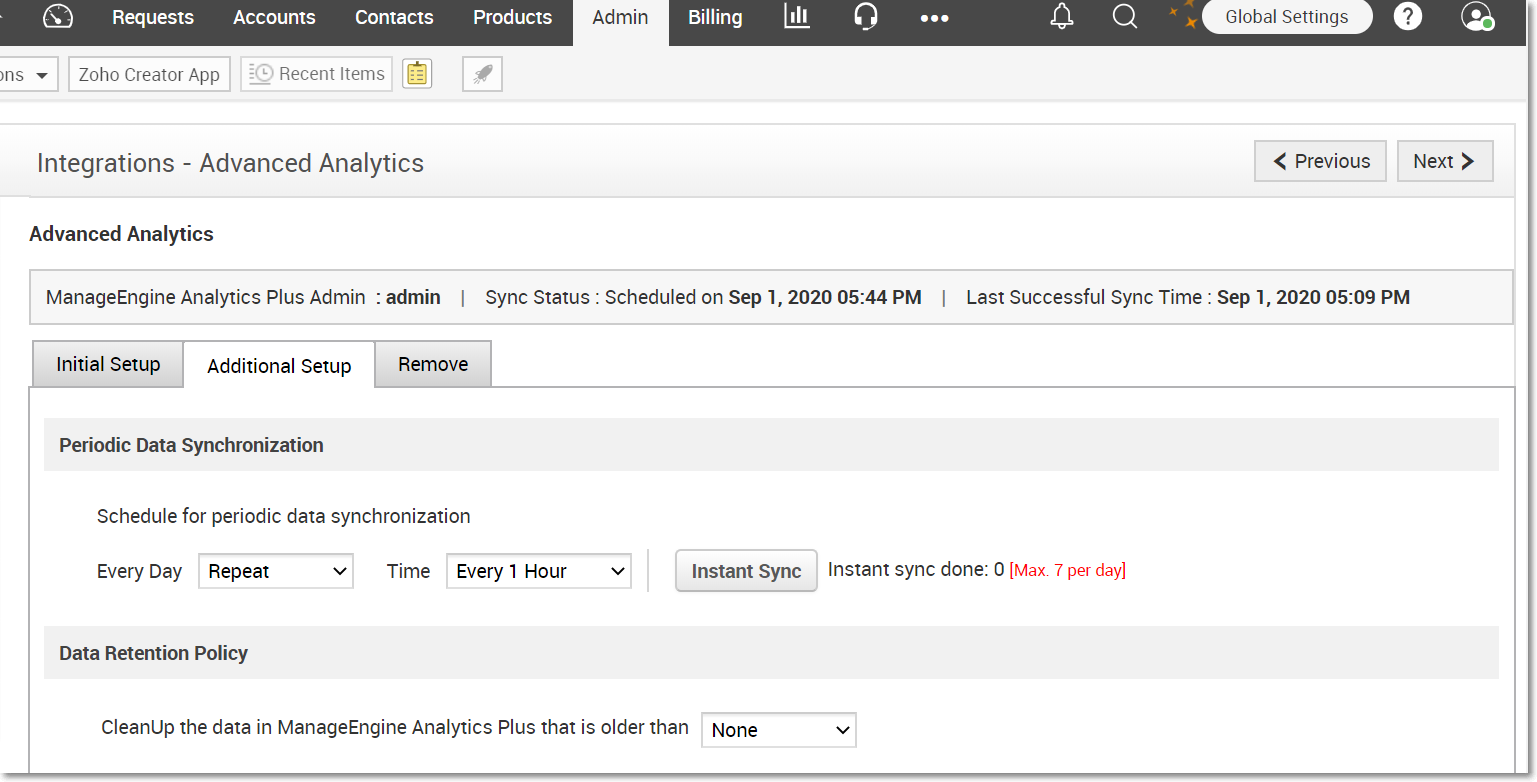
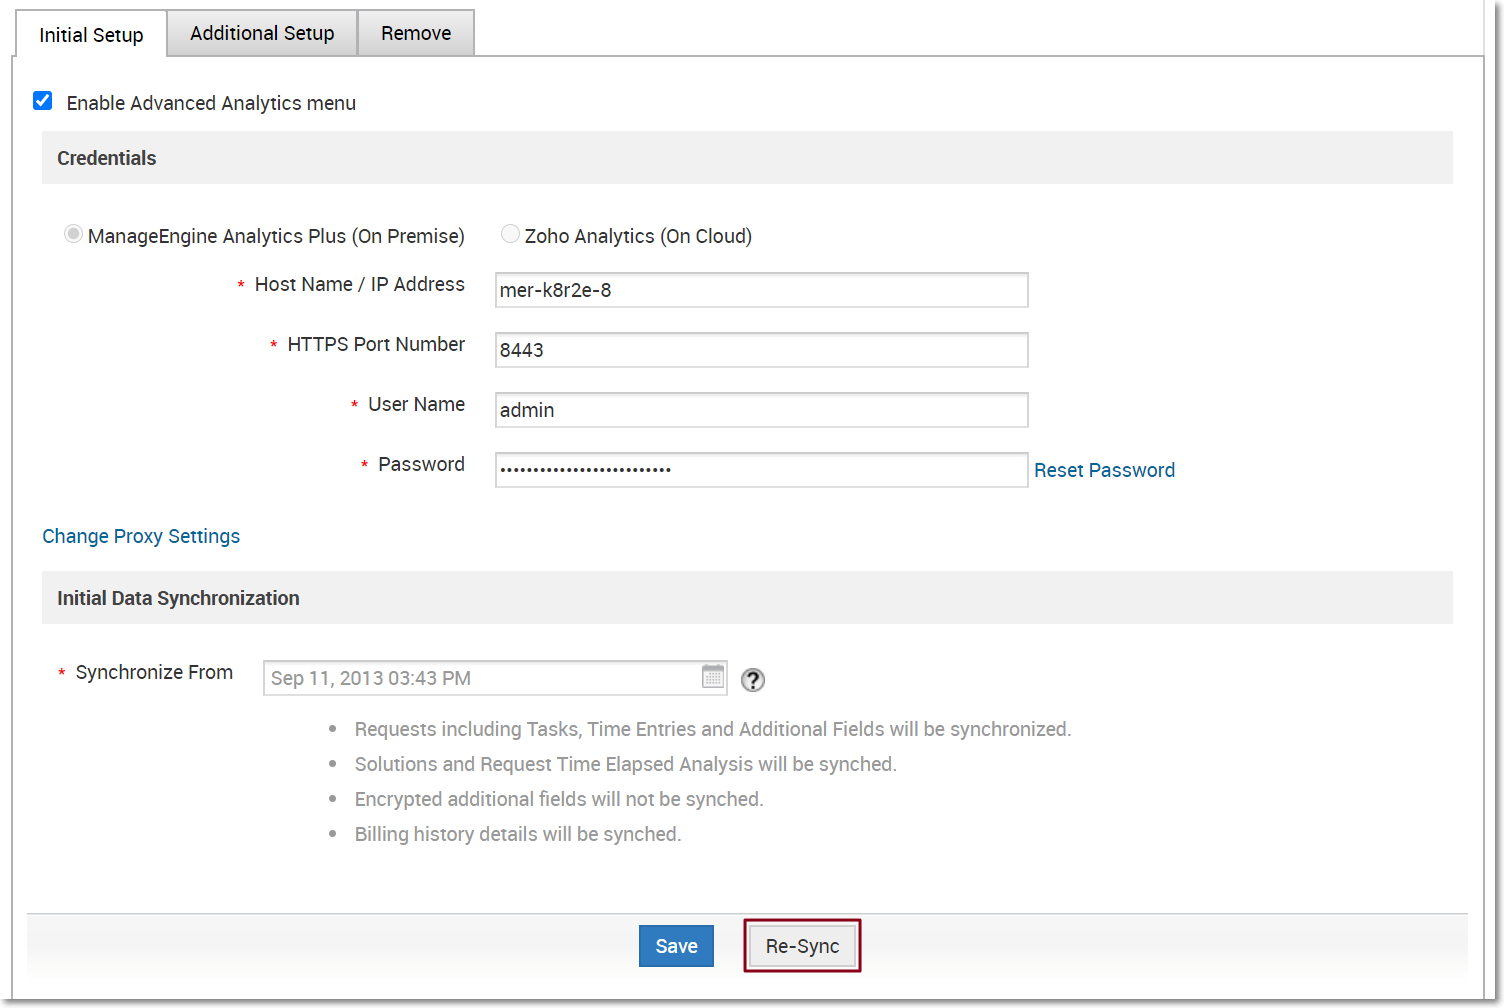
After modifying the necessary settings, navigate to the Initial Setup tab and click the Re-Sync button.
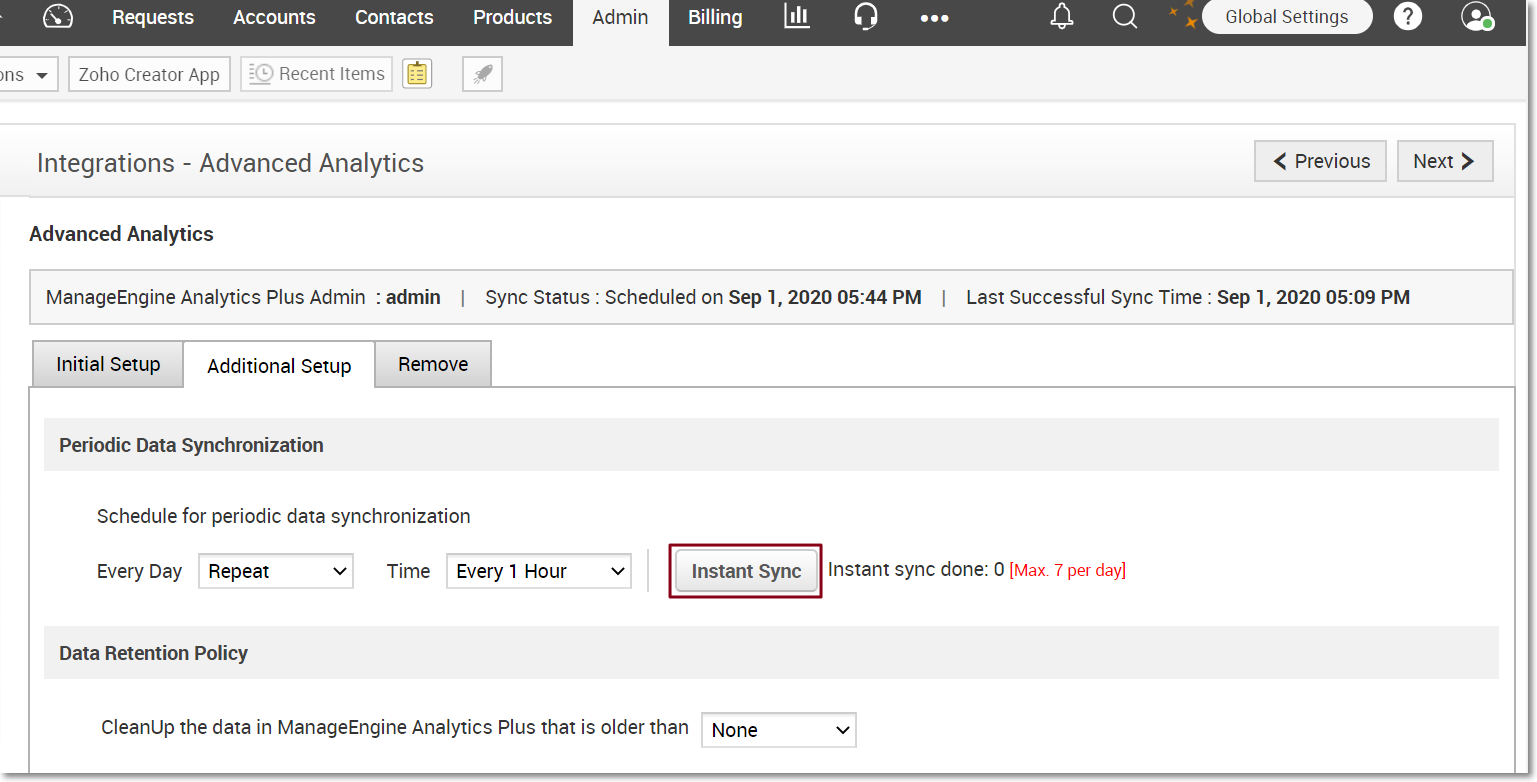
5. Can I trigger a synchronization of my SupportCenter Plus data on-demand?
Yes. To do this, open your SupportCenter Plus application. Navigate to Admin > Advanced Analytics, and click the Additional Setup tab. The Instant Sync button allows you to trigger a data synchronization manually. This action can be done a maximum of seven times in a day.
6. How do I create custom reports over my SupportCenter Plus data?
You can easily create custom reports in the form of charts, pivot tables, summary and tabular views in Analytics Plus. Click the corresponding links to learn more about creating reports. These reports can also be organized together to form intuitive dashboards. Refer this documentation to learn more about creating dashboards.
Reporting Features
1. What are the report types supported by Analytics Plus?
Analytics Plus supports a wide variety of reports, in the form of charts, pivot tables, summary views and tabular views. To know more about the various types of reports, click here. To know more about dashboards and KPI widgets, click here.
2. Can I modify the pre-built reports created on integrating with SupportCenter Plus?
Yes. If you are the Server Administrator or a workspace administrator of the workspace in which the integration is set up, click the Edit Design button in a report's toolbar and make the required changes. If you are a user to whom a report is shared, save a copy of the report by clicking Save > Save As, and modify the copied version as needed.
3. How do I create reports using fields/columns across different SupportCenter Plus modules?
Columns from different SupportCenter Plus modules are joined by default. Therefore, reports can be created over this data by simply dragging and dropping the respective columns in the report builder. Click here to learn more about creating reports.
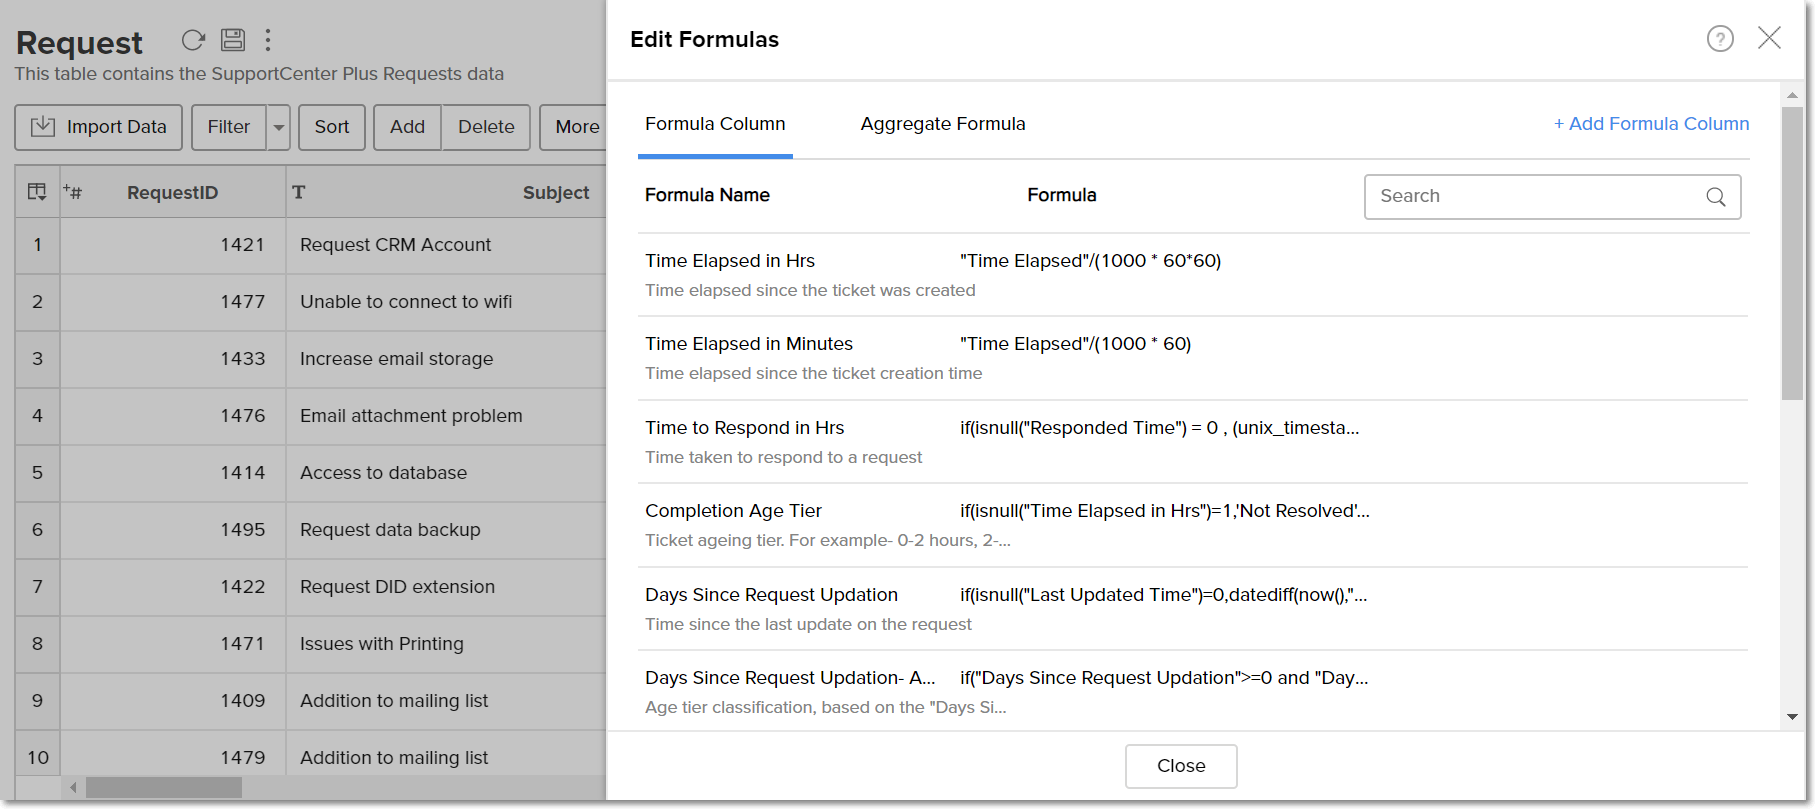
4. What are formulas in reports?
Formulas are calculations that can be defined using the powerful formula engine in Analytics Plus, to create required reports. Refer this documentation to know more. There are also several default formulas created based on the SupportCenter Plus modules. To view the default formulas, open the required table, click Add and select the Edit Formulas option.
5. Is it possible to create custom formulas in Analytics Plus?
Yes. Refer this documentation to learn more.
6. Can I modify the tables imported from SupportCenter Plus?
The data from SupportCenter Plus is synchronized with Analytics Plus automatically, and stored in the form of various tables. Therefore, it is not possible to add data or modify the existing data present in these tables.
7. Can I add new columns to the tables imported from SupportCenter Plus?
No. However, you can add Formula Columns and Aggregate Formulas to these tables, to help create custom reports. Refer this documentation to know more.
8. Can I import new tables into the SupportCenter Plus workspace?
To do this, open the SupportCenter Plus workspace, click Create from the side panel and select the New Table / Import Data option. You can integrate with other applications, or choose to import data stored in local files, web URLs, local databases, cloud databases and cloud drives. Click the corresponding links to know more.
9. Can I combine data from other sources with the data from SupportCenter Plus, and create reports and dashboards?
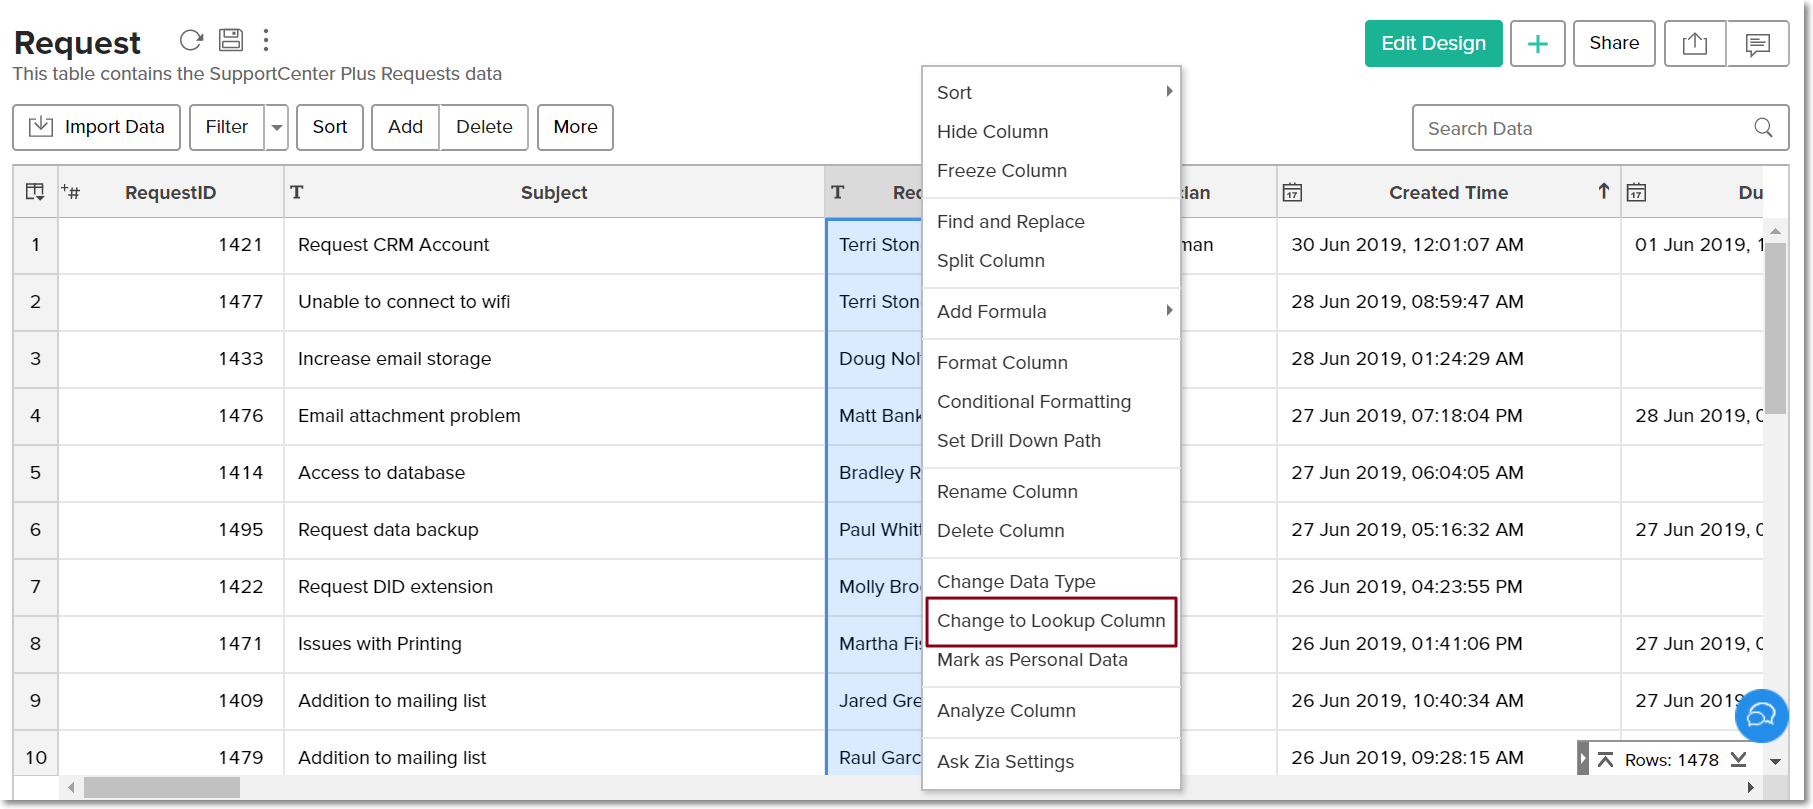
Yes. To do this, import or add a new table to the SupportCenter Plus workspace and define a lookup relationship between the added data and the existing data in the workspace. To define a lookup relationship between two tables, it is essential that the tables have at least one column in common between them. Follow the below steps to establish a lookup relationship.
Open the corresponding table, right click the column header and select the Change to Lookup Column option.
In the dialog that opens, select the column from the second table to look up.
Click OK.
Click here to learn more about lookup columns.
10. What are Query Tables?
Using query tables, Analytics Plus allows you to import the required data required by writing standard SQL queries. This feature also allows you to combine data from different tables, and create reports from the combined data. Refer this documentation to know more.
Sharing & Collaboration
1. How do I share reports, dashboards, and tables in Analytics Plus?
You can share the out-of-the-box reports, dashboards and tables, and the ones you create, with other users easily. Refer this documentation to know more.
2. Why are my colleagues unable to access the reports I create?
The SupportCenter Plus workspace can be accessed only by the administrator who set up the integration. To allow other users to access the out-of-the-box reports and dashboards, you can share the reports and dashboards as needed. Refer this documentation to know more. You can also share the entire workspace with a user. Refer this documentation to know more.
3. Can other users create reports using the tables in the SupportCenter Plus workspace?
Yes. To do this, share the required table with the users with the required permissions and filters. Refer this documentation to know more.
4. Is it possible to share the same report to multiple users such that they each see different data?
Yes, you can do this by creating Variables. This allows you to share the report to several users, with associated filter criteria so that each user can access only the data specific to them. To learn more, refer this documentation.
5. Can I export a report or a dashboard?
Yes, you can export the report or dashboard in various formats such as CSV, EXCEL, PDF, HTML and image. To learn more, refer this documentation.
6. How do I print the reports and dashboards created in Analytics Plus?
To do this, export the report or dashboard in the required format and print the exported file. To learn more about exporting a view in Analytics Plus, refer this documentation.
Note: To export a shared report or dashboard, the Export permission has to be enabled. Refer this documentation to learn more about permissions.
7. Can I email reports and dashboards at scheduled times?
Yes, you can easily set up email schedules. Refer this documentation to learn more.
8. Can I embed reports?
Yes. You can easily embed reports and dashboards into websites, applications or blogs. Refer this documentation to know more.
Known Issue
1. Sync issue as a result of self-signed certificate used in Analytics Plus.
The following error occurs while integrating SupportCenter Plus with Analytics Plus installations that use a self-signed certificate.
Error message: Sync failed due to a known SSL certificate issue. Follow the instructions in this link and try again.
Please follow the instructions below to resolve this by creating an SSL certificate for Analytics Plus with a custom hostname or IP address.
- Log in to the server in which your Analytics Plus application is running.
- Open command prompt/terminal and change the directory to <Analytics Plus home>\bin
- Run the script genSSLCert.bat (genSSLCert.sh on Linux installations) with the custom DNS name, server hostname, or IP address of the Analytics Plus server as arguments.
Example: If your Analytics Plus server's hostname is analytics-server, IP address is 192.168.1.1 and the DNS name is analytics-server.acmecorp.com, then run the command as
sh genSSLCert.bat dns:analytics-server,ip:192.168.1.1,dns:analytics-server.acmecorp.com
Note: We recommend including all possibilities while running the script. If IP address is used, prefix the same with "ip:". If hostname, FQDN, or DNS name is used, prefix it with "dns:".
- The script will generate a self-signed SSL certificate with the custom names/IP address mentioned.
- Restart the Analytics Plus server and trigger the integration from SupportCenter Plus.
Help & Support
1. How do I get technical support on Analytics Plus?
Technical support is free for all users, even during the trial period. You can contact technical support through:
- Email: analyticsplus-support@manageengine.com
- Phone: +1-888-720-9500
You can also get answers straight from our community.
2. Can I have get a personalized demo of this integration?
Yes, please register for a demo using the form on this page.

