- HOME
- ITSM Analytics
- The 3 ways that unified analytics help decrease MTTR
The 3 ways that unified analytics help decrease MTTR
- Last Updated: July 1, 2024
- 1.2K Views
- 7 Min Read
An organization that operates like a well-oiled machine is a dream for IT leaders. Especially one that identifies and resolves problems seamlessly while effectively managing time and budget constraints. Such an organization also keeps its users satisfied and happy. Though it sounds too good to be true, by simply following a few best practices, a part of that dream can be achieved easily.
The first step is reducing the mean time to resolve (MTTR), as it minimizes costs and boosts end-user satisfaction. However, it is challenging to track down what factors are driving up your MTTR when all your data is siloed into different data sources and applications.
Unified analytics will make reducing the MTTR for organizations an easy goal. In this blog, we'll explore unified analytics and how it helps reduce your organization's MTTR and give you a brief overview of the tools you need to streamline all your processes, boost your operation's efficiency, and reach unprecedented levels of end-user satisfaction.
What is mean time to resolve (MTTR)?
MTTR is a metric that helps IT teams track the time taken to resolve tickets. To calculate your organization's MTTR, take the total resolution time and divide it by the number of tickets.
Let's consider an example by comparing the week-long ticket resolution rates of two organizations. In Organization A, help desk technicians resolved 100 tickets in 60 hours, resulting in an MTTR of 0.6 hours (60 divided by 100). On the other hand, Organization B's help desk resolved 80 tickets in the same 60 hours, giving them an MTTR of 1.33. Without considering other qualities of these tickets, this comparison reveals that Organization A is more effective in resolving tickets than Organization B.
Since processes vary greatly between organizations, its hard to arrive on a universal standard for MTTR. Organizations should strive to constantly improve on their MTTR by enhancing the efficiency of incident resolution processes and help desk teams.
What is unified analytics and how does it help in reducing MTTR?
It's great having all your data in one place, but how do you use it effectively to discover the answers to all your questions? Unified analytics can help.
A unified analytics approach can help make sense of data siloed across various data sources, applications, and monitoring tools. It enables you to gather all your data in one place and helps you make better decisions and improve your operations. Unified analytics is critical to reducing the MTTR in an organization, as it converges multiple IT sub-domains and integrates correlated data sources instead of just focusing on the environment where issues are most prevalent. This enables IT leaders and technicians to get contextual information on issues and trace the roots of problems back to small changes that would normally go unnoticed. By integrating diverse data and analytics capabilities into a single platform, unified analytics empowers IT leaders to address incidents with speed and agility.
3 ways unified analytics can help reduce MTTR
Here are three ways unified analytics can help reduce MTTR in your organization:
1. Identify the root cause of problems faster
As technology continues to advance, its role within organizations also progresses. Nowadays, organizations heavily rely on technology for their operations. However, technology doesn't always function flawlessly. Even minor configurations or updates to hardware or software components can lead to network unavailability or sluggishness, causing nightmares for help desk teams. The key to swiftly and effectively resolving network-related issues lies in pinpointing the root cause and understanding its impact. For instance, network packet loss can quickly escalate into application latency that directly affects end users.
Consider this scenario: Your help desk experiences a sudden influx of tickets, leaving your technicians perplexed about the underlying cause of the ticket flood. At the same time, your network monitoring tools generate event logs and alarms that add more pressure on the technicians. First, to gain insights into the trigger behind these tickets, you can generate a keyword cloud using the subject lines of the incoming tickets and seamlessly identify the common issues that have led to the surge in ticket volume. Here's a sample report with the subject lines of help desk tickets from a fictional organization:
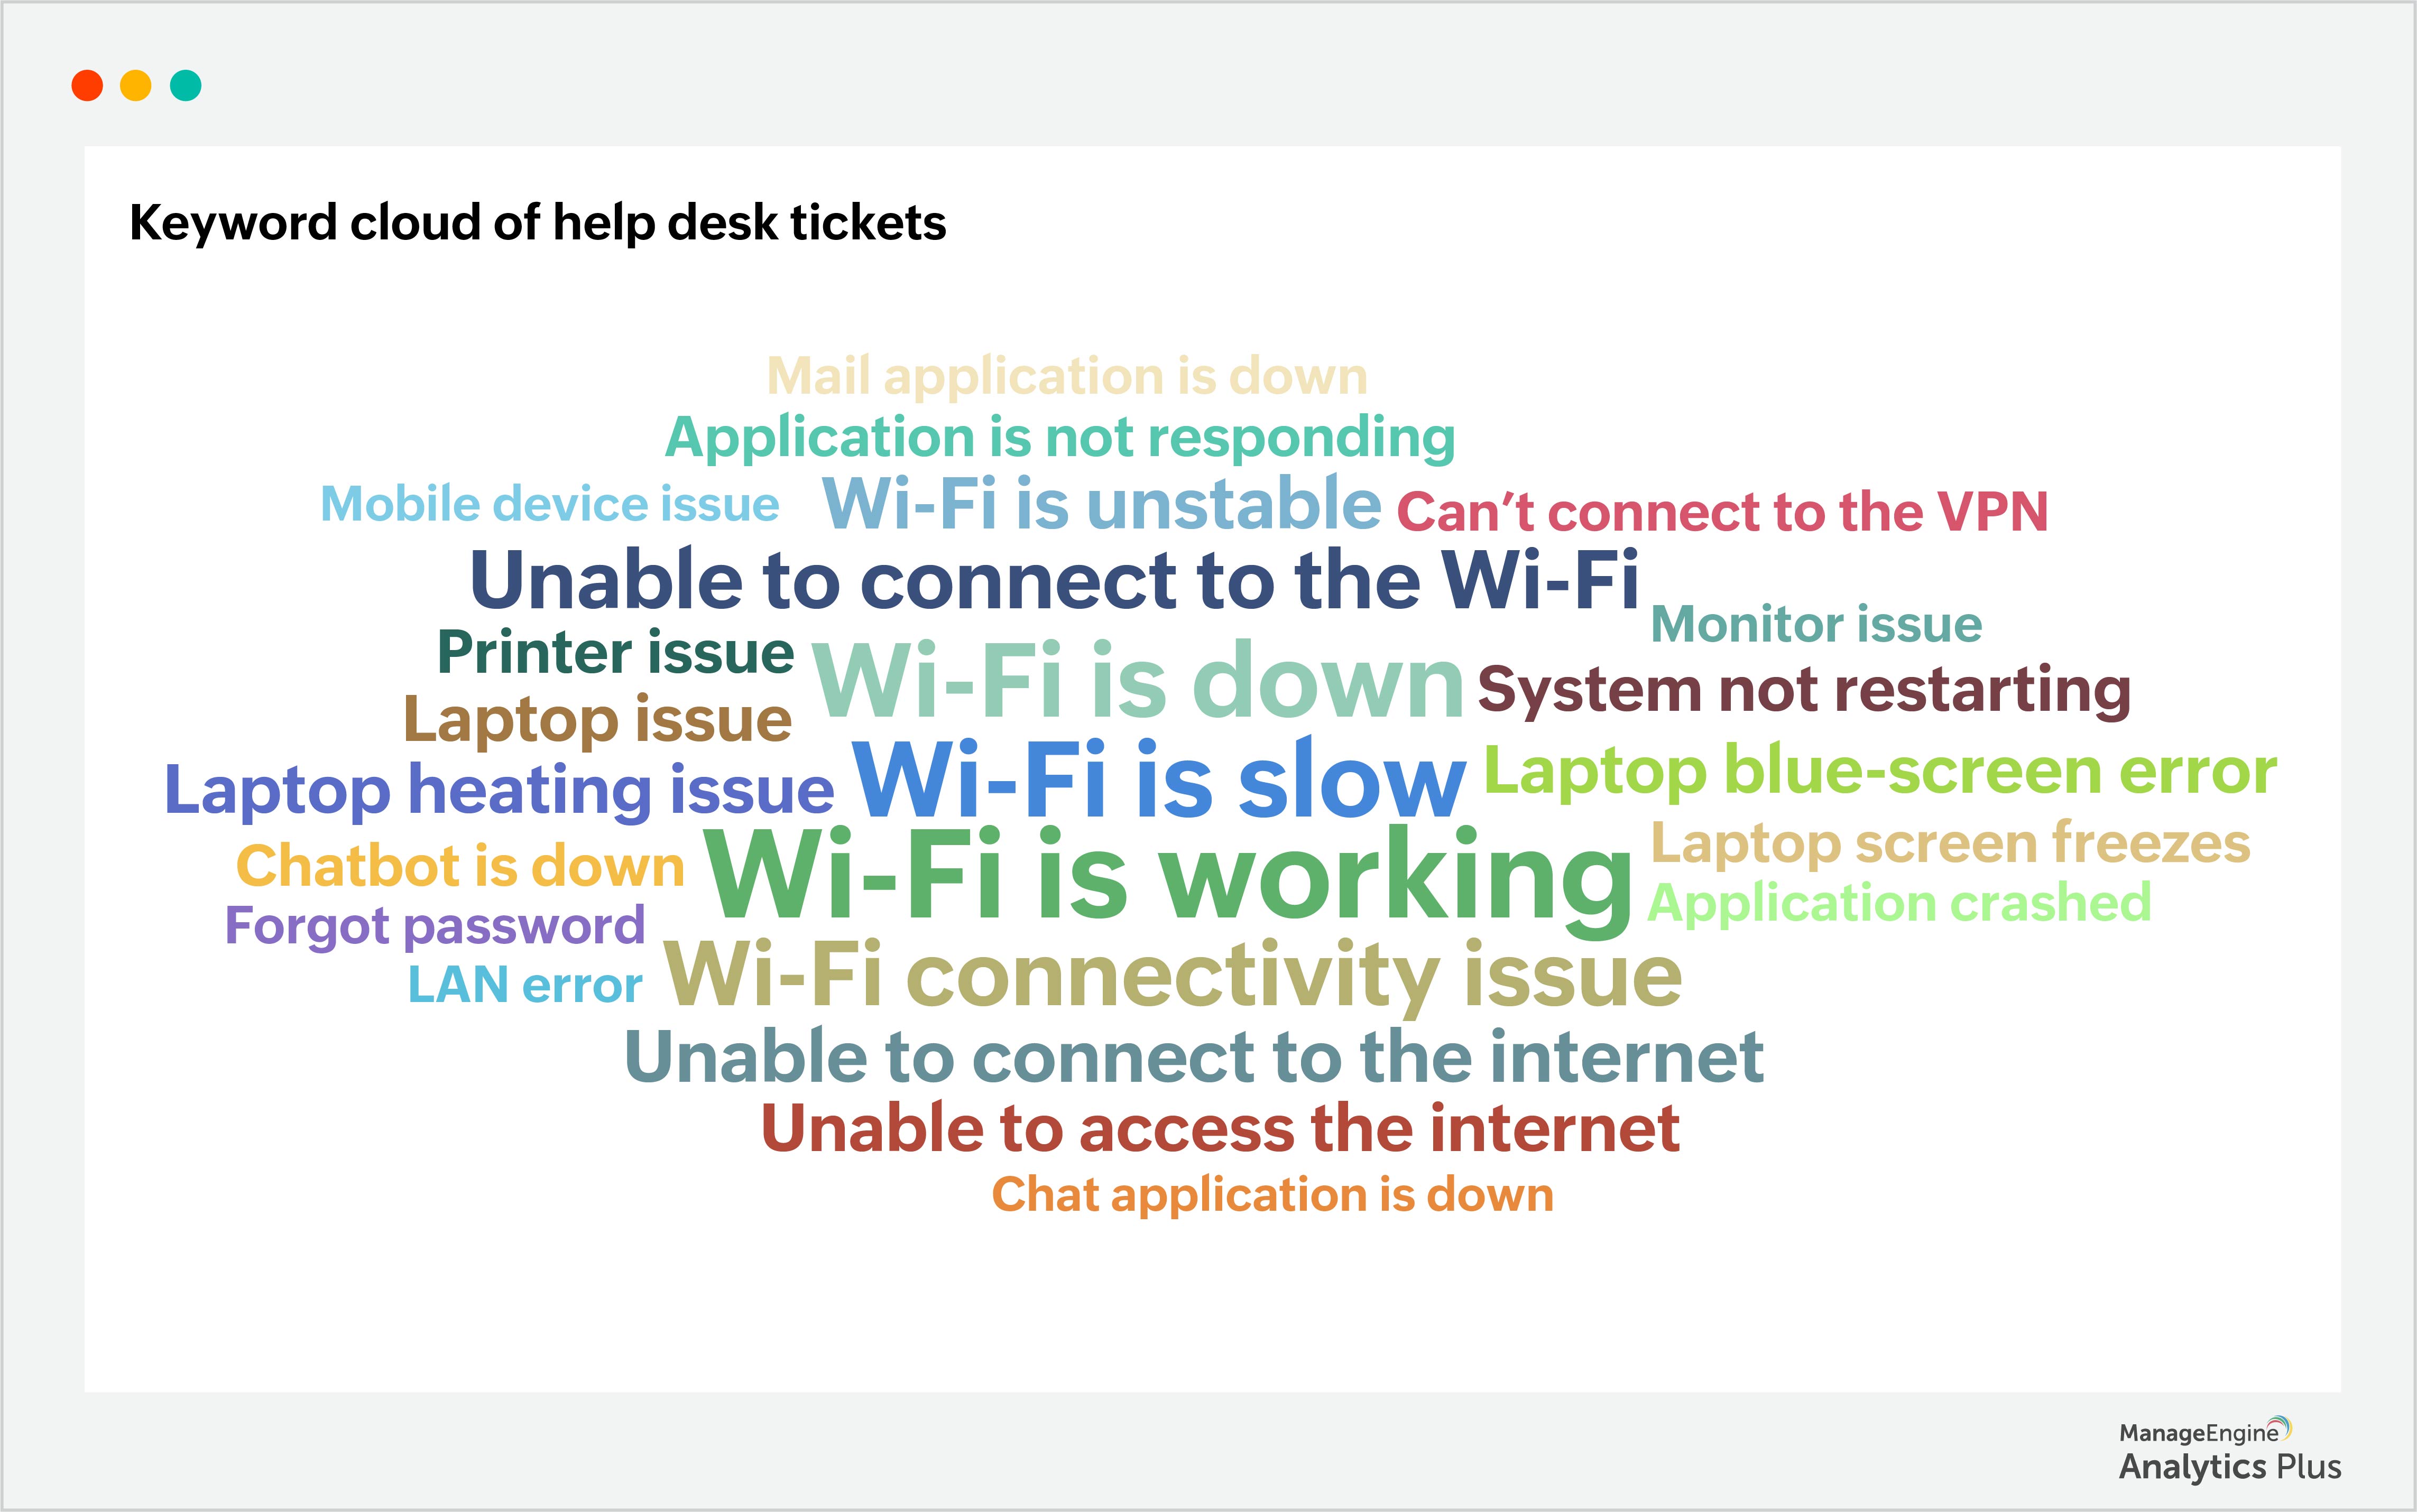
With the keyword cloud report, we have pinned the Wi-Fi problem that caused the surge in tickets. This saves time for the technicians and enables them to pinpoint the root cause of why the Wi-Fi is down. Armed with this information, let's take a look at another report that shows the number of alarms generated throughout the day:
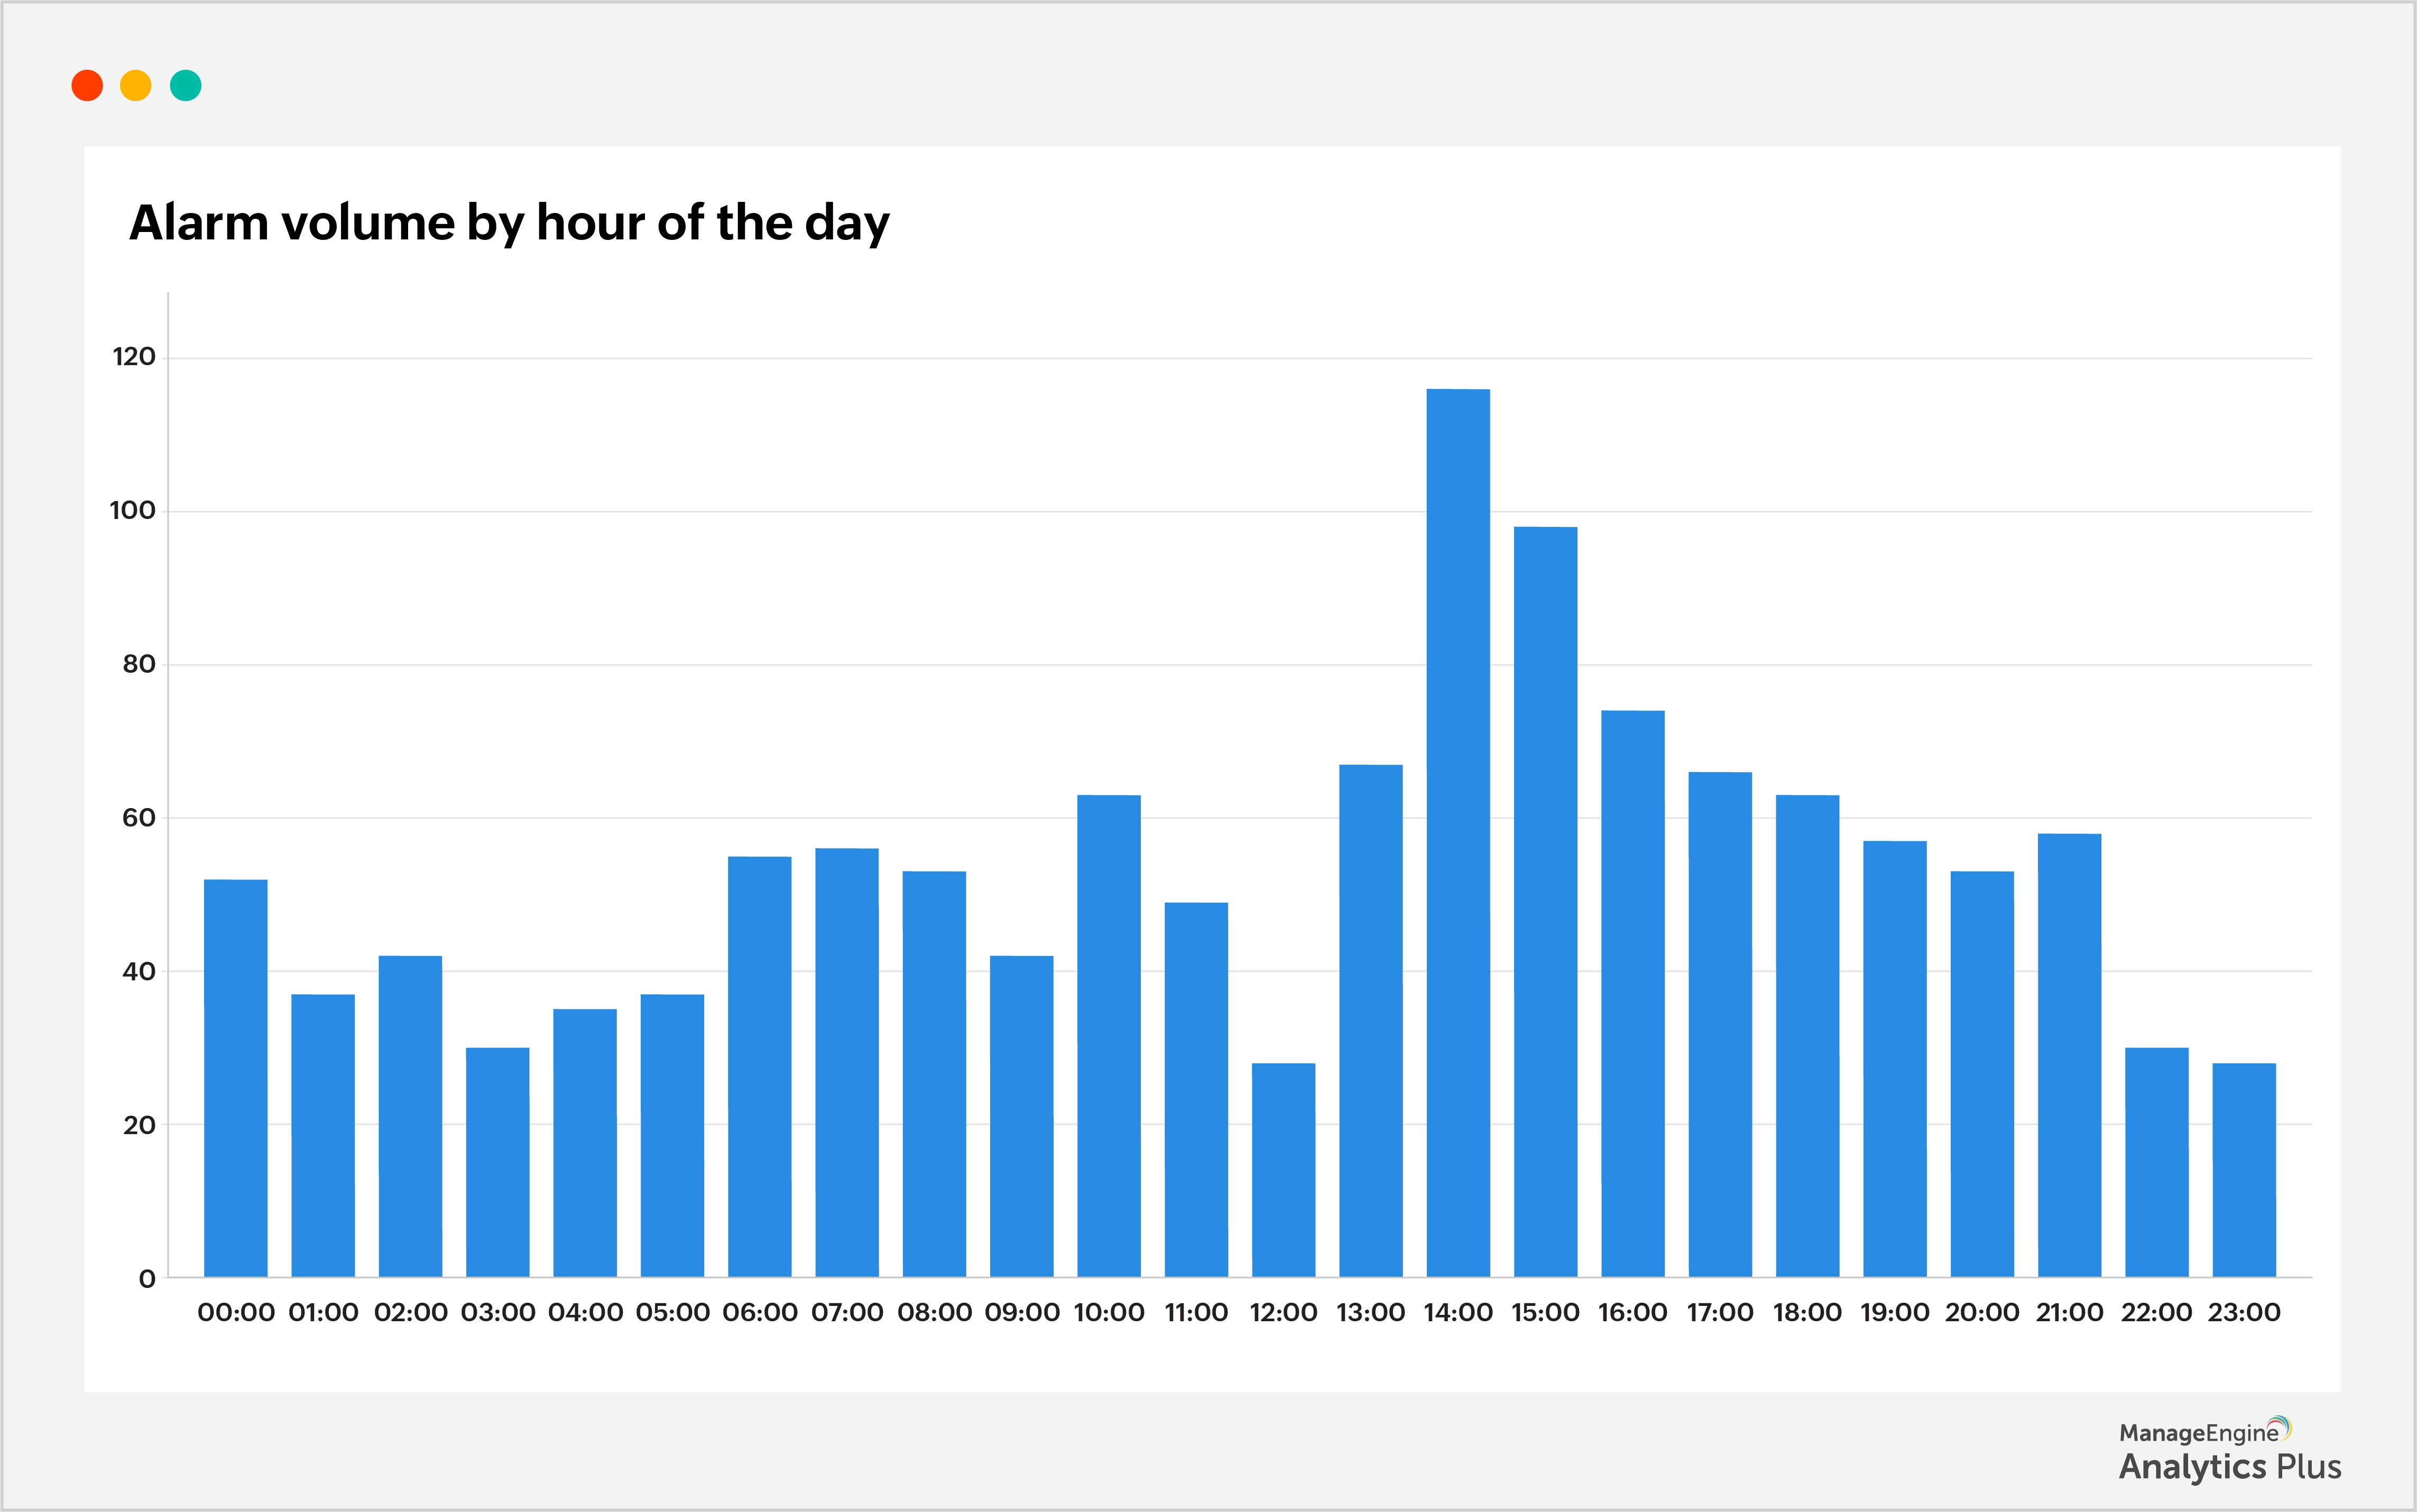
In the report above, the number of alarms generated throughout most of the day is normal. However, there's a spike in the number of alarms generated at 2pm. To identify what has triggered this spike, we have consolidated data from network monitoring tools and access point logs using unified analytics to discover the reason behind the alarms and gain an overview of the Wi-Fi infrastructure. As a result, an instance of access point downtime has been identified as the underlying cause of the Wi-Fi problem. Here's a report:
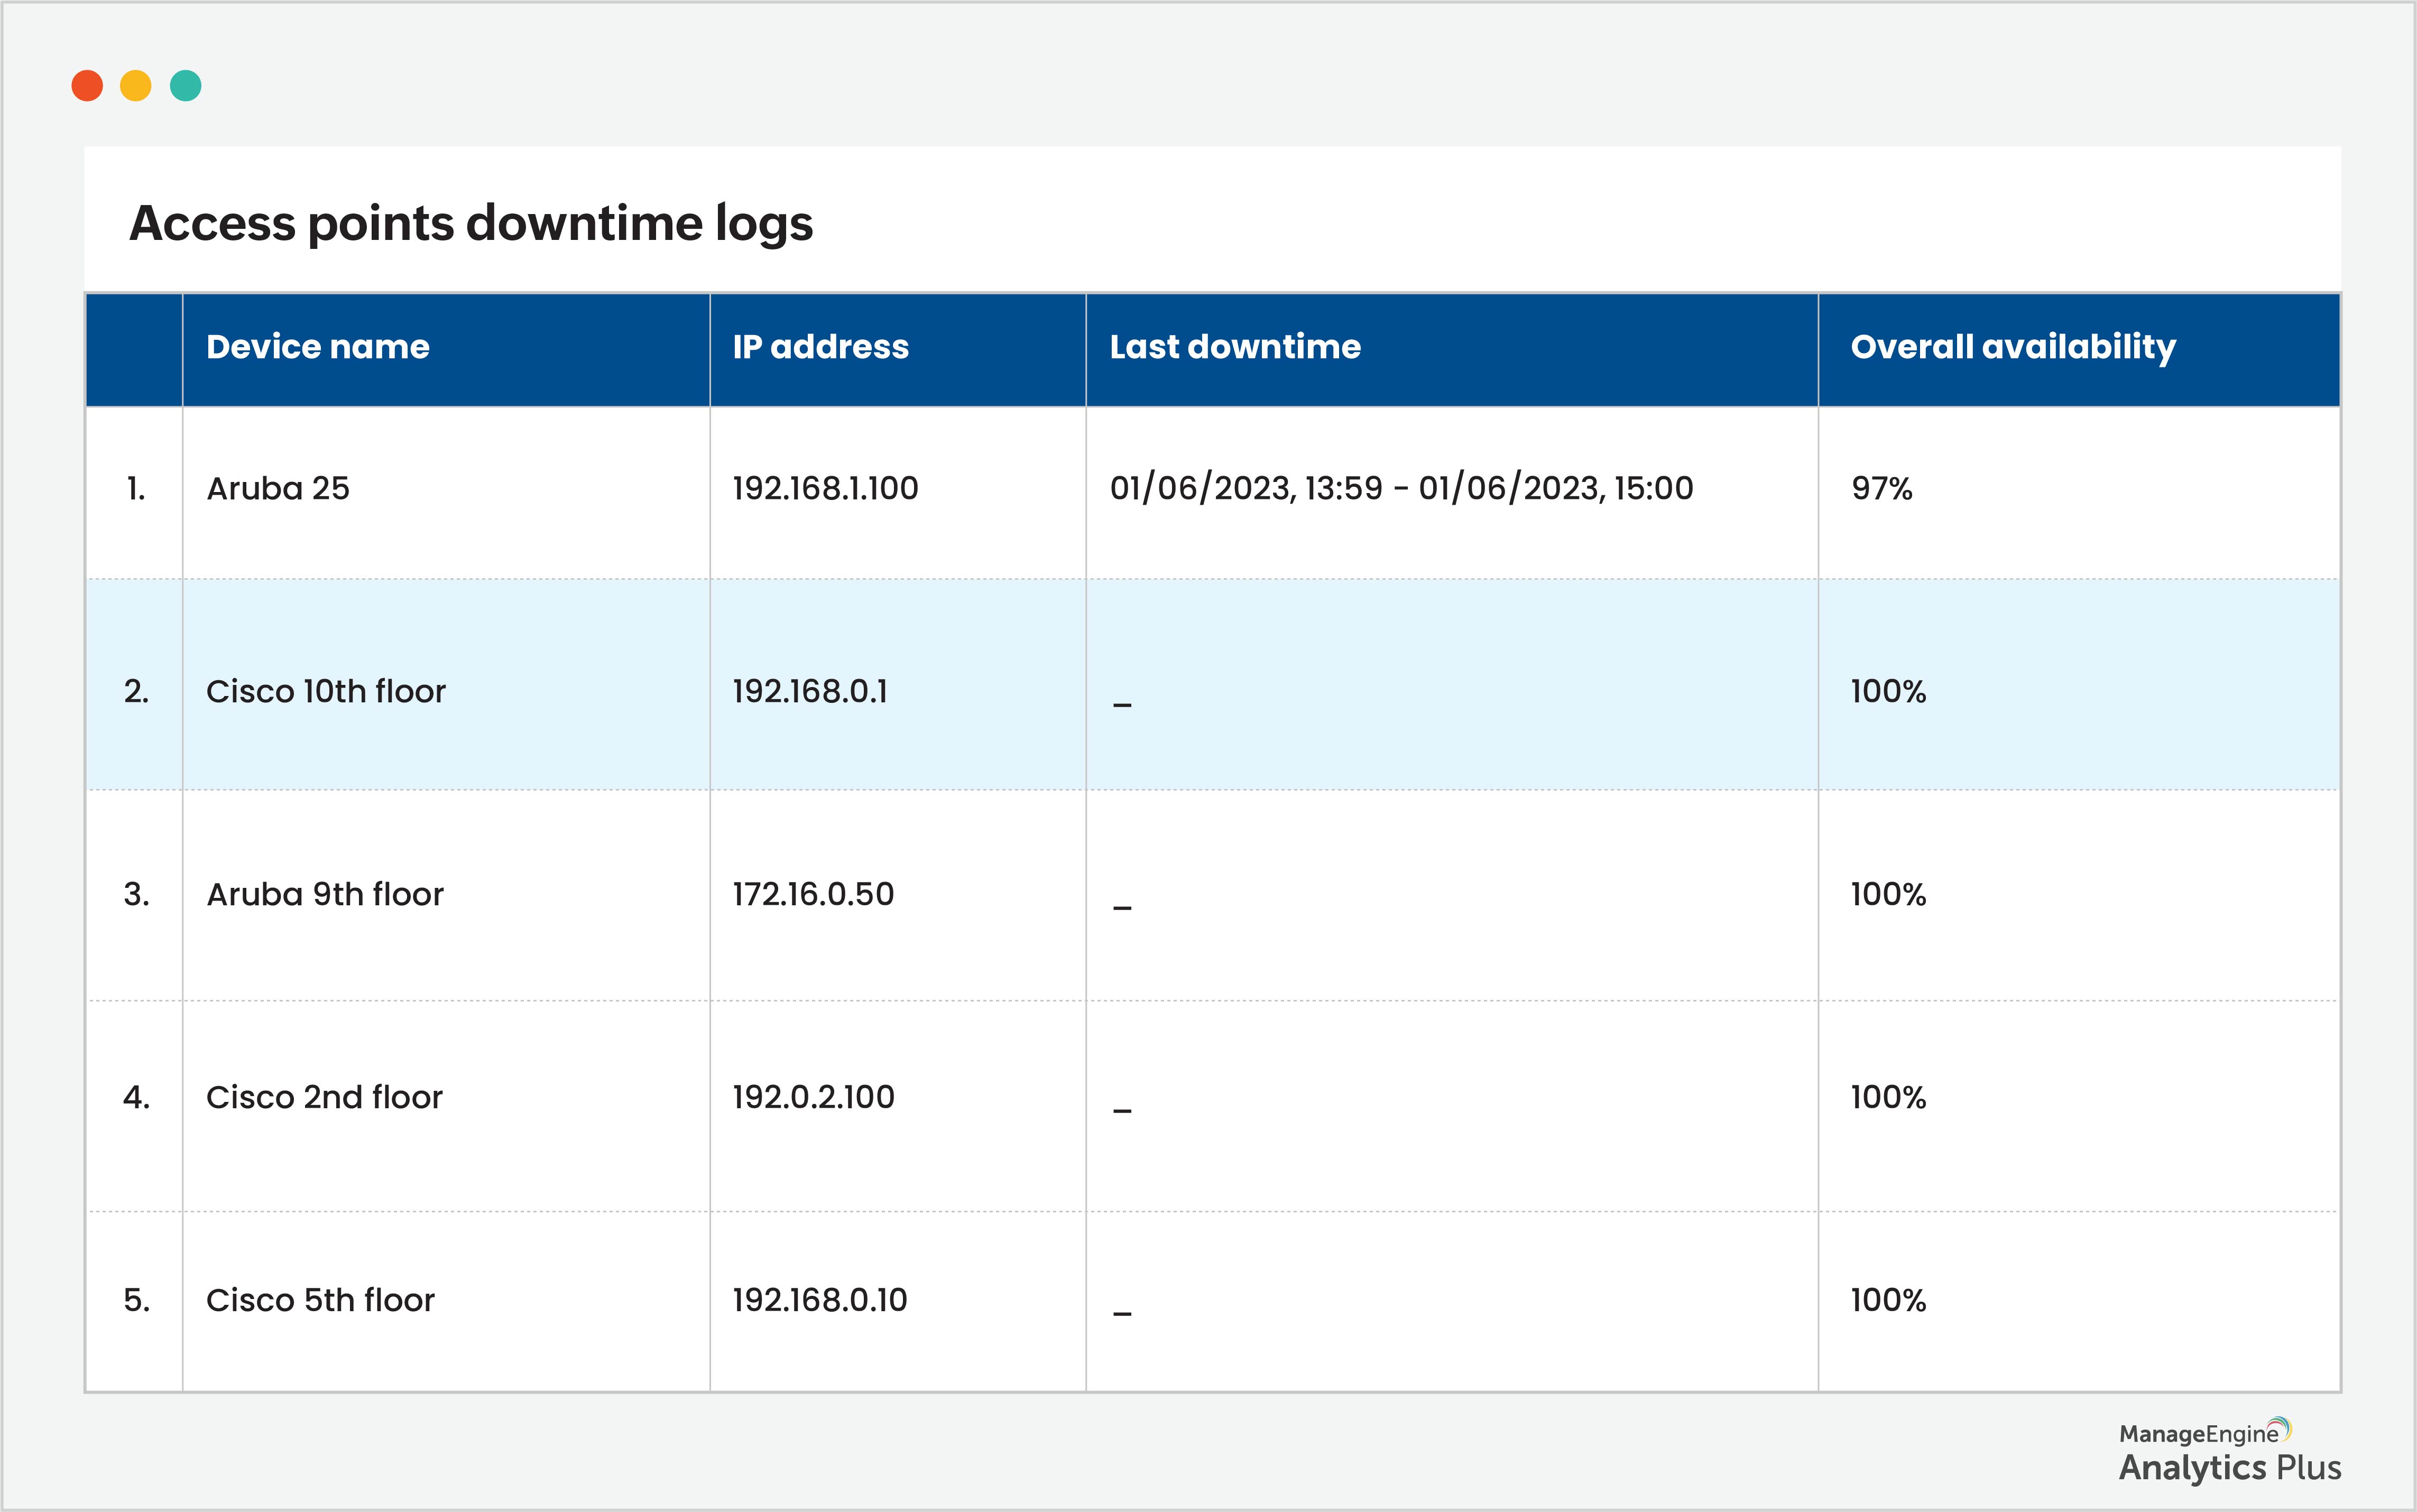
By identifying the root cause of these sudden ticket surges, you can effectively address the issue and reduce the workload burden on your help desk. Failing to do so will result in your technicians being consumed by troubleshooting network-related tickets while other critical tickets remain unattended in the queue and the MTTR skyrockets.
Tip: You can also stay ahead of such ticket surges by leveraging unified analytics and events, as well as alarm logs that provide a historical record of network events and associated timestamps.
2. Gain complete visibility into your organization's assets
Over time, a lack of visibility into an organization's assets directly impacts the MTTR. The longer it takes to identify a problem due to a lack of visibility, the more expensive it becomes to address it. Hence, a 360-degree view of all your assets plays a critical role in identifying problems and achieving smooth and timely resolutions. Better resolutions lead to satisfied and productive end-users and improved operational uptime. On the other hand, sudden and significant spikes in workload disrupt this visibility, resulting in delays in the problem identification and resolution process, which leads to dissatisfied end users, decreased productivity, and a diminished contribution to revenue generation.
Here's a scenario: Your help desk gets flooded with constant laptop-related tickets. Despite your repeated attempts to identify and resolve the issue, it persists. This could be due to several reasons like low battery life, hardware failure, asset aging, or overheating. While hard to pinpoint the actual reason, the possibility that it could be due to hardware aging is high. As assets age, they can encounter various issues due to hardware deterioration and software compatibility challenges. Components such as batteries, hard drives, and fans may degrade over time, leading to performance issues and potential system failures. The following report shows the laptops' age-associated incoming tickets in the last 6 months (the age of the laptop is the time between the purchase date and the ticket raised date):
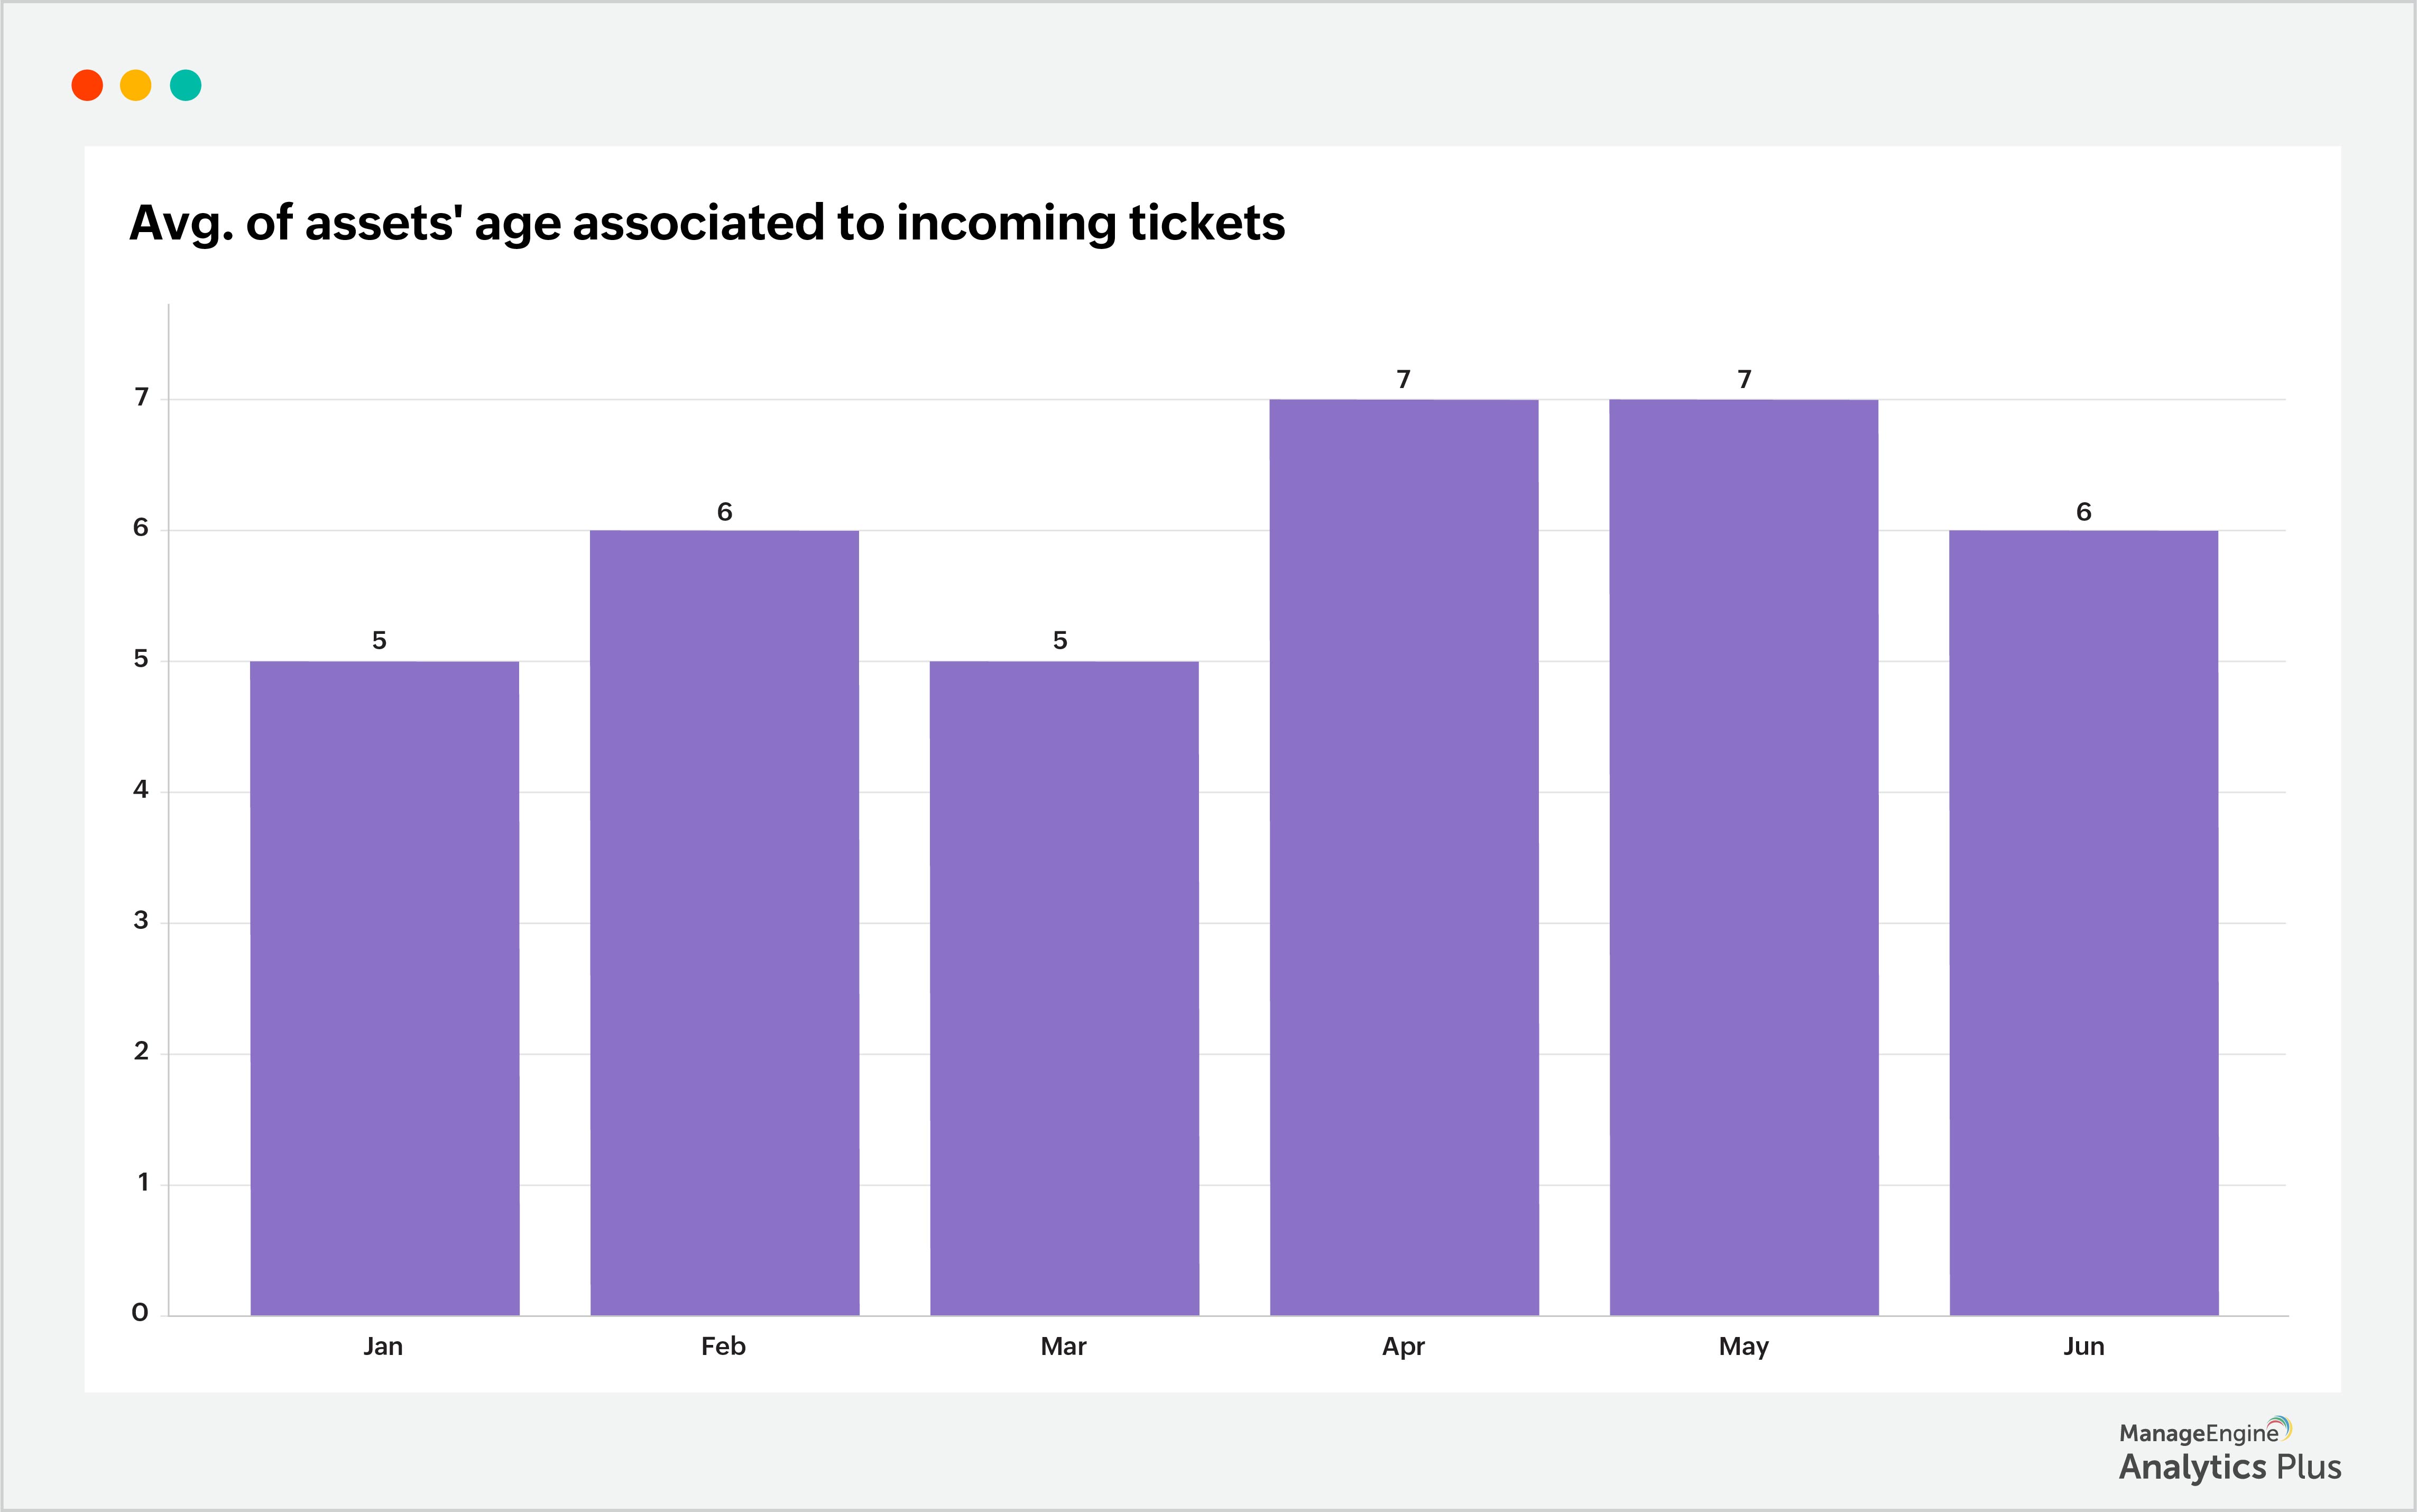
The report shows the monthly average age of laptops experiencing issues, which ranges from 5 to 7 years. This insight reveals that the age of laptops has played a role in the escalating number of laptop-related problems and subsequent ticket influx. Similarly, to investigate further, examine the average asset age within the organization. Here is a sample report that shows the average age of assets across the organization:
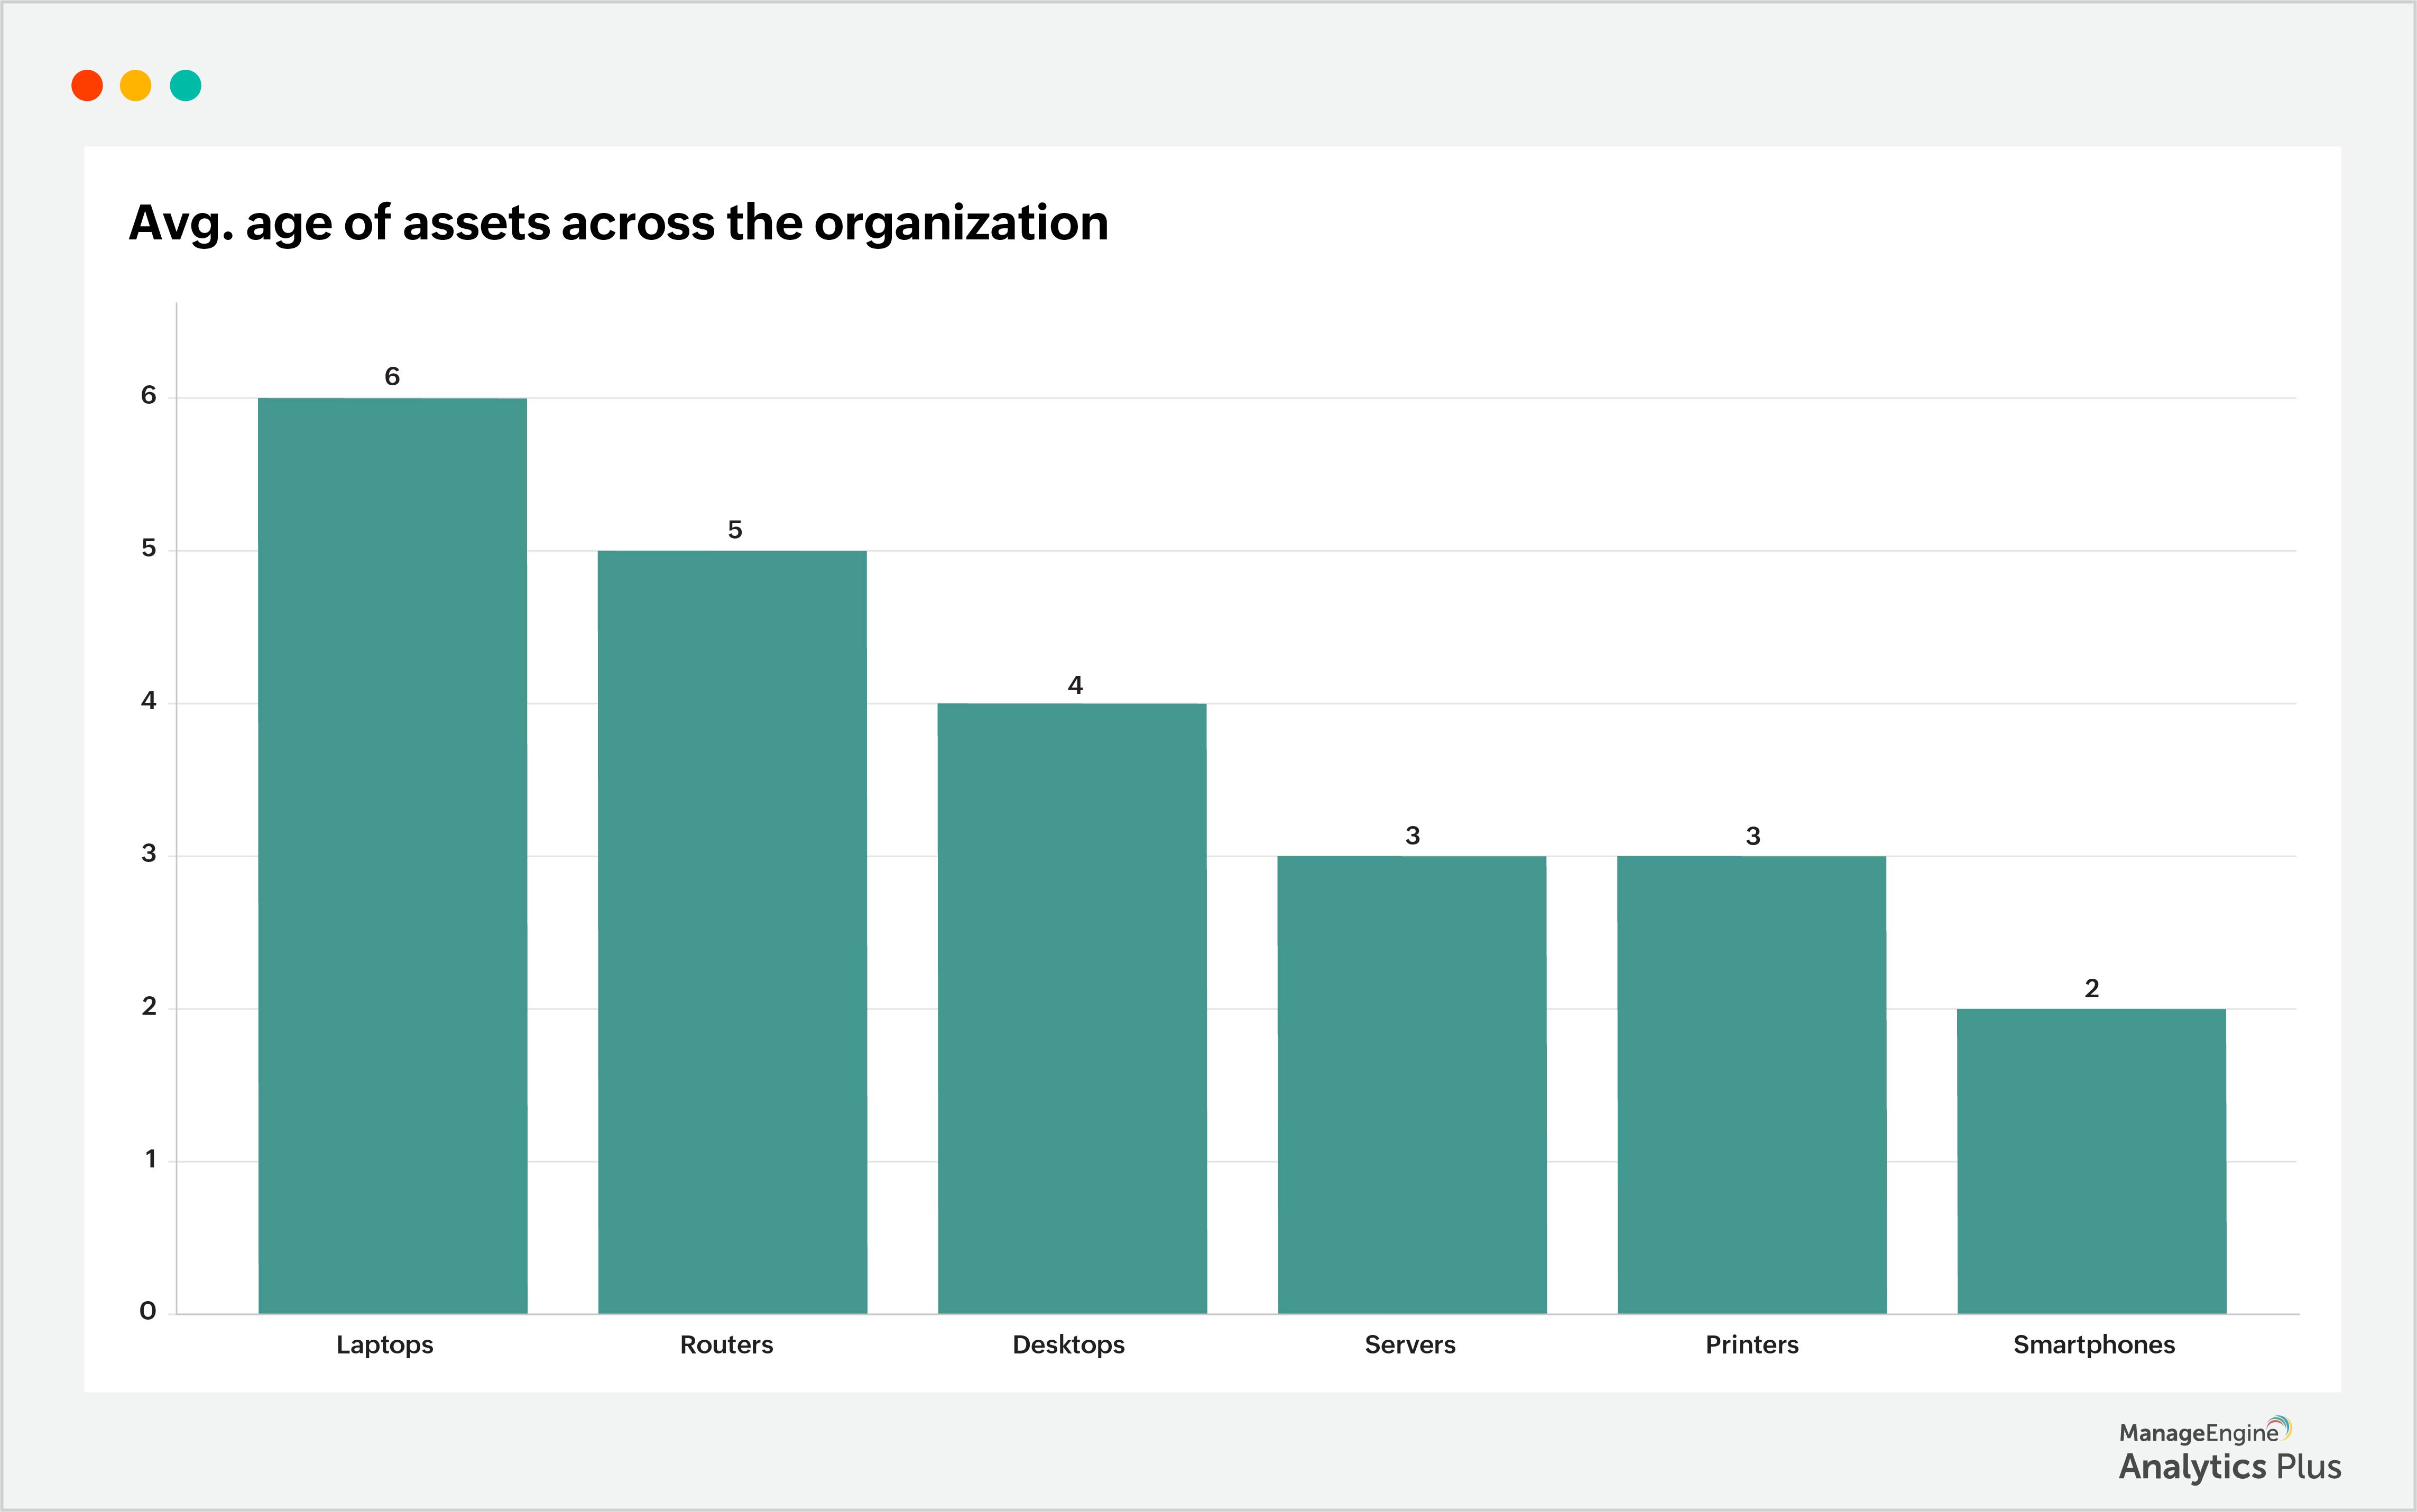
While servers and desktops have an average age of 3 to 4 years, laptops and routers tend to have a higher average age of 5 to 7 years. As assets age, their vulnerability to problems increases. Therefore, it is critical to monitor assets actively and consider decommissioning them if necessary to maintain a reliable and efficient IT infrastructure.
3. Keep tabs on the changes in your organization
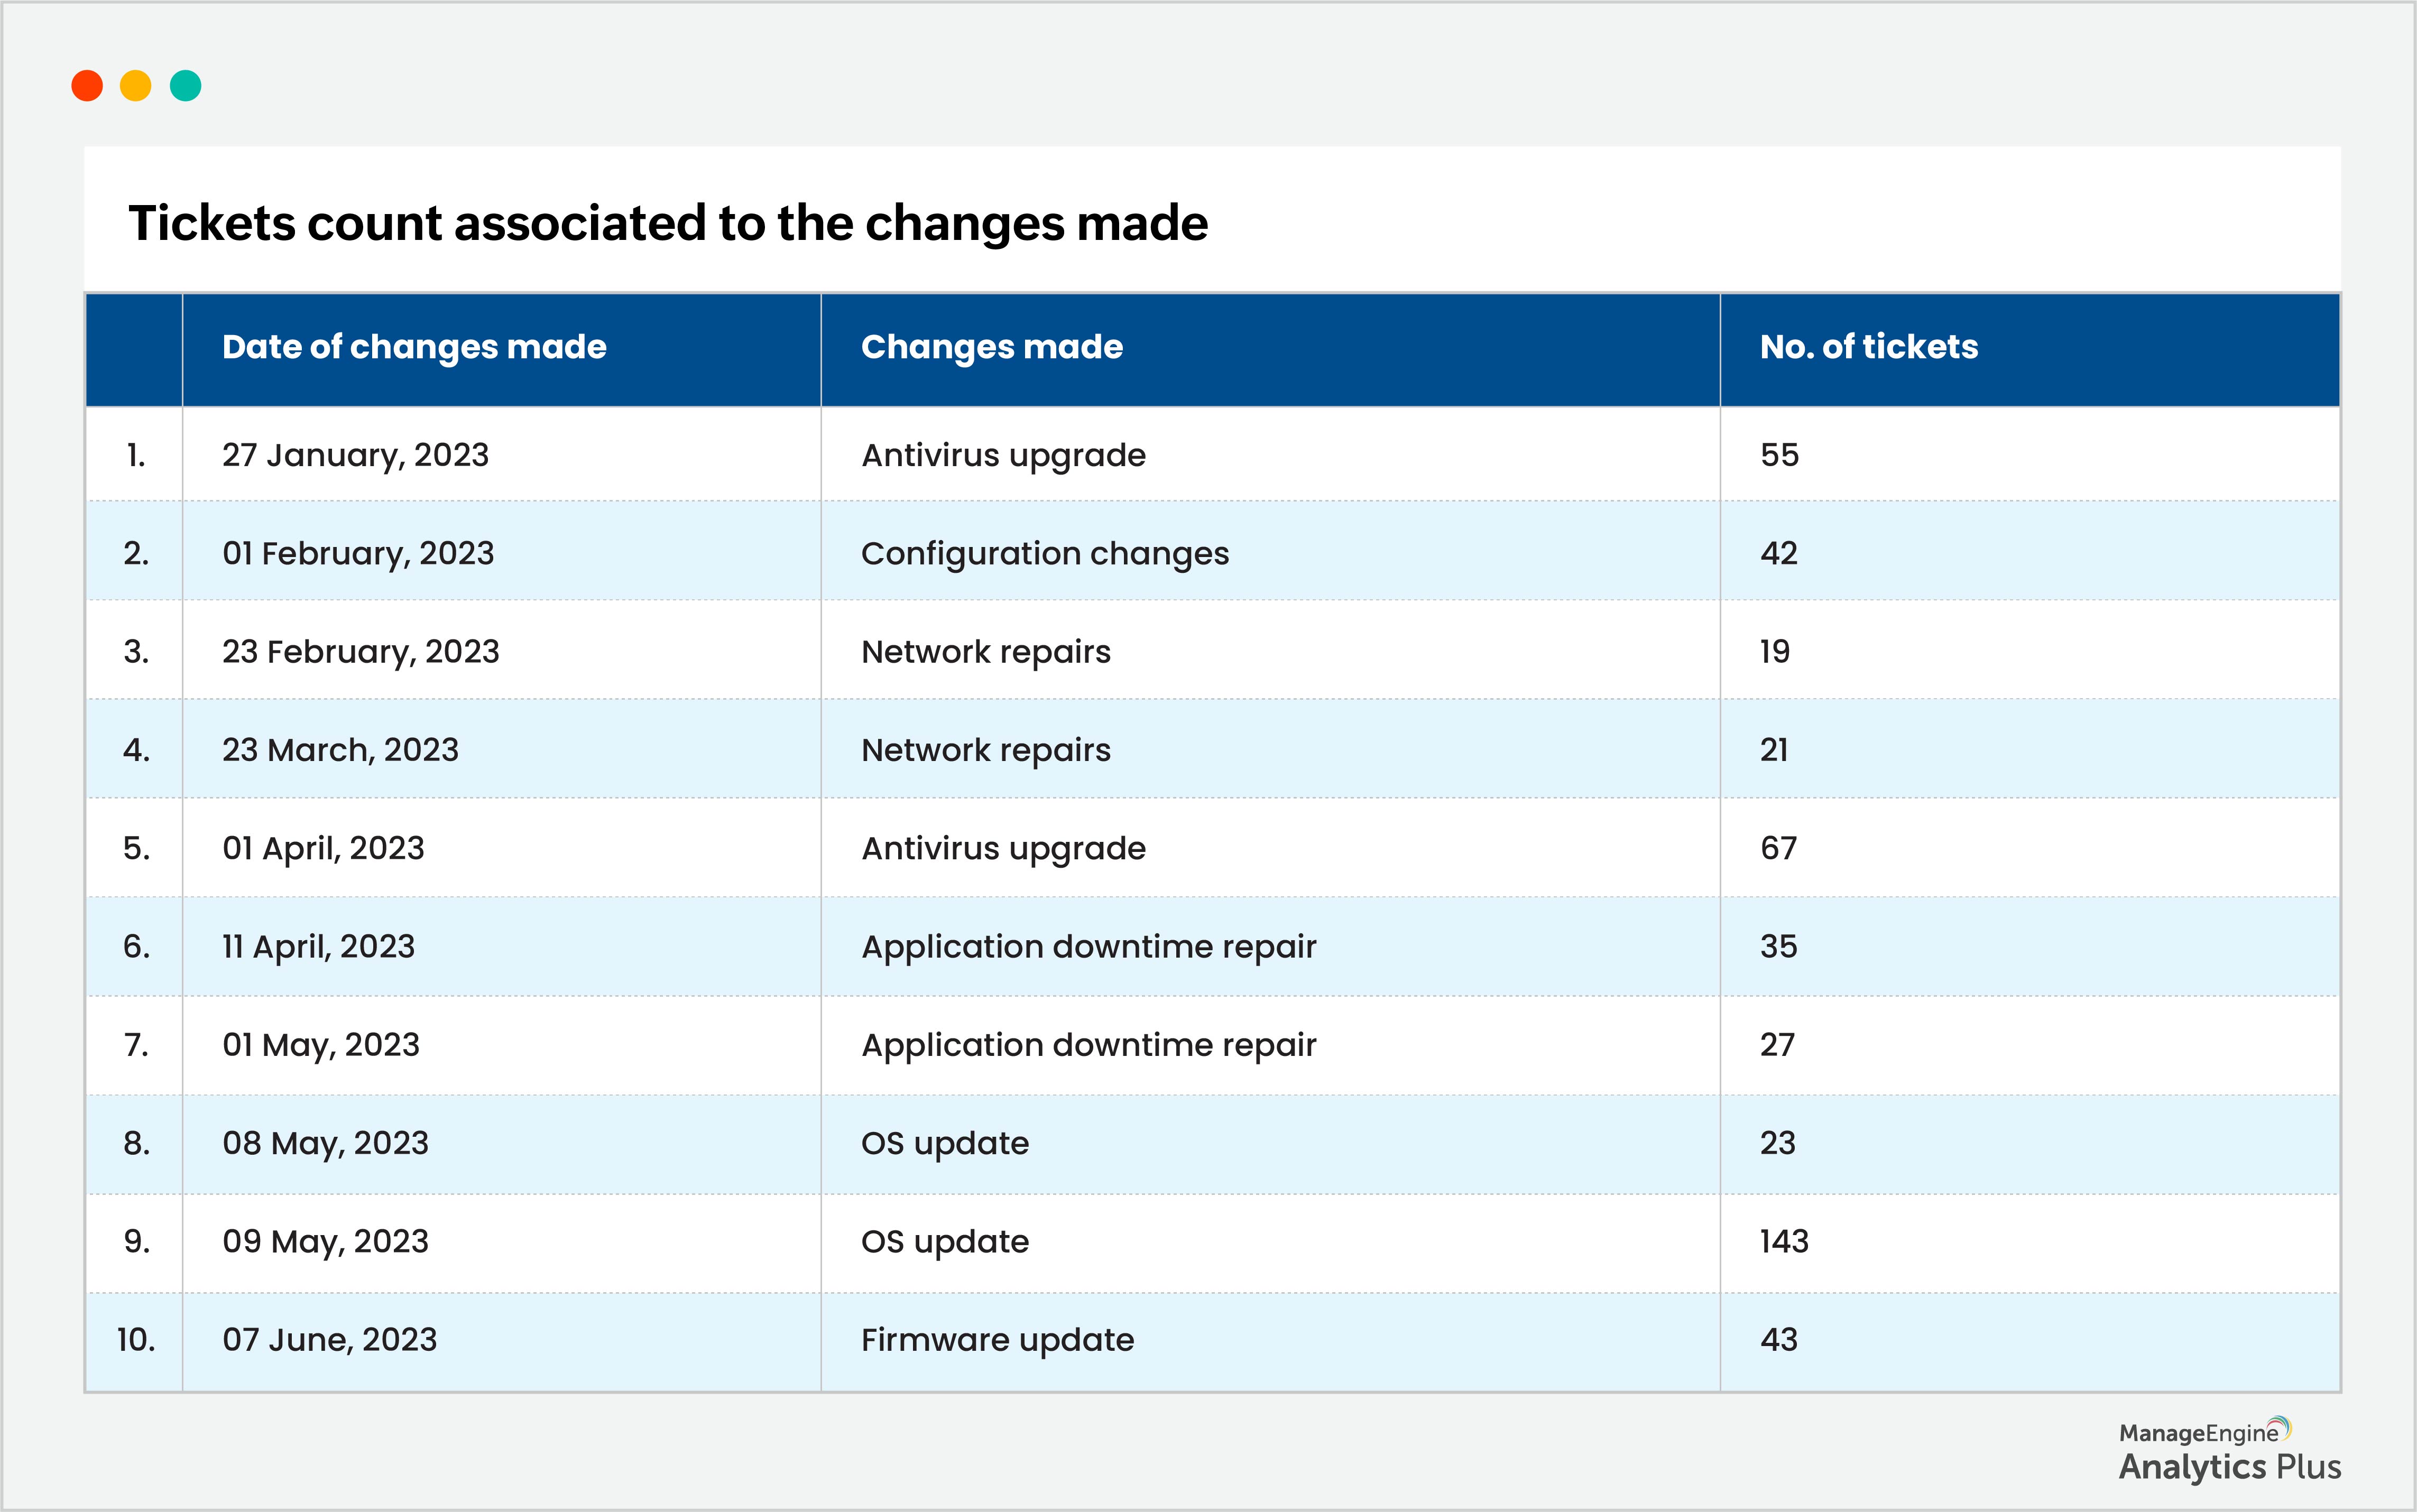
The IT help desk efficiently resolves a considerable number of tickets daily. However, when the volume of tickets suddenly surges, it overwhelms the technicians, leaving them perplexed and with limited time to resolve all the tickets and restore normal operations. Multiple factors contribute to this spike in tickets, and many times it can be traced back to changes within the IT ecosystem. For example, updates to the OS, patches, configuration changes, network repairs, application downtime, or the implementation of new technologies can all act as triggers for a flood of tickets. In such situations, unified analytics can provide valuable insights to technicians who scramble to identify the underlying cause of the incident that's causing ticket surge. By integrating data from change management and service desk applications, unified analytics enables the identification of correlations between specific changes and the resulting incidents they cause. Let's take a look at the sample report below:
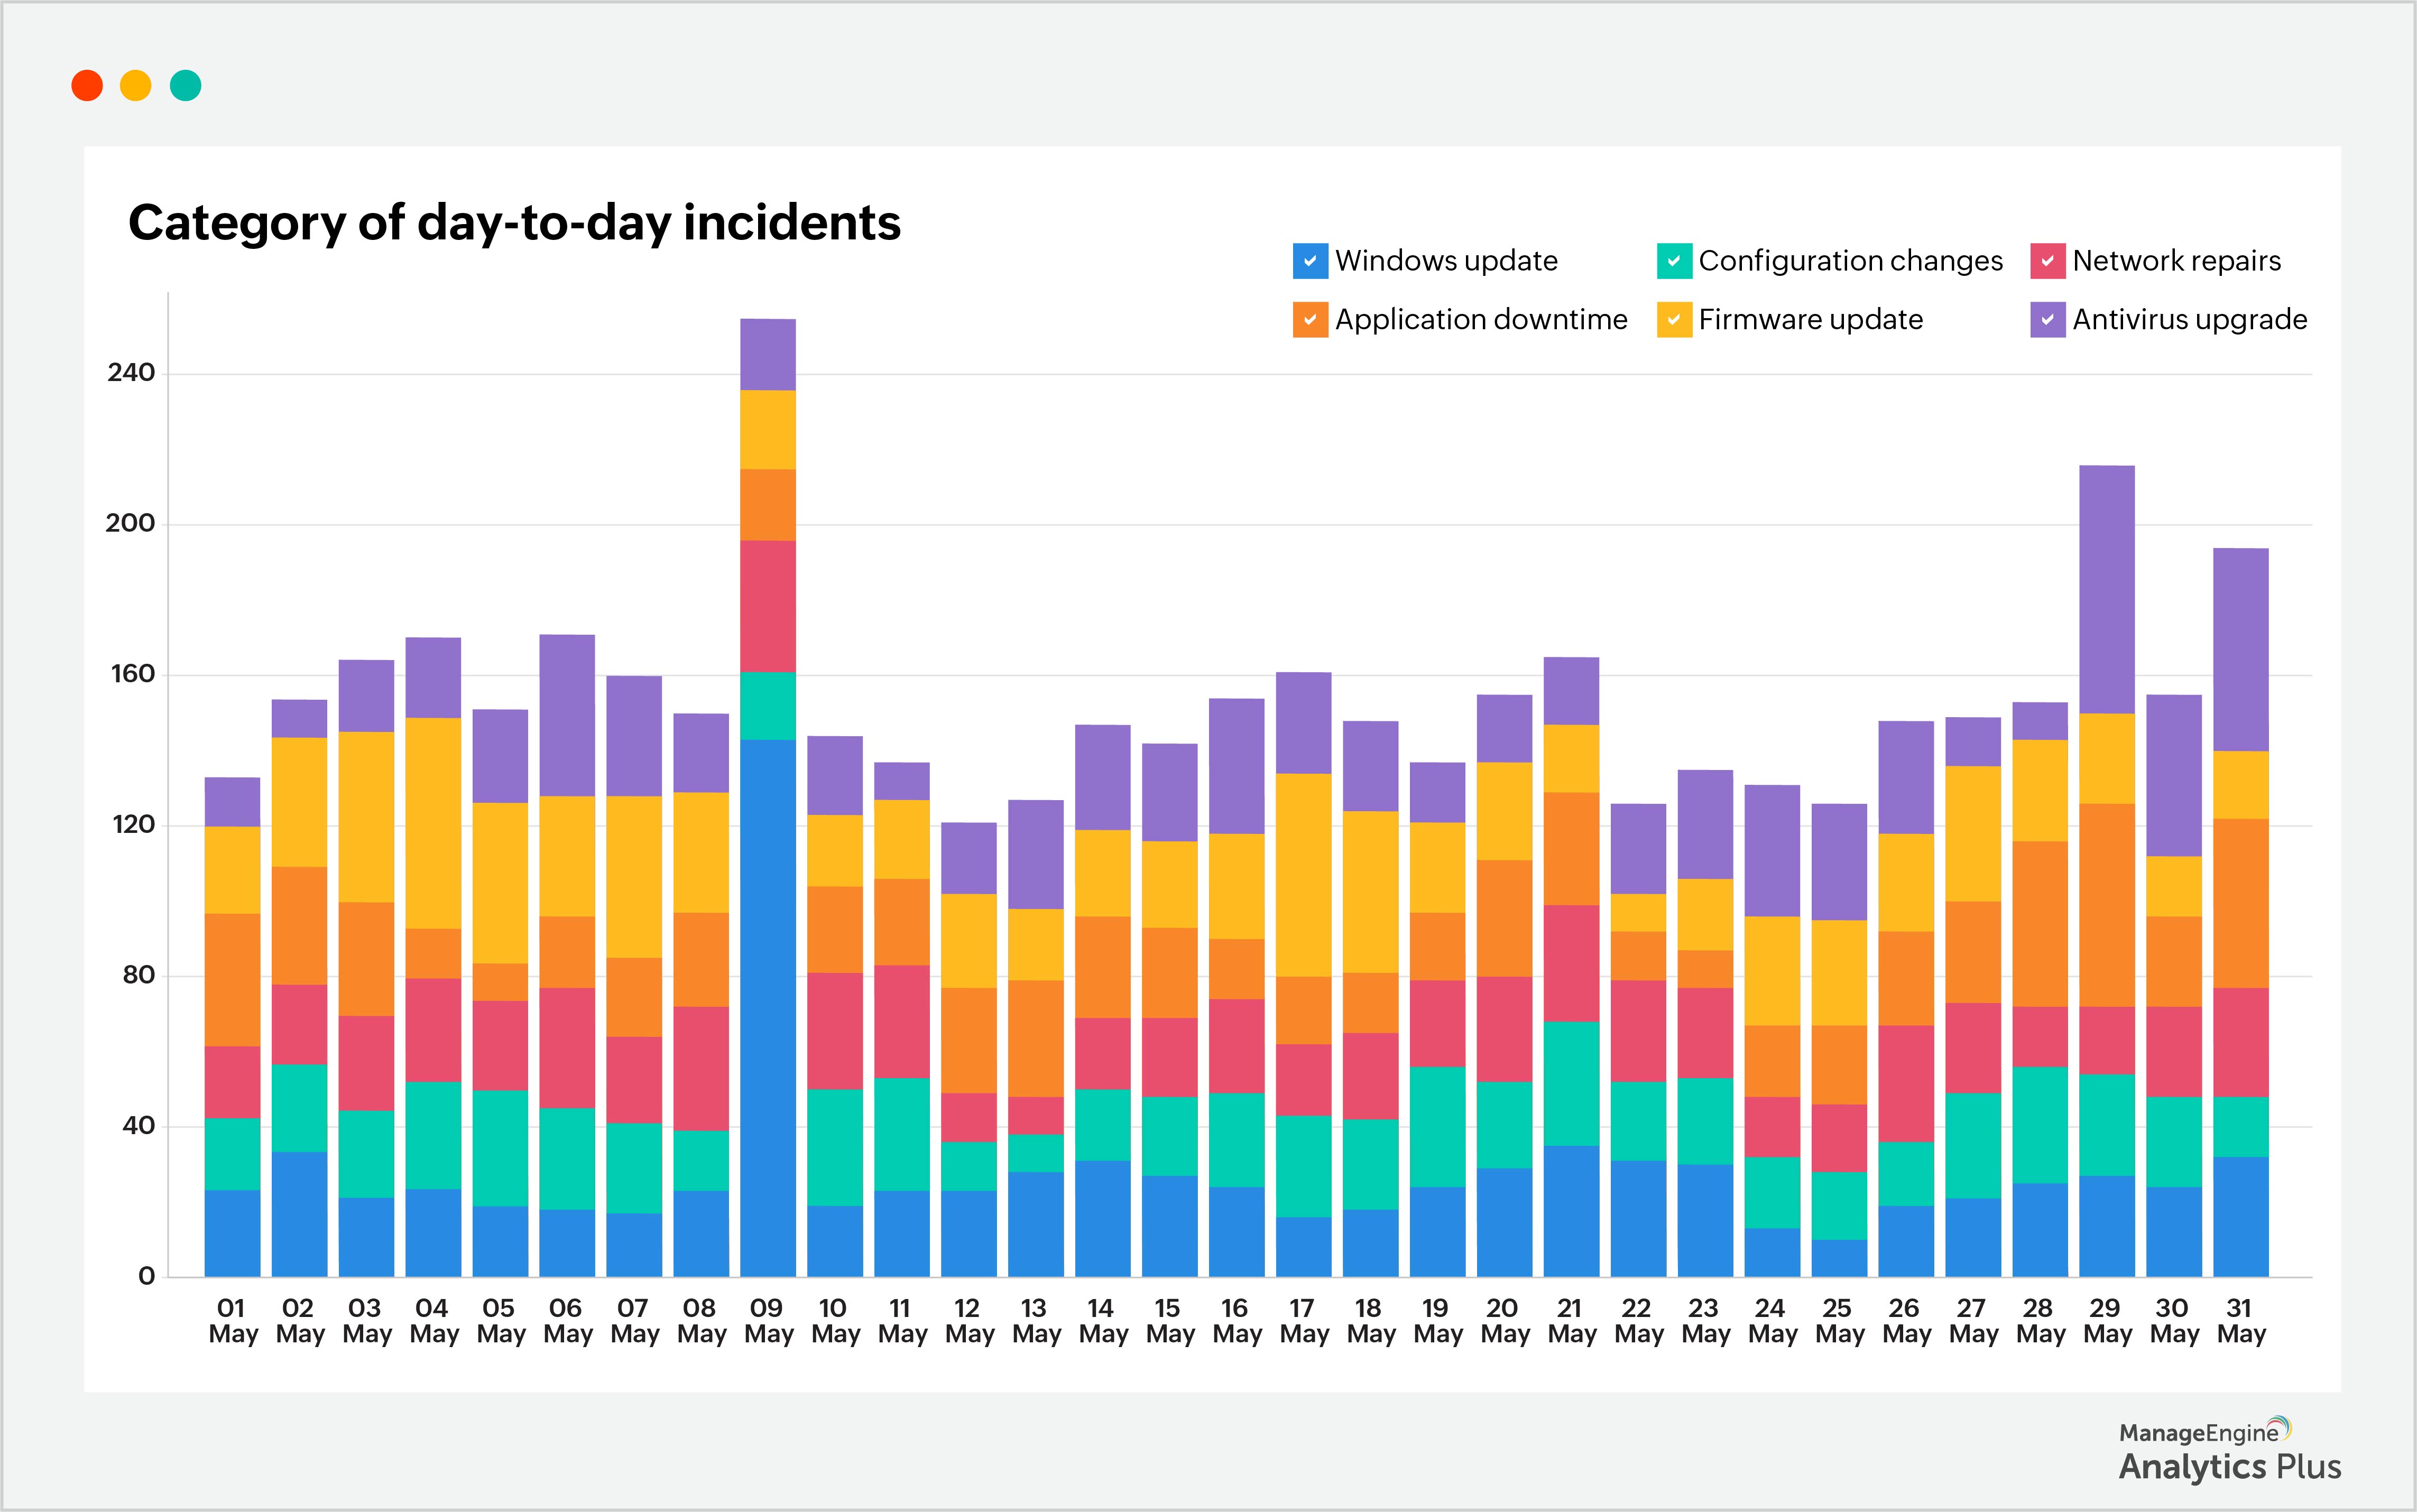
According to the report, there were significantly more tickets on 9th May. By integrating the data with information from the change management application, it has been determined that the surge in incidents can be attributed to a Windows update that was done on 8th, May. Another report illustrating the relationship is shown below:
While performing an OS upgrade or patch update typically doesn't lead to a sudden surge of incidents, following poor practices do. To mitigate the risk, it is advisable to follow best practices. Start by installing the new OS or patches on internal systems first, closely monitoring their performance and impact. Once you have ensured their stability, proceed with applying the updates to the remaining systems. By adopting this approach, you can significantly reduce the likelihood of experiencing spikes in incidents and maintain a smoother transition during the update process.
Conclusion
Unified analytics can play a critical role in reducing MTTR within an organization. By bringing together multiple IT sub-domains and integrating and correlating data sources, it transcends the limited scope of focusing solely on the peak issue environment. This holistic approach empowers users to access contextual information about the problem, enabling them to trace issues' origins back to hard-to-notice changes. This level of visibility uncovers crucial insights that would otherwise remain hidden, enabling more efficient and effective problem-resolution processes.
These reports were created with Analytics Plus, ManageEngine's IT analytics platform. Try Analytics Plus for free today.
Do you want to know more about analytics for IT operations? Talk to our experts to discover all the ways you can benefit from deploying analytics in your IT.