- HOME
- Endpoint Management Analytics
- Leverage user behavior analysis to uncover insider threats
Leverage user behavior analysis to uncover insider threats
- Last Updated: July 1, 2024
- 544 Views
- 4 Min Read
Most organizations enforce strict policies about maintaining vigilance on external threats to their systems, but insiders stealing information for monetary gain has become rampant nonetheless. Last year, American multinational conglomerate General Electric found itself in a fix because it was frequently losing bids and proposals to a budding competitor. An investigation revealed that a former employee established a new organization after stealing trade secrets from the organization.
Key data was stolen from advanced computers used for calibrating turbines. It was discovered later that the former employee pilfered critical marketing and product information and implemented these same strategies in his venture.
By the time this intellectual property theft was detected by General Electric and prompt legal action was taken, the organization had already lost several bids on turbine calibration. This case is a consequential example of why enterprises need to be aware of the permissions given to employees who have access to critical data.
According to a 2021 report from Cybersecurity Insiders, 57% of organizations reported an increase in insider threats compared to the previous year. As this menace looms large for IT leaders, let us examine the ways to identify and detect malicious insider activity using end-to-end security analytics.
Track regular user patterns and behaviors
Insider activity can be detected by monitoring user behavior and watching for anomalies in logon patterns. Insiders with malicious intent often logon to accounts or devices past regular work hours, from different geographical locations or devices—all of which are anomalous behavioral patterns that can be tracked easily. Here's how you can track and analyze changes in logon patterns.
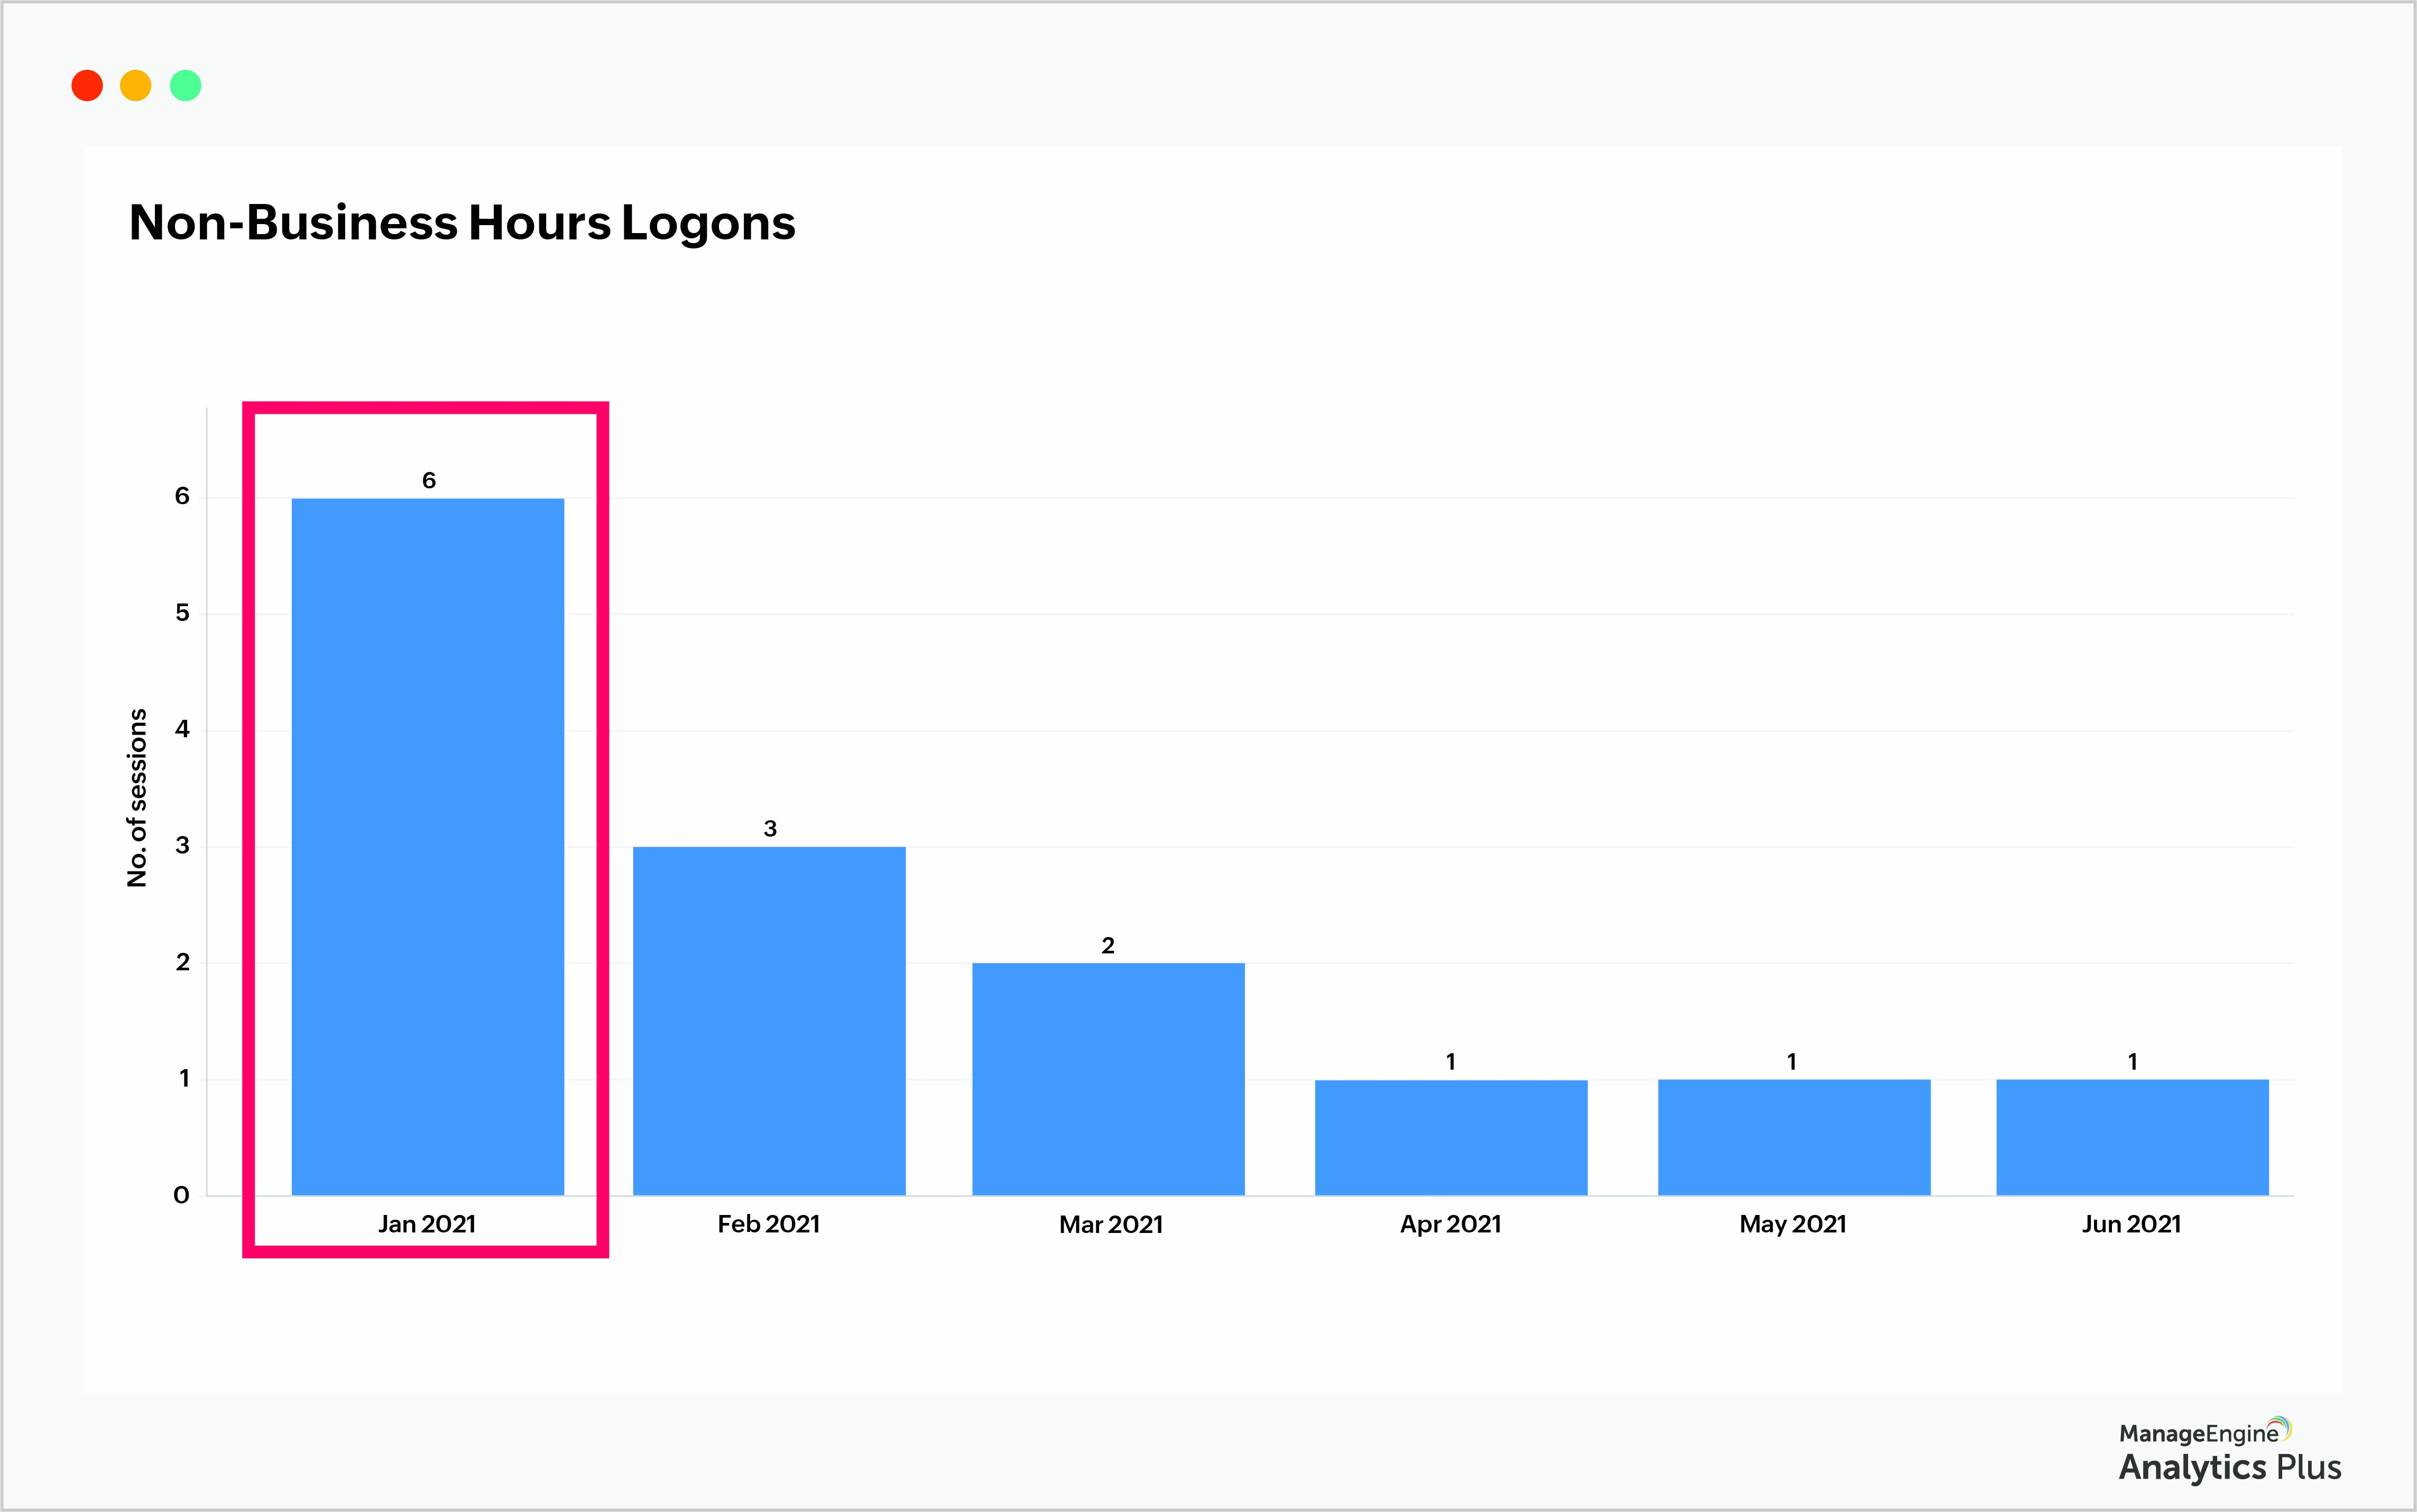
The report displays the number of users who logged onto the systems during non-business hours. The number of sessions in January was the highest, which warrants further investigation.
Not all non-business hour logons are an indication of malicious intent, however. It could be because users logged in early to compensate for lost work hours or to extend their work hours. However, from a security standpoint, it's essential to keep track of all anomalies.
Track data passing through the network
Malicious insiders who intend to steal information, don't accomplish it in one session. They often pilfer data in small, almost indistinguishable spurts. Analyzing in-and-out traffic from a security perspective can be a daunting task due to the sheer volume of data that is available for analysis. Cutting past the noisy data can help spot anomalies. A useful approach to accomplish this quickly is to analyze traffic data by department. Due to the varying nature of the work involved in each business unit, the usage pattern can be quite different from one department to the other. Analyzing in-and-out data for each department individually can help identify anomalies quickly.
The report below shows the in-and-out traffic for users of the Administration department. Typically, admin teams will have less data traffic across a network when compared to other departments. From the report, a particular user (Sam-2575) has high in-and-out traffic compared to his colleagues. While there could be many reasons for this anomaly, further monitoring and investigating will help explain the reasons behind the use and flag undesired activity.
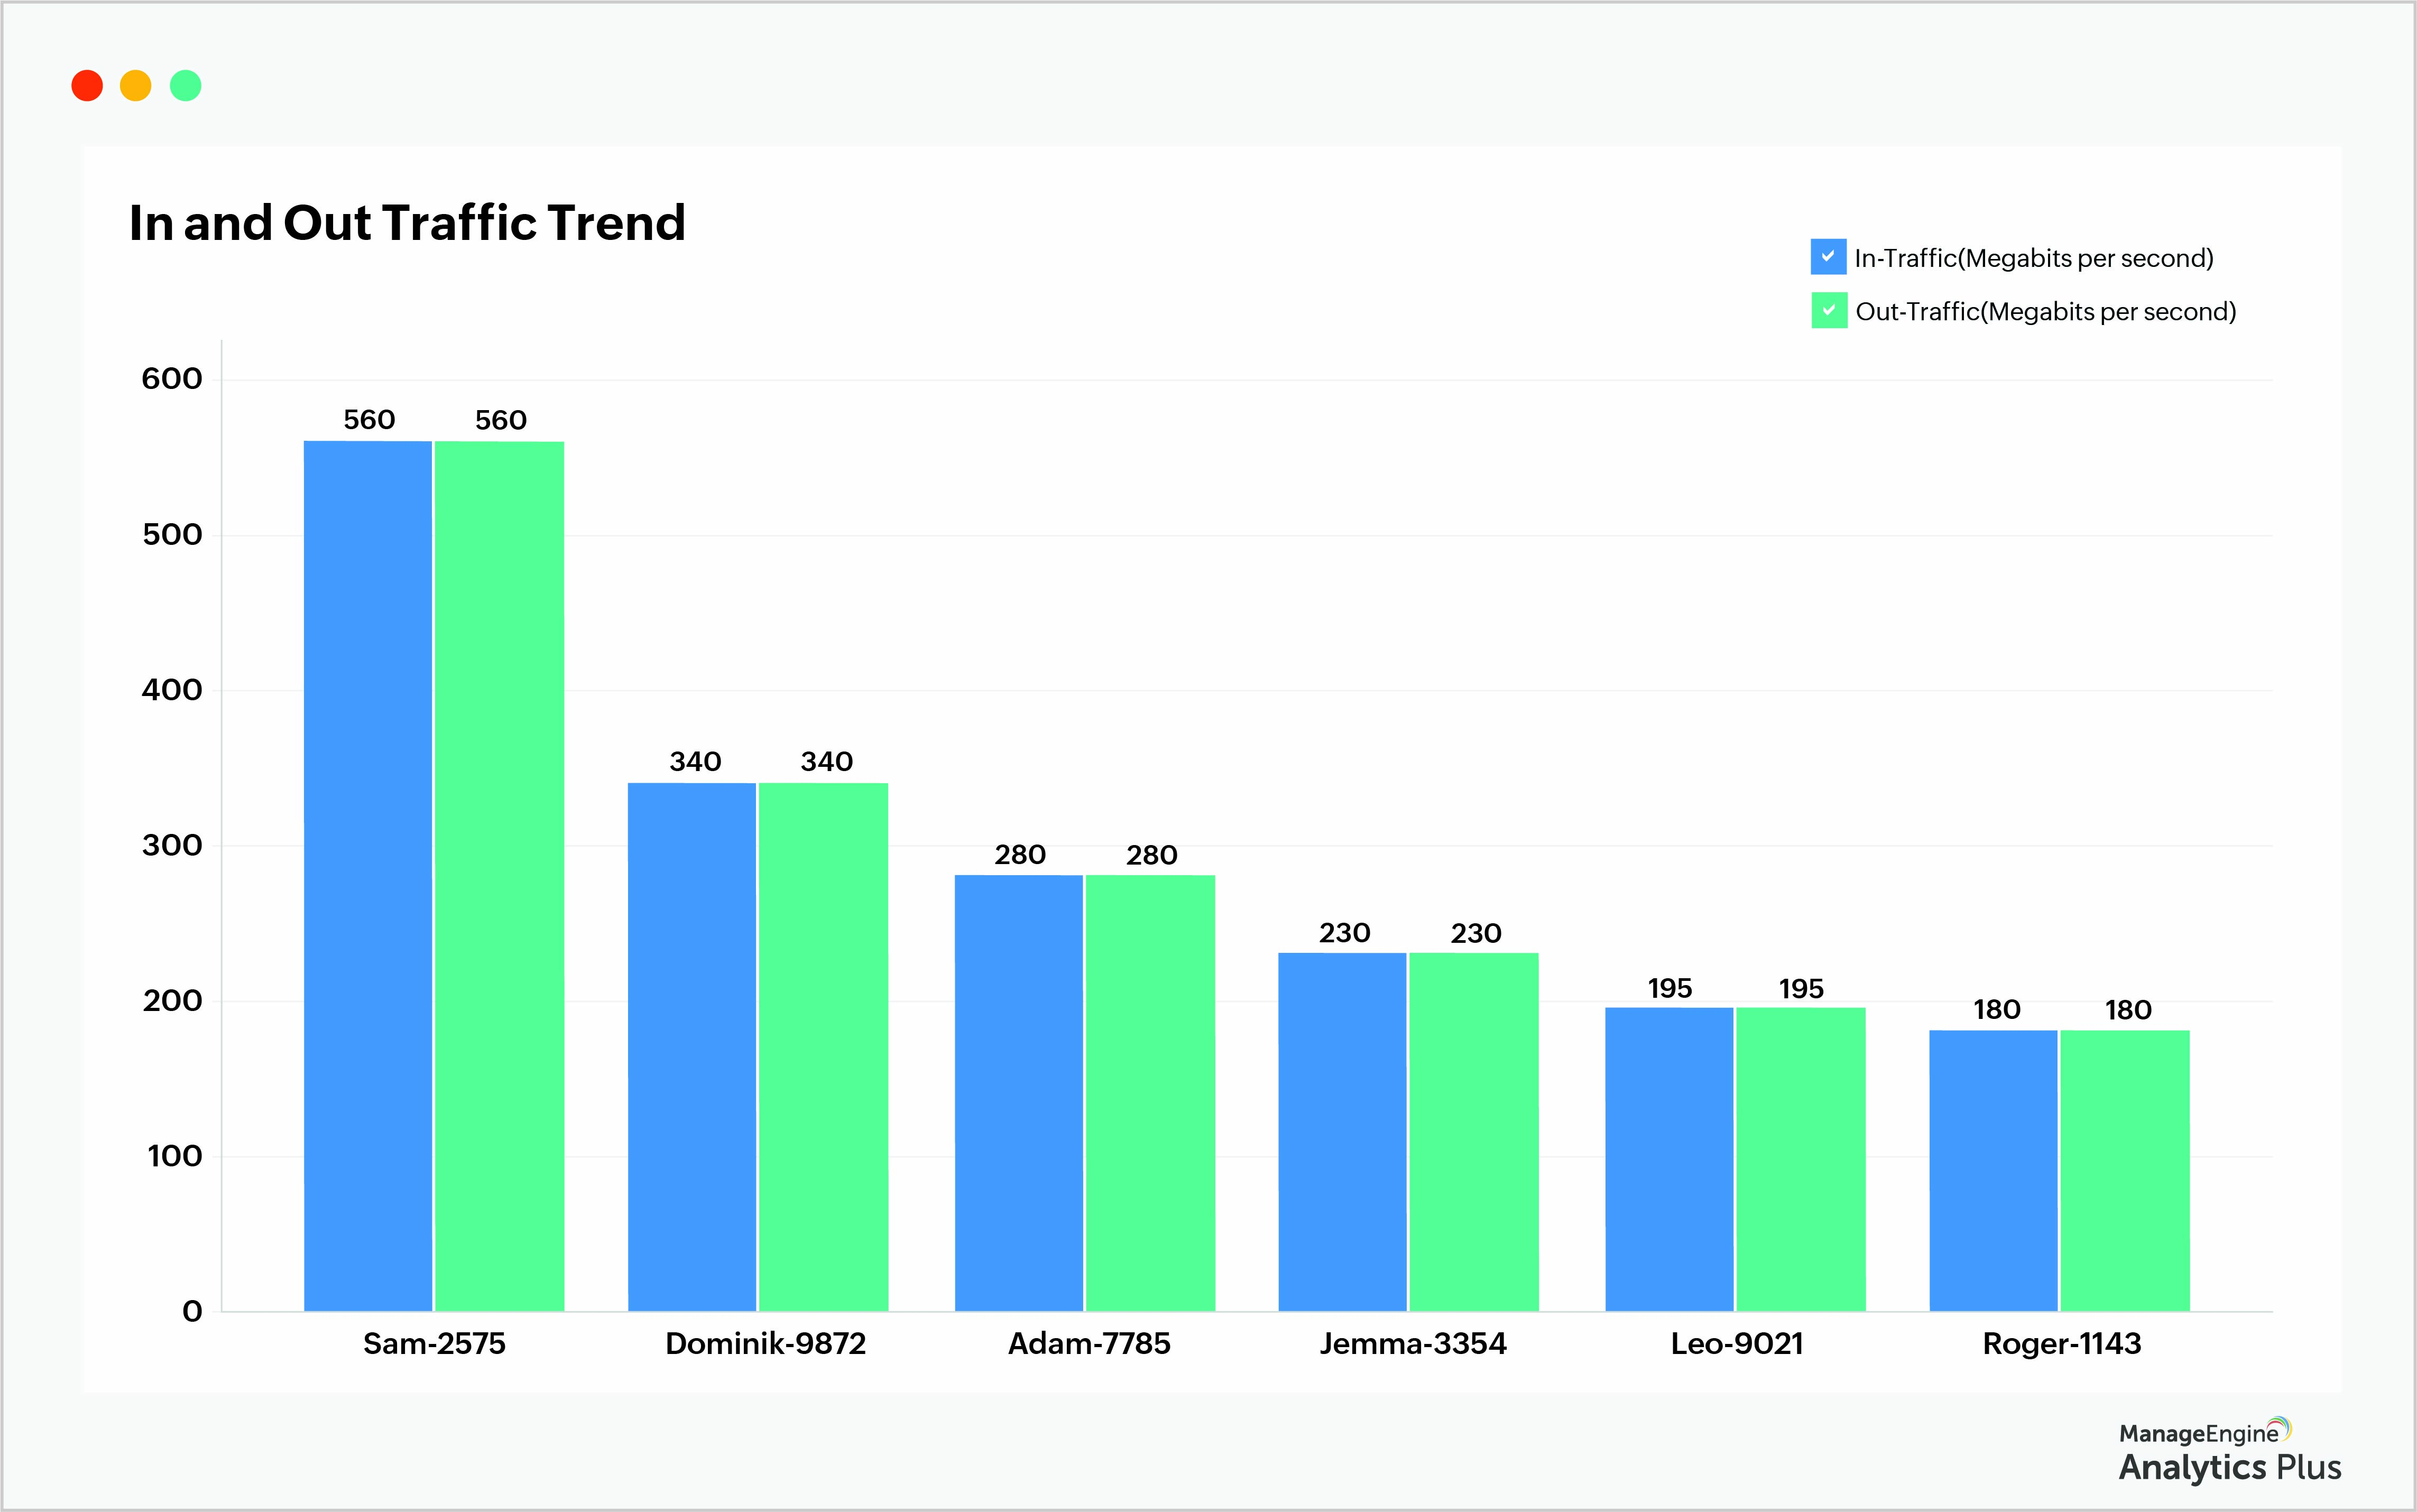
This report has been customized to analyze network traffic patterns for a specific team in an organization. This will help you establish team-level, and individual-level standards and anomalies.
Pay attention to application usage
In this day and age of hybrid work models, where a significant number of employees are connecting to the company's network remotely, it is essential to track the list of software applications present in the workstations of an employee to identify anomalies.
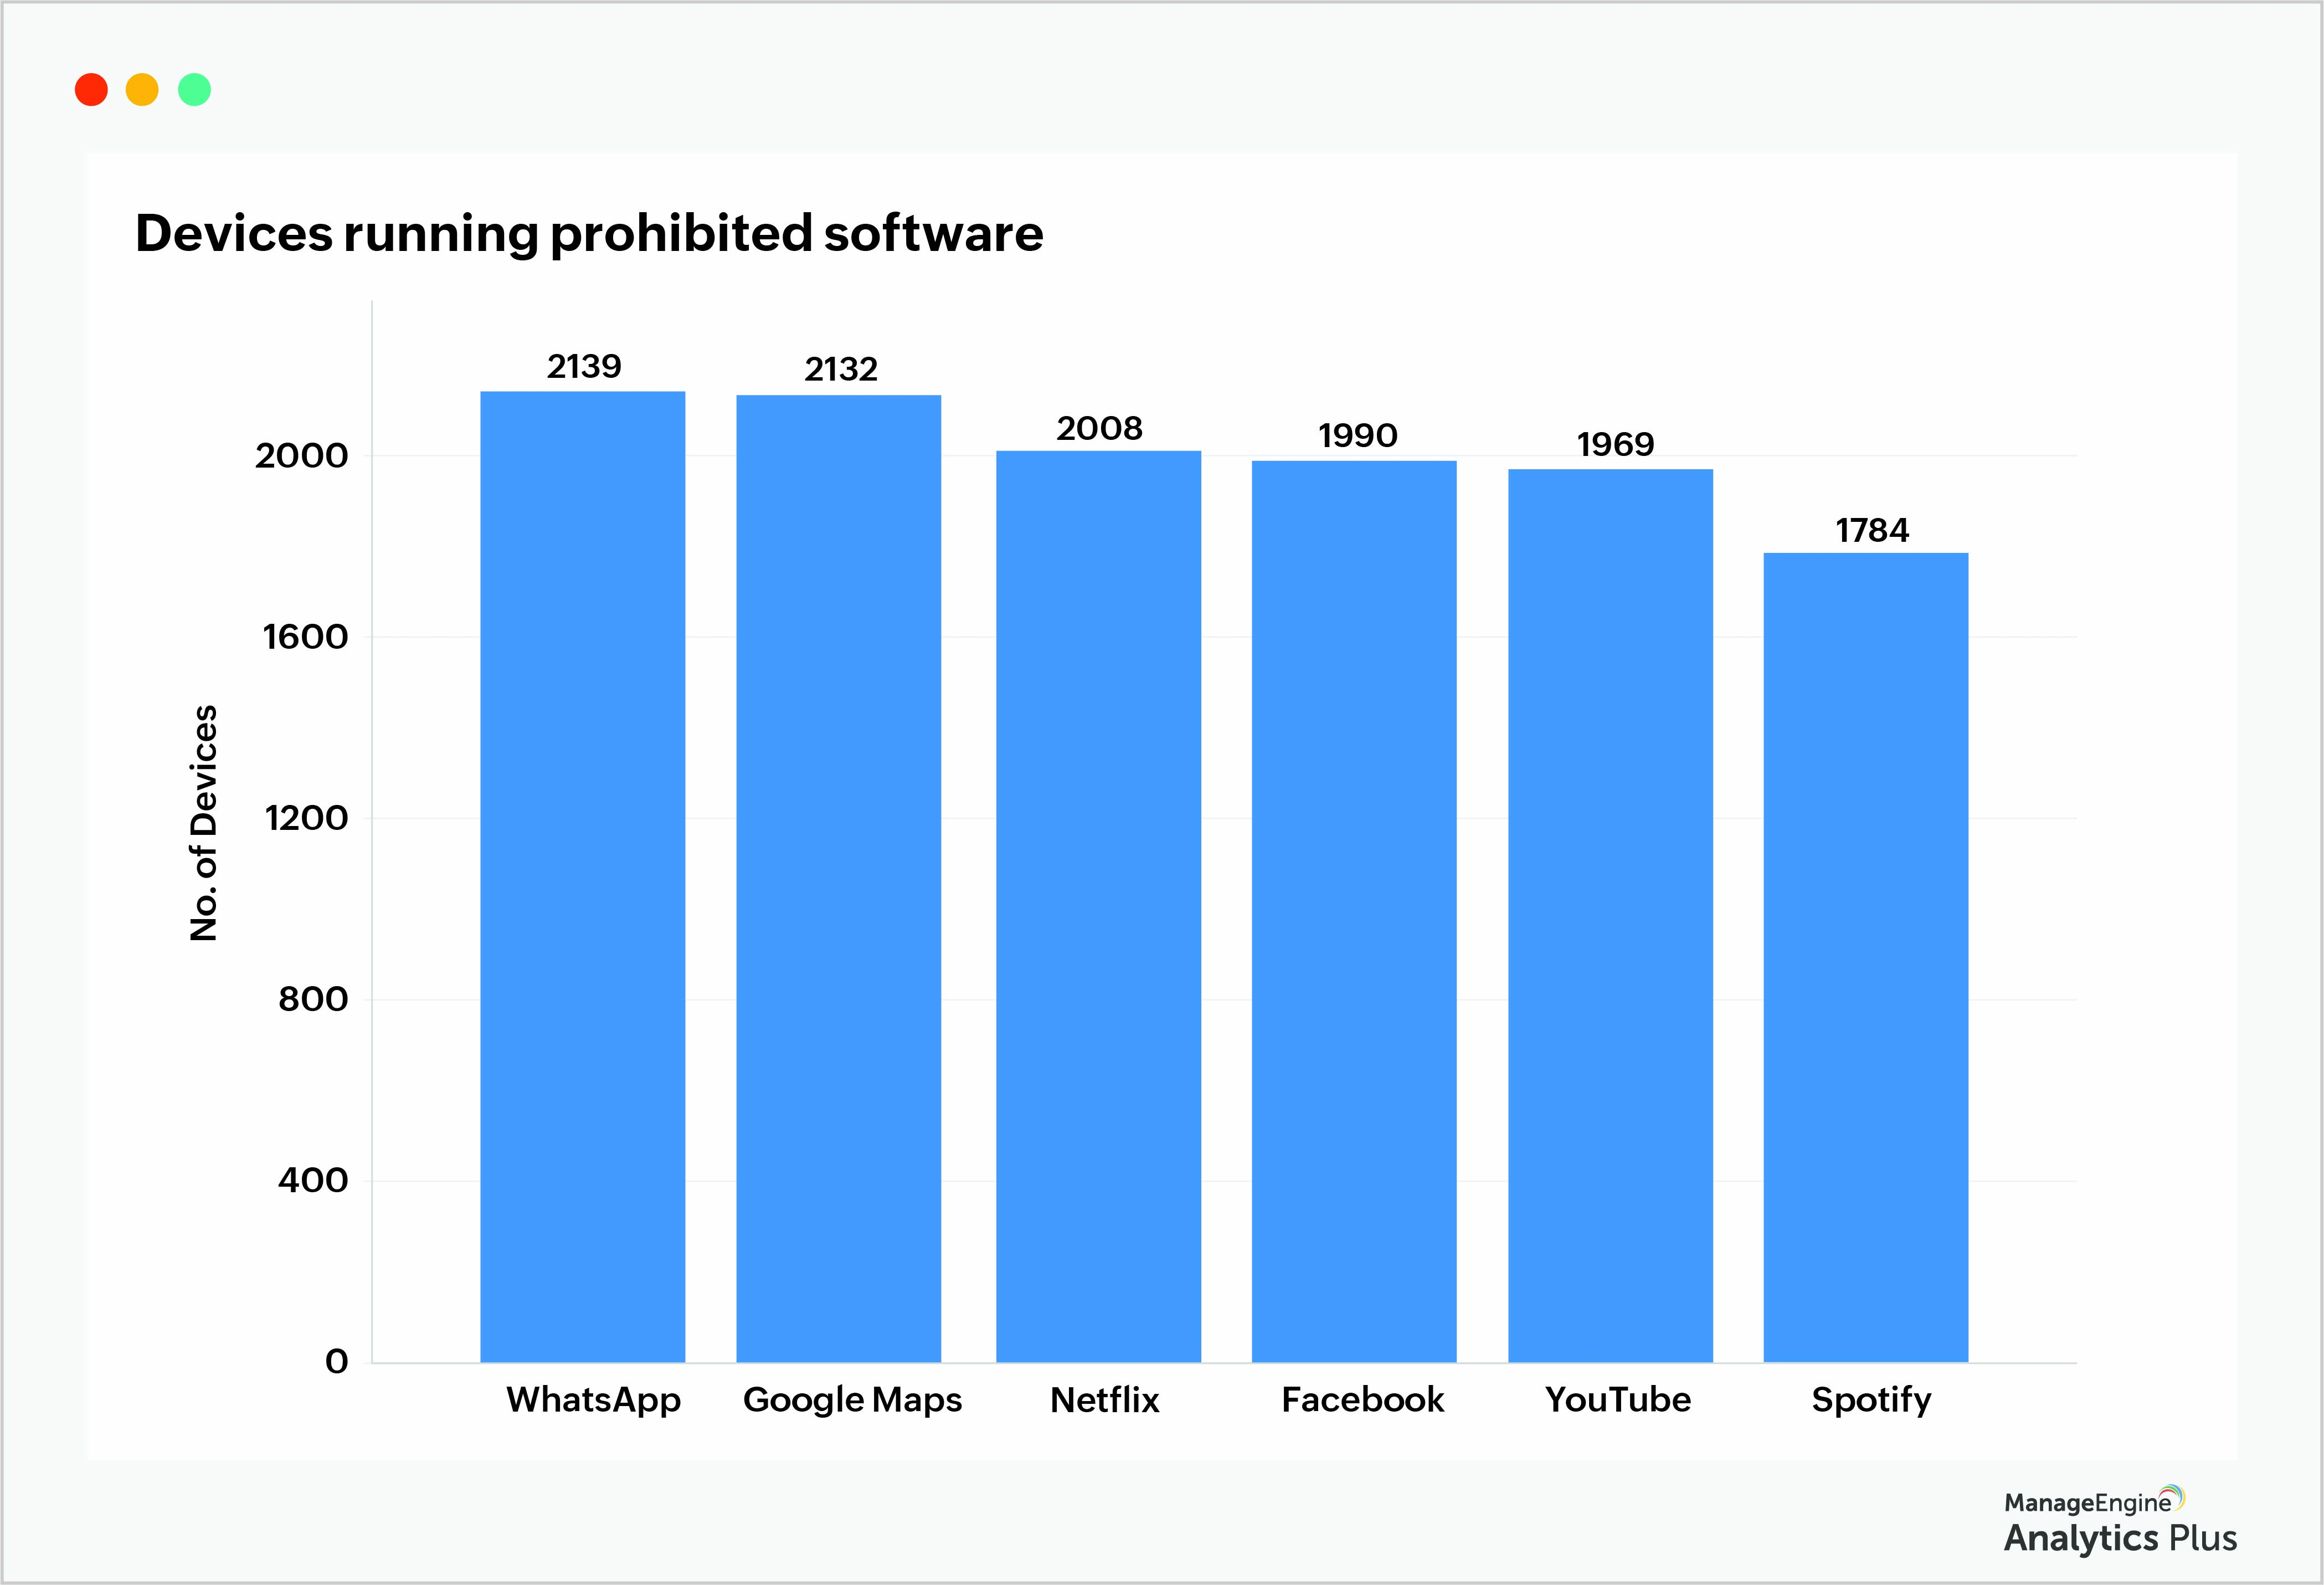
Often employees use personal devices for work, and corporate devices, such as mobile phones or tablets, for personal use. This often results in users installing a wide range of applications such as Netflix, Uber, Amazon, or Spotify, that might require different permissions for installing them. For instance, photo storing apps are known to ask for permission to make calls, while apps for cab booking ask for access to information stored in local files. While these may not be directly harmful, in a device that can connect directly to your organization's secure networks and systems, it's important to track how many prohibited apps are running periodically. Further, you need to ensure the number of blacklisted or prohibited apps in employee devices don't exceed the organization's threshold, the accepted limit that indicates when the respective KPI value is considered under control.
The report below gives you the number of devices with prohibited applications installed in them.
The reports above are generated using ManageEngine Analytics Plus, an AI-enabled analytics solution custom built for IT users.
Click here to check out more interesting reports and dashboards built using Analytics Plus.
Schedule a personalized demo of Analytics Plus today with one of our solution experts and get answers to all your product-related questions. Or, get a free trial of Analytics Plus and explore the app on your own.
 Sailakshmi
Sailakshmi is an IT solutions expert at ManageEngine. Her focus is on understanding IT analytics and reporting requirements of organizations, and facilitating blended analytics programs to help clients gain intelligent business insights. She currently spearheads marketing activities for ManageEngine's advanced analytics platform, Analytics Plus.