Monitor your ClickHouse deployments with Applications Manager
Modern applications generate data at a scale that was unimaginable just a few years ago. Every user interaction, transaction, log entry, and system event produces a stream of data that organizations want to capture, analyze, and act on.
As organizations collect billions of these events every day, traditional databases often struggle to keep up with analytical workloads. Queries that need to scan millions of rows, aggregate across large datasets, or power real-time dashboards simply weren't what row-oriented databases were built for.
That's why engineering and data teams have turned to online analytical processing (OLAP) databases for high-speed analytical queries on large volumes of data. ClickHouse has earned a strong reputation in this space, widely adopted by companies across retail, banking, telecommunications, and SaaS for the speed and efficiency it brings to analytical workloads.
As ClickHouse deployments become central to business intelligence platforms, observability pipelines, log analytics, customer analytics, and fraud detection systems, maintaining their performance and availability is a critical operational requirement.
ManageEngine Applications Manager now supports ClickHouse monitoring as part of its comprehensive database monitoring capabilities, giving IT operations, DBAs, and platform teams the visibility they need to keep these workloads healthy and performing.
What is ClickHouse?
ClickHouse is an open-source, column-oriented OLAP database designed to process massive datasets and return results for complex analytical queries in seconds. Unlike traditional relational databases optimized for transactional workloads, ClickHouse uses a columnar storage model that makes it exceptionally fast at scanning, filtering, and aggregating large volumes of data.
Organizations use ClickHouse to power a wide range of analytical use cases from business intelligence dashboards and customer behavior analytics to log analysis, fraud detection, and operational reporting.
As ClickHouse becomes the backbone of business-critical analytics, the database itself becomes a dependency that teams need to actively monitor.
ClickHouse introduces a new dimension to database monitoring
IT and database teams are accustomed to monitoring relational databases, tracking connections, query performance, and storage. ClickHouse operates differently, and at a much larger scale, which introduces a new set of monitoring needs.
Teams now need answers to questions such as:
How many queries are running, and how many are failing or running long?
Are insert operations being delayed or experiencing failures?
How are memory and disk resources being consumed?
Are background merge operations running efficiently?
Is replication keeping up across nodes, or are there lags and failures?
Are ZooKeeper coordination issues affecting cluster stability?
Are thread and I/O bottlenecks affecting query throughput?
This is where ClickHouse monitoring in Applications Manager comes in, bringing these signals into a single, unified monitoring environment.
Supported metrics
Applications Manager monitors ClickHouse through Prometheus-based data collection. ClickHouse exposes its internal metrics via Prometheus, and Applications Manager visualizes performance data across query activity, resource usage, replication health, and more. This means teams can get deep visibility into ClickHouse internals without building a custom monitoring pipeline from scratch.
Metric | What it helps IT teams understand |
Response time, server uptime, DB instances | Whether the database is available and responding normally, and how overall health trends over time. |
Active connections and connection types | How many connections are open and what kind, helping teams spot unusual connection spikes or exhaustion. |
Query volumes, active queries, failed queries | How much workload the database is handling and whether queries are completing successfully or hitting errors. |
Long-running queries | Which queries are taking too long, making it easier to identify and fix inefficiencies before they affect users. |
Insert operations, insert bytes, insert delays | Whether data ingestion is healthy or experiencing slowdowns that could affect the freshness of analytical results. |
Memory usage and disk usage | How system resources are being consumed, helping teams prevent exhaustion and plan capacity proactively. |
Merge operations and scheduled pool tasks | Whether background storage operations are keeping up, which directly affects query performance over time. |
Data size, row count, partition structure | How data is distributed in storage, helping teams detect inefficiencies in how data is organized and managed. |
Replication queue size, read-only replicas, part fetches, potential data loss | Whether replicas are staying in sync and whether any nodes are at risk of falling behind or losing data. |
ZooKeeper active sessions, requests, transactions | Whether the coordination layer supporting the cluster is healthy and not becoming a bottleneck. |
Network and disk I/O throughput | How much data is being read from and written to disk and network, useful for identifying I/O-related slowdowns. |
Total, active, and idle threads | Whether the database has enough threads to handle concurrency demands or is experiencing contention. |
Open files and distributed tables | Whether the cluster is at risk of system-level failures due to file handle limits or distributed table issues. |
Monitor ClickHouse and your entire application stack with Applications Manager
A business intelligence dashboard, a fraud detection system, or a customer analytics platform doesn't depend on ClickHouse alone. It relies on a chain of components such as application servers, APIs, cloud infrastructure, and the database layer, all of which contribute to the final experience.
Applications Manager brings these components together within a unified observability platform. By correlating ClickHouse metrics with application, infrastructure, and cloud monitoring data, you can identify performance bottlenecks faster, reduce mean time to resolution, and troubleshoot issues without switching between multiple monitoring tools.
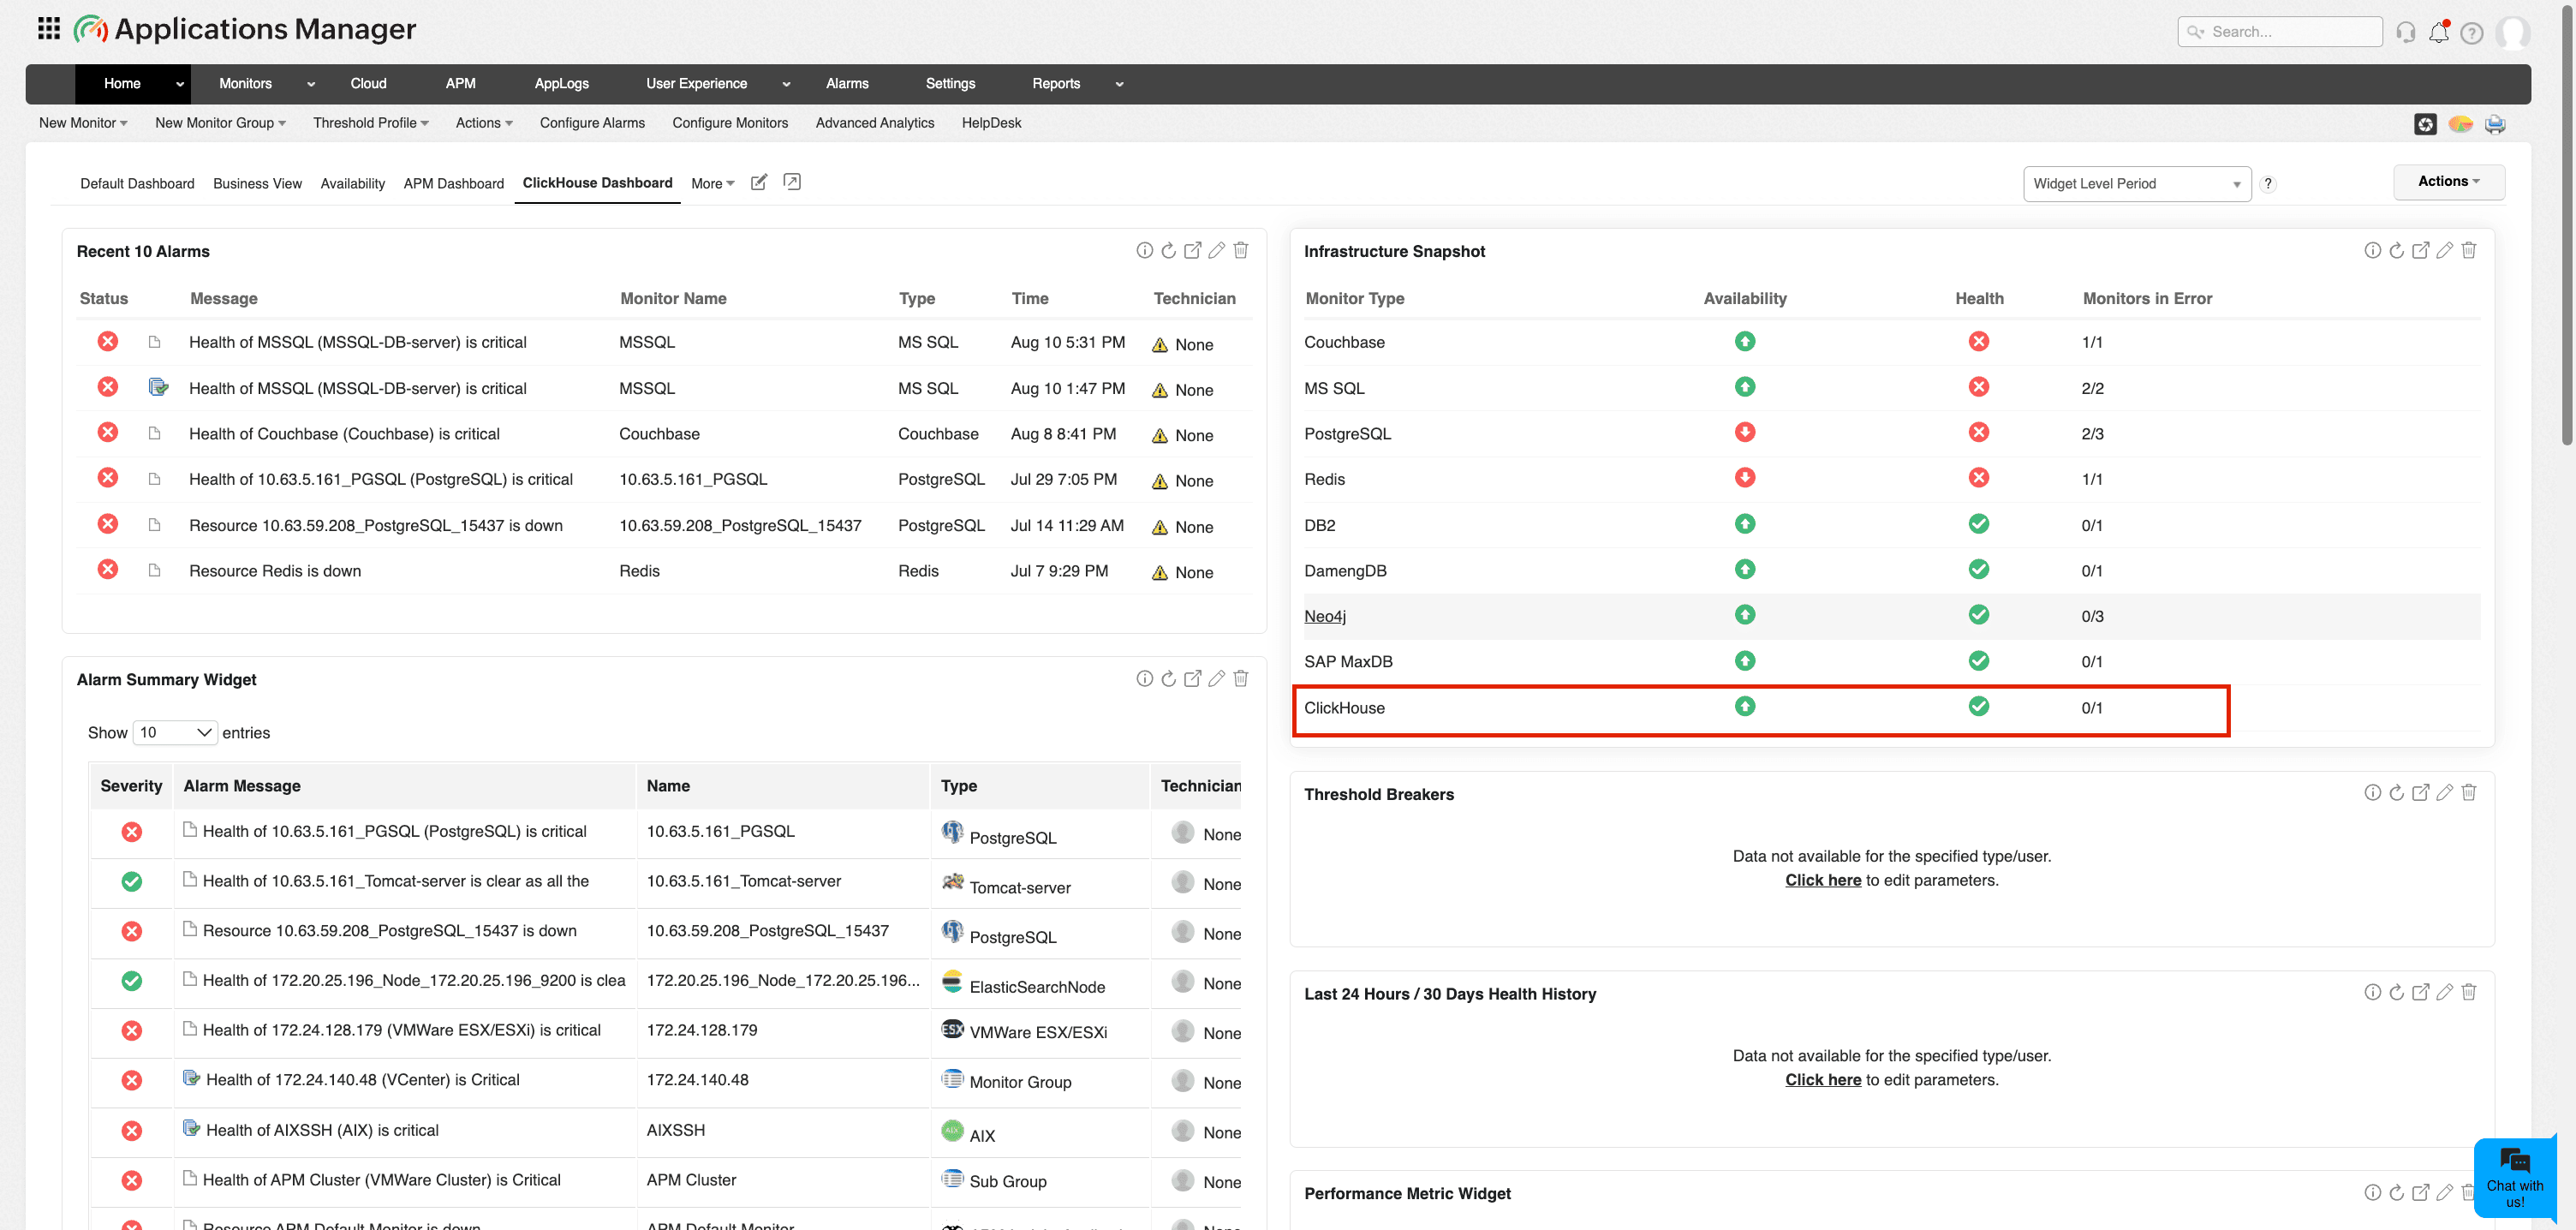
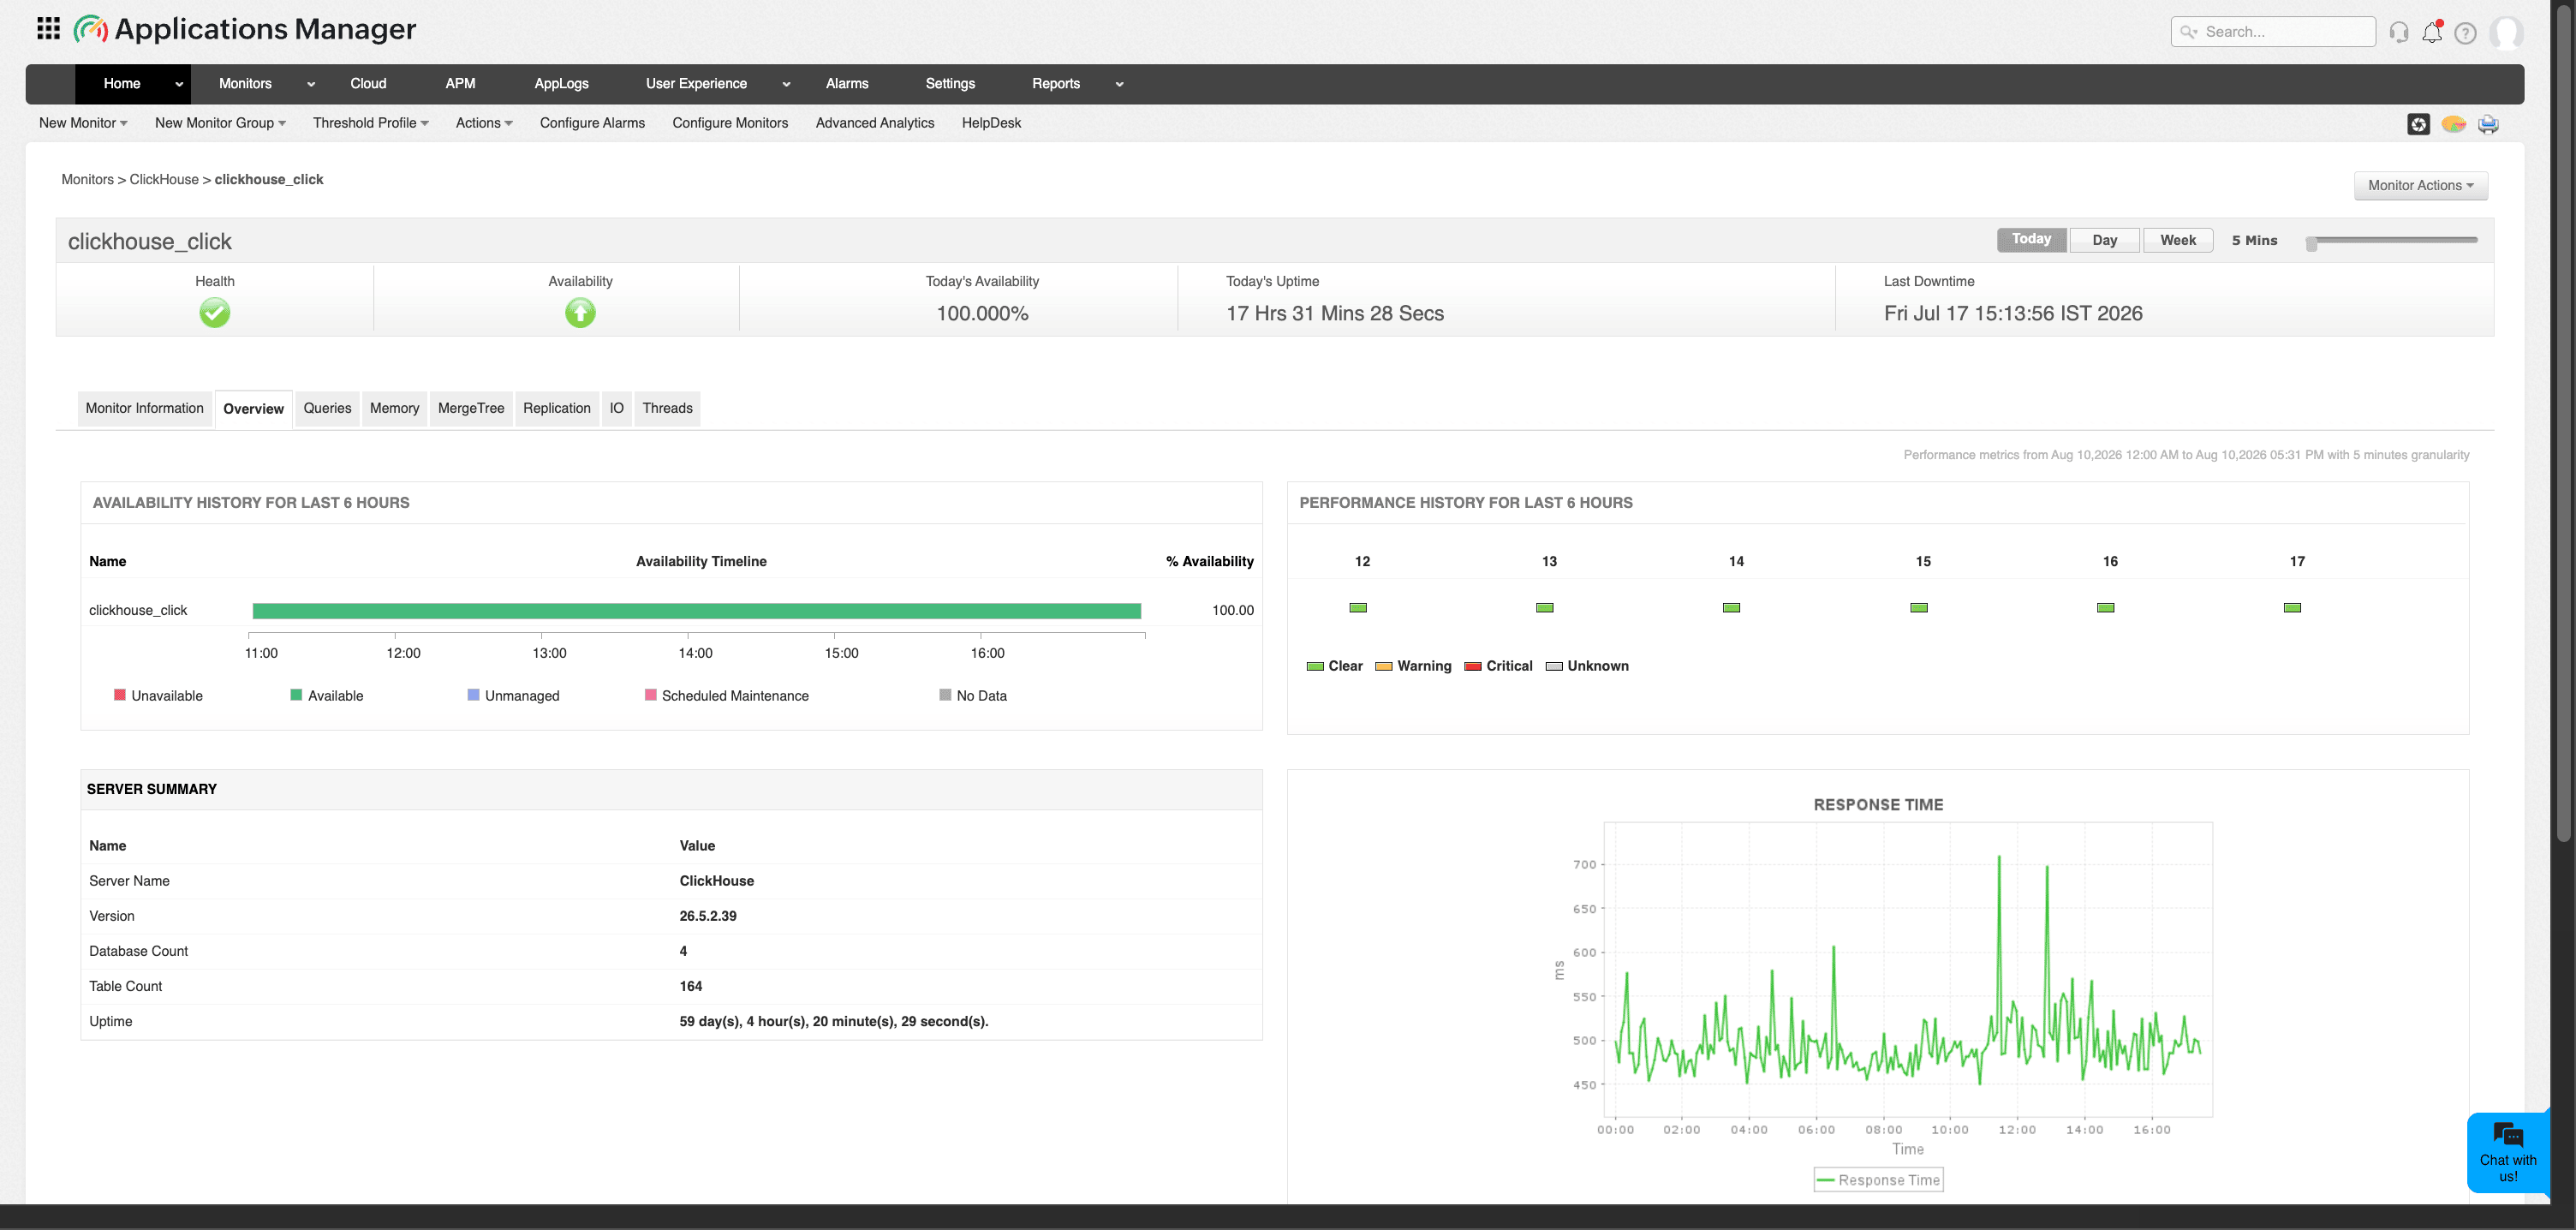
ClickHouse monitoring is available for both ClickHouse cloud and self-hosted deployments. Refer our ClickHouse database monitoring documentation for set up details.
If you're new to Applications Manager, download a 30-day, free trial.